Integrating serological and genetic data to quantify cross-species transmission: brucellosis as a case study
- PMID: 26935267
- PMCID: PMC4873909
- DOI: 10.1017/S0031182016000044
Integrating serological and genetic data to quantify cross-species transmission: brucellosis as a case study
Abstract
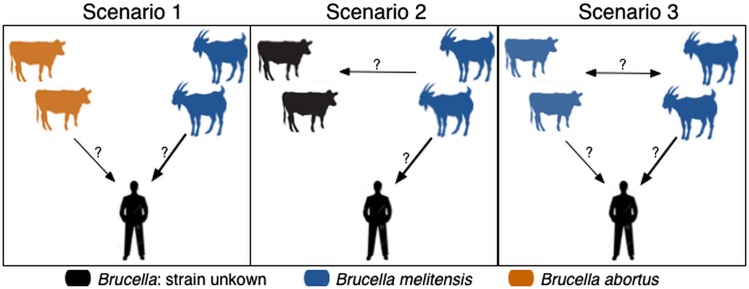
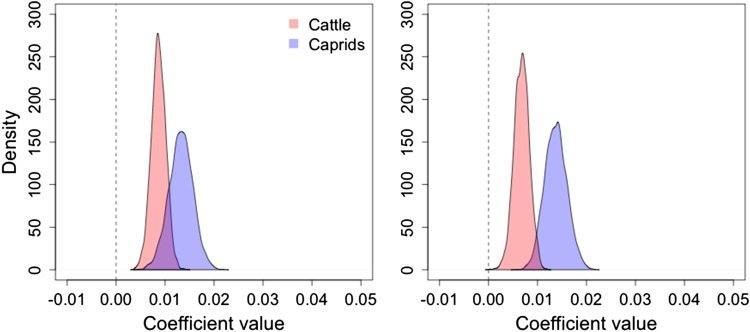
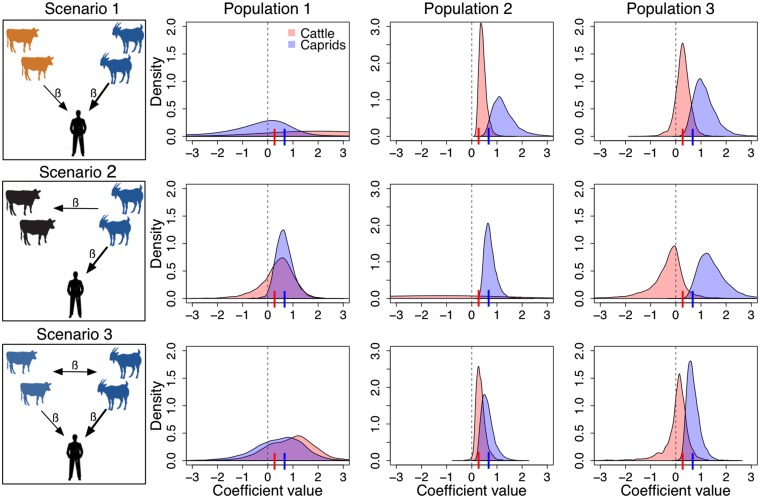
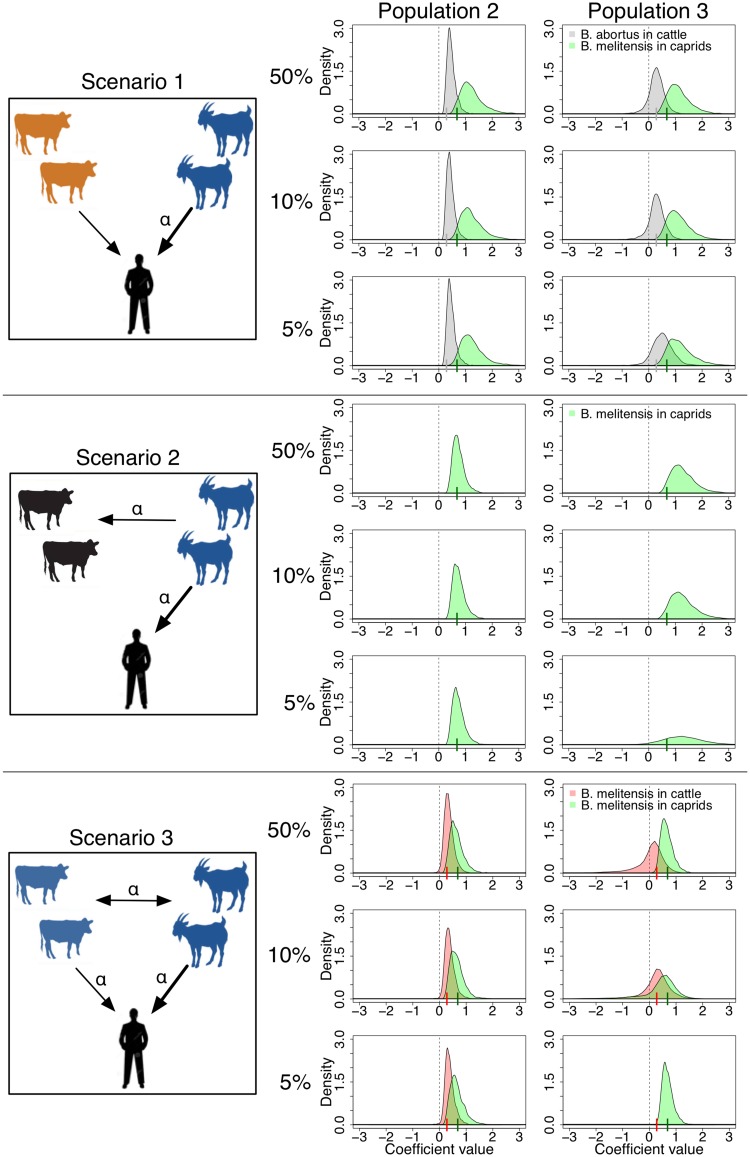
Epidemiological data are often fragmented, partial, and/or ambiguous and unable to yield the desired level of understanding of infectious disease dynamics to adequately inform control measures. Here, we show how the information contained in widely available serology data can be enhanced by integration with less common type-specific data, to improve the understanding of the transmission dynamics of complex multi-species pathogens and host communities. Using brucellosis in northern Tanzania as a case study, we developed a latent process model based on serology data obtained from the field, to reconstruct Brucella transmission dynamics. We were able to identify sheep and goats as a more likely source of human and animal infection than cattle; however, the highly cross-reactive nature of Brucella spp. meant that it was not possible to determine which Brucella species (B. abortus or B. melitensis) is responsible for human infection. We extended our model to integrate simulated serology and typing data, and show that although serology alone can identify the host source of human infection under certain restrictive conditions, the integration of even small amounts (5%) of typing data can improve understanding of complex epidemiological dynamics. We show that data integration will often be essential when more than one pathogen is present and when the distinction between exposed and infectious individuals is not clear from serology data. With increasing epidemiological complexity, serology data become less informative. However, we show how this weakness can be mitigated by integrating such data with typing data, thereby enhancing the inference from these data and improving understanding of the underlying dynamics.
Keywords: Bayesian modelling; brucellosis; data integration; epidemiological modelling; genetics; serology; state-space models.
Figures
References
-
- Basanez M. G., Marshall C., Carabin H., Gyorkos T. and Joseph L. (2004). Bayesian statistics for parasitologists. Trends in Parasitology 20, 85–91. - PubMed
-
- Bouley A. J., Biggs H. M., Stoddard R. A., Morrissey A. B., Bartlett J. A., Afwamba I. A., Maro V. P., Kinabo G. D., Saganda W., Cleaveland S. and Crump J. A. (2012). Brucellosis among hospitalized febrile patients in Northern Tanzania. American Journal of Tropical Medicine and Hygiene 87, 1105–1111. - PMC - PubMed
-
- Broemeling L. D. (2014). Bayesian Methods in Epidemiology. CRC Press, Taylor & Francis Group, Boca Raton.
-
- Burnham K. P. and Anderson D. R. (2002). Model Selection and Multimodal Inference: a Practical Information-Theoretic Approach, 2nd Edn Springer, New York.
Publication types
MeSH terms
Grants and funding
- BB/J010367/1/BB_/Biotechnology and Biological Sciences Research Council/United Kingdom
- BB/L018845/1/BB_/Biotechnology and Biological Sciences Research Council/United Kingdom
- BB/L018926/1/BB_/Biotechnology and Biological Sciences Research Council/United Kingdom
- R01 TW009237/TW/FIC NIH HHS/United States
LinkOut - more resources
Full Text Sources
Other Literature Sources
Miscellaneous