. 2016 Mar 3:6:22536.
doi: 10.1038/srep22536.

Population Code Dynamics in Categorical Perception

Affiliations

Population Code Dynamics in Categorical Perception

Chihiro I Tajima et al. Sci Rep. .

Abstract

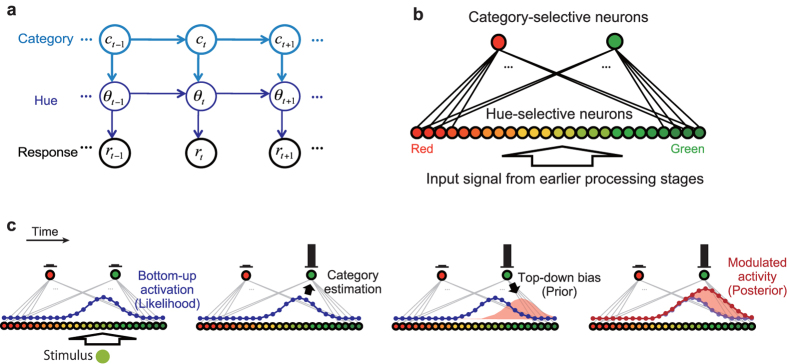
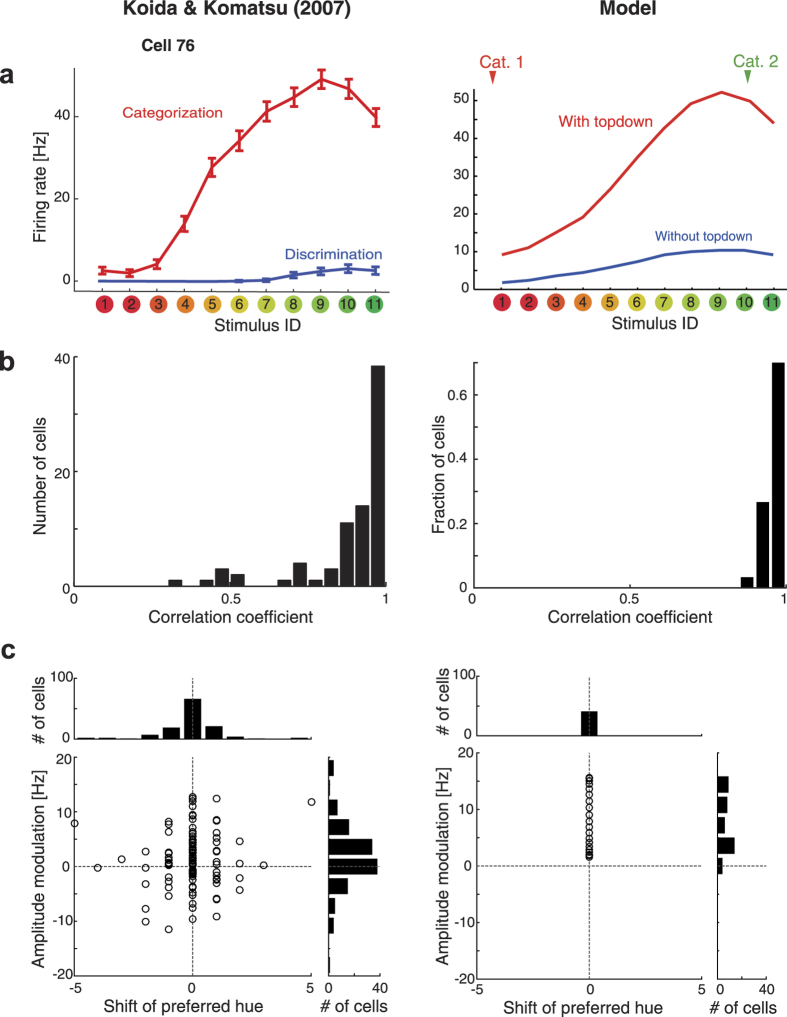
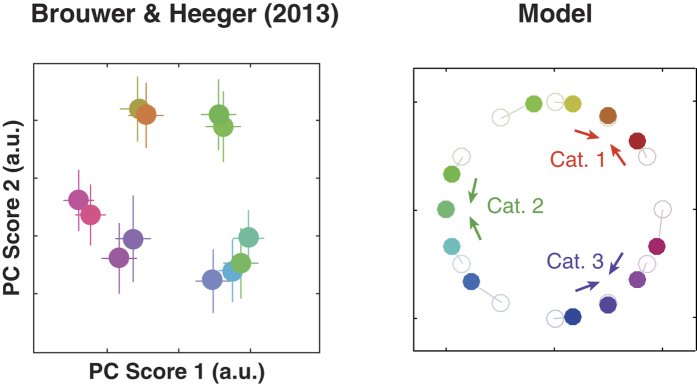
Categorical perception is a ubiquitous function in sensory information processing, and is reported to have important influences on the recognition of presented and/or memorized stimuli. However, such complex interactions among categorical perception and other aspects of sensory processing have not been explained well in a unified manner. Here, we propose a recurrent neural network model to process categorical information of stimuli, which approximately realizes a hierarchical Bayesian estimation on stimuli. The model accounts for a wide variety of neurophysiological and cognitive phenomena in a consistent framework. In particular, the reported complexity of categorical effects, including (i) task-dependent modulation of neural response, (ii) clustering of neural population representation, (iii) temporal evolution of perceptual color memory, and (iv) a non-uniform discrimination threshold, are explained as different aspects of a single model. Moreover, we directly examine key model behaviors in the monkey visual cortex by analyzing neural population dynamics during categorization and discrimination of color stimuli. We find that the categorical task causes temporally-evolving biases in the neuronal population representations toward the focal colors, which supports the proposed model. These results suggest that categorical perception can be achieved by recurrent neural dynamics that approximates optimal probabilistic inference in the changing environment.


Figures

Figure 1
Figure 1. Model of online categorical inference.
(a) Graphical model of chromatic stimulus observation. The neural response at each time is evoked by a hue value that is generated according to the color category. The arrows represent the probabilistic dependencies. (b) Architecture of the neural network that implements the statistical inference on the stimulus colors. The hue-selective neurons represent the continuous value of hue while the category-selective neurons represent the discrete color categories, such as “red” or “green.” The bottom-up input signal from the earlier stage is first received by the hue-selective neurons, and then the network decodes the hue and category through the interaction between two neural populations. We assume a one-dimensional hue space as a color space for simplicity, though the dimension can be extended to two or three. (c) Cycle of the modeled activity modulation in the network. The figure depicts four snapshots: from left to right, (i) the initial activity of the hue-selective neurons, (ii) the category estimation from the population activity of the hue-selective neurons, (iii) top-down bias signal based on the estimated category, and (iv) the modulated activity of the hue-selective population. The dotted curves above the hue-selective neuron layer represent the population activity, where the height of each dot schematically illustrates the magnitude of each neural activity. The activity magnitude of category-selective neurons are schematically indicated by the length of black bars above them.
Figure 2
Figure 2. Model replicates the tuning modulations in color selective neurons in visual cortex.
(Left) Tuning curve data from a macaque IT cortex. Data from Ref. . (Right) Effect of the top-down modulation on the tuning curve of a single neuron in the model. (a) Tuning curve of a single representative neuron. In the data, the response gain is modulated by the task demands, corresponding to the behavior of the model neuron. In the model, the top-down signal modulates the response gains of individual neurons. The error bars indicate the standard error of mean across trials (N = 16). (b) The stability of the stimulus selectivity in individual neurons. The plots show the distributions of Pearson’s correlation coefficient between the tuning curves obtained in categorization and in discrimination for each neuron. A coefficient 1 indicates that the neuron had identical stimulus selectivity during the categorization and discrimination tasks. (c) The scatter plots compare the modulation of response amplitude (mean response over all the stimuli) with the shift in preferred stimulus (the sample color that evoked the largest response in each cell). Each circle represents a single neuron. The histograms above the scatter plot show the distribution of the preferred stimulus shift; the histograms on the right show the distribution of the response amplitude modulation. In the experimental data (the left panels), effects were quantified by the differences between the categorization and discrimination tasks (categorization – discrimination). In the simulation (the right panels), the effect was quantified by the difference between with and without top-down effect (with top-down – without top-down).
Figure 3
Figure 3. The model replicates clustering of population representation toward categorical centers under the categorical effects.
(Left) Human VO1 responses to color stimuli, where multi-voxel patterns of fMRI neural activation were embedded in the first and the second principle components. Data replotted from Ref. . (Right) The model prediction. The vertical and horizontal axes represent a two-dimensional stimulus space, where the direction from the origin corresponds to stimulus hue while the deviation from the origin corresponds to the vividness of color (i.e., the origin corresponds to the white point). The colored dots indicate the stimulus properties represented by simulated neural population activities, by “decoding” the population activity [which is done by projecting the combinations of (peak locus, peak height) to the corresponding positions of this space]. Light-colored dots indicate the input stimuli while the dark-colored dots represent the neural population representation. The colors of markers correspond to those of presented stimuli. Here, we assumed three categories whose centers were in direction of formula image, formula image, and formula image radians. The figure demonstrates that neuronal representations are biased towards the categorical centers. We used the same parameters as in Fig. 2 for consistency across the simulations; note that the strength of clustering depends on the magnitude of top-down interaction.
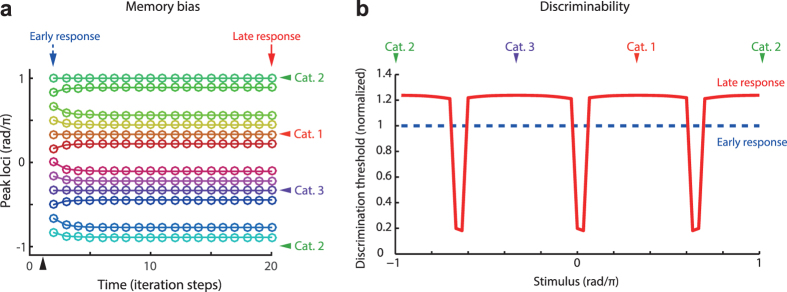
Figure 4
Figure 4. The model explains categorical effects on the bias and discrimination threshold in memorized color.
(a) Temporal evolution of activity peak. The colored markers indicate the loci of peaks in the modeled neural population for each time step of simulation. The traces for 12 different stimuli are superimposed, where the colors of traces correspond to those of presented stimuli. The black arrow head on the horizontal axis indicates the timing of the stimulus onset. (b) The categorical effects on the stimulus discriminability. The solid curve indicates the threshold computed with the late response (time step = 20) after the stimulus onset; the dashed line indicates the threshold computed with the early response (time step = 2). The time points correspond to the solid and dashed arrows in panel a. The discrimination thresholds were normalized by that of the early response. Here the figures show the case in which three categorical centers were located uniformly on the hue circle. In panels a and b, the colored arrow heads with “Cat. x” indicate loci of the categorical centers.
Figure 5
Figure 5. Comparing model behaviors with population dynamics in macaque IT cortex.
(a) Modulation of the population activity during the categorization and discrimination tasks. The dots represent the average activity of neurons that prefer each of 11 stimulus colors. The curves are Gaussian fits of the population activity. The error bars indicate the standard errors of mean across neurons preferring each stimulus. (b) Activity distribution over the simulated hue-selective neural population (corresponding to panel a). The model predicts that the locus of maximum activity will shift toward the category center. (c) Dynamics of the peak loci in population activity, represented as differences between categorization and discrimination (the similar results were obtained for differences between fixation [passive viewing] and discrimination, Supplementary Fig. S2). The data are normalized by the difference at 100 ms after the stimulus presentation. The positive value indicates the shift toward green, and the negative value indicates the shift toward red. The units of the vertical axis is the difference in terms of the visual stimulus index (from stimuli 1 to 11). The color and number indicates the input stimulus hue. Stimuli #1 and #11 (two extremes in “red” and “green” directions) were omitted from the plot since the peak estimates with Gaussian fit were not reliable for those data due to the boundary effect. (d) Dynamics of peak hue modulations predicted by simulated neural population (corresponding to panel c). The error bar on the right of the plot indicates the bootstrap standard deviation (100 resampling) averaged over the stimuli and time bins. (e) Averaged peak loci for later responses (450–550 ms: the shaded area in panel c). The horizontal axis corresponds to the physical stimulus, while the vertical axis represents the difference in the peak loci for the categorization and discrimination tasks (the dark line), or in the fixation and discrimination tasks (see also Supplementary Fig. S1). The error bars are the bootstrap standard deviations (100 resampling). The blue curve depicts the peak hue shift predicted by the model (with category boundary located around stimulus 5, as indicated by the arrow). (f) Behavioral results in the categorization task. The arrow indicates the sample color corresponding to the categorical boundary. In these analyses, we analyzed the neural activities at or later than 100 ms after the stimulus presentation, because the earlier neural activities were weak and we could not obtain robust estimates for the peak loci of population activity.

Similar articles

Cited by

References

    1. Komatsu H., Ideura Y., Kaji S. & Yamane S. Color selectivity of neurons in the inferior temporal cortex of the awake macaque monkey. J. Neurosci. 12, 408–424 (1992). - PMC - PubMed
    1. Wachtler T., Sejnowski T. J. & Albright T. D. Representation of color stimuli in awake macaque primary visual cortex. Neuron 37, 681–91 (2003). - PMC - PubMed
    1. Namima T., Yasuda M., Banno T., Okazawa G. & Komatsu H. Effects of Luminance Contrast on the Color Selectivity of Neurons in the Macaque Area V4 and Inferior Temporal Cortex. J. Neurosci. 34, 14934–14947 (2014). - PMC - PubMed
    1. Zeki S. & Marini L. Three cortical stages of colour processing in the human brain. Brain 121, 1669–1685 (1998). - PubMed
    1. Zeki S. M. Colour coding in rhesus monkey prestriate cortex. Brain Res. 53, 422–427 (1973). - PubMed

Publication types

LinkOut - more resources