

Aflibercept, Bevacizumab, or Ranibizumab for Diabetic Macular Edema: Two-Year Results from a Comparative Effectiveness Randomized Clinical Trial
- PMID: 26935357
- PMCID: PMC4877252
- DOI: 10.1016/j.ophtha.2016.02.022
Aflibercept, Bevacizumab, or Ranibizumab for Diabetic Macular Edema: Two-Year Results from a Comparative Effectiveness Randomized Clinical Trial
Abstract
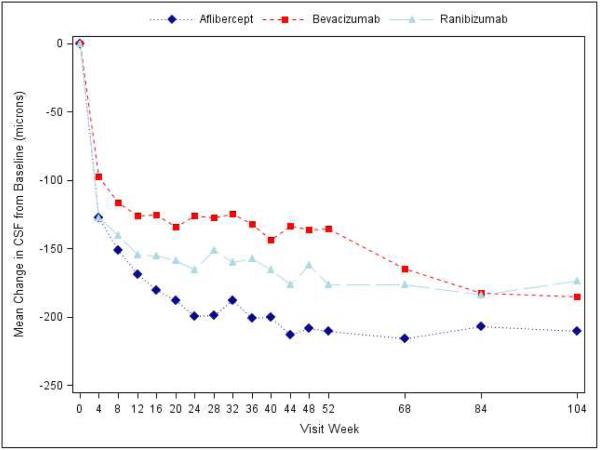
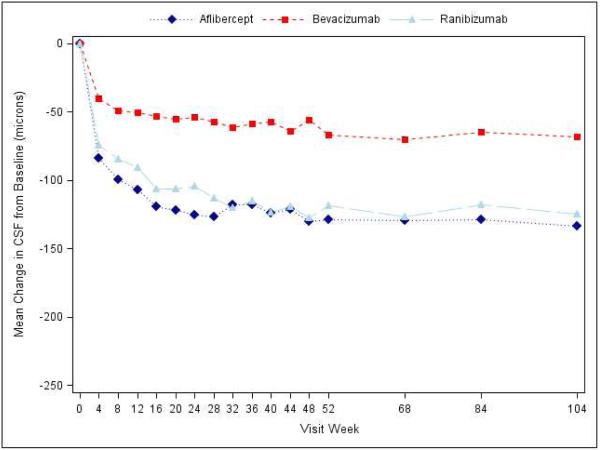
Purpose: To provide 2-year results comparing anti-vascular endothelial growth factor (VEGF) agents for center-involved diabetic macular edema (DME) using a standardized follow-up and retreatment regimen.
Design: Randomized clinical trial.
Participants: Six hundred sixty participants with visual acuity (VA) impairment from DME.
Methods: Randomization to 2.0-mg aflibercept, 1.25-mg repackaged (compounded) bevacizumab, or 0.3-mg ranibizumab intravitreous injections performed up to monthly using a protocol-specific follow-up and retreatment regimen. Focal/grid laser photocoagulation was added after 6 months if DME persisted. Visits occurred every 4 weeks during year 1 and were extended up to every 4 months thereafter when VA and macular thickness were stable.
Main outcome measures: Change in VA, adverse events, and retreatment frequency.
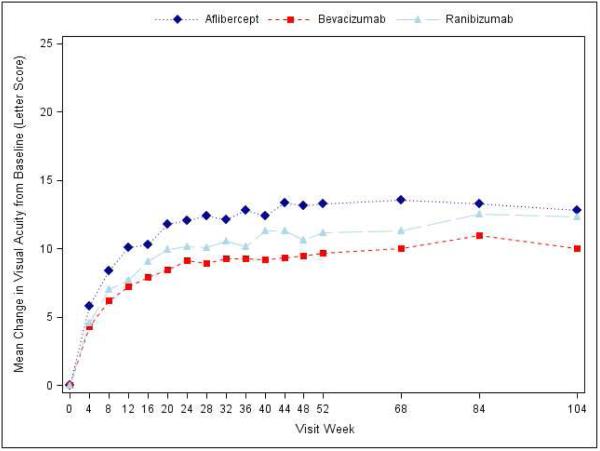
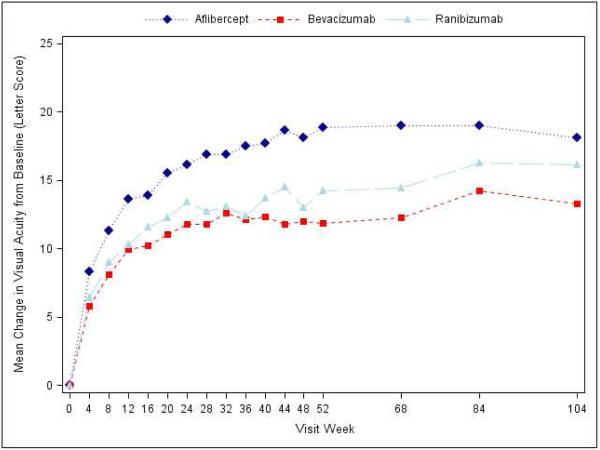
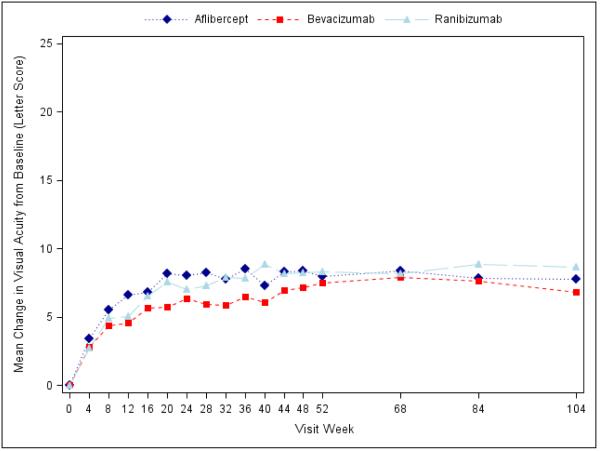
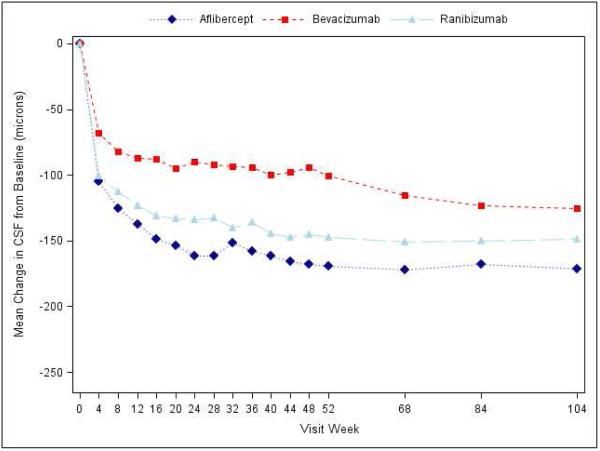
Results: Median numbers of injections were 5, 6, and 6 in year 2 and 15, 16, and 15 over 2 years in the aflibercept, bevacizumab, and ranibizumab groups, respectively (global P = 0.08). Focal/grid laser photocoagulation was administered in 41%, 64%, and 52%, respectively (aflibercept vs. bevacizumab, P < 0.001; aflibercept vs. ranibizumab, P = 0.04; bevacizumab vs. ranibizumab, P = 0.01). At 2 years, mean VA improved by 12.8, 10.0, and 12.3 letters, respectively. Treatment group differences varied by baseline VA (P = 0.02 for interaction). With worse baseline VA (20/50 to 20/320), mean improvement was 18.1, 13.3, and 16.1 letters, respectively (aflibercept vs. bevacizumab, P = 0.02; aflibercept vs. ranibizumab, P = 0.18; ranibizumab vs. bevacizumab, P = 0.18). With better baseline VA (20/32 to 20/40), mean improvement was 7.8, 6.8, and 8.6 letters, respectively (P > 0.10, for pairwise comparisons). Anti-Platelet Trialists' Collaboration (APTC) events occurred in 5% with aflibercept, 8% with bevacizumab, and 12% with ranibizumab (global P = 0.047; aflibercept vs. bevacizumab, P = 0.34; aflibercept vs. ranibizumab, P = 0.047; ranibizumab vs. bevacizumab, P = 0.20; global P = 0.09 adjusted for potential confounders).
Conclusions: All 3 anti-VEGF groups showed VA improvement from baseline to 2 years with a decreased number of injections in year 2. Visual acuity outcomes were similar for eyes with better baseline VA. Among eyes with worse baseline VA, aflibercept had superior 2-year VA outcomes compared with bevacizumab, but superiority of aflibercept over ranibizumab, noted at 1 year, was no longer identified. Higher APTC event rates with ranibizumab over 2 years warrants continued evaluation in future trials.
Copyright © 2016 American Academy of Ophthalmology. All rights reserved.
Figures
Comment in
-
Aflibercept is better drug for diabetic macular oedema, study finds.BMJ. 2016 Feb 28;352:i1196. doi: 10.1136/bmj.i1196. BMJ. 2016. PMID: 26929279 No abstract available.
-
Reply.Ophthalmology. 2017 Jan;124(1):e5-e6. doi: 10.1016/j.ophtha.2016.04.032. Ophthalmology. 2017. PMID: 27993277 Free PMC article. No abstract available.
-
Re: Wells et al.: Aflibercept, bevacizumab, or ranibizumab for diabetic macular edema: two-year results from a comparative effectiveness randomized clinical trial (Ophthalmology 2016;123:1351-1359).Ophthalmology. 2017 Jan;124(1):e5. doi: 10.1016/j.ophtha.2016.03.052. Ophthalmology. 2017. PMID: 27993278 No abstract available.
-
Re: Wells et al.: Aflibercept, Bevacizumab, or Ranibizumab for diabetic macular edema: Two-year results from a comparative effectiveness randomized clinical trial (Ophthalmology 2016;123:1351-1358).Ophthalmology. 2017 Mar;124(3):e25-e26. doi: 10.1016/j.ophtha.2016.06.064. Ophthalmology. 2017. PMID: 28219508 No abstract available.
-
Reply.Ophthalmology. 2017 Mar;124(3):e26-e27. doi: 10.1016/j.ophtha.2016.07.001. Ophthalmology. 2017. PMID: 28219510 No abstract available.
-
Re: Wells et al.: Aflibercept, Bevacizumab, or Ranibizumab for diabetic macular edema: two year results from a comparative effectiveness randomized clinical trial (Ophthalmology. 2016;123:1351-1359).Ophthalmology. 2017 Apr;124(4):e37-e38. doi: 10.1016/j.ophtha.2016.08.034. Ophthalmology. 2017. PMID: 28335948 No abstract available.
-
Reply.Ophthalmology. 2017 Apr;124(4):e38-e39. doi: 10.1016/j.ophtha.2016.08.032. Ophthalmology. 2017. PMID: 28335949 No abstract available.
References
-
- Brown DM, Schmidt-Erfurth U, Do DV, et al. Intravitreal Aflibercept for Diabetic Macular Edema: 100-Week Results From the VISTA and VIVID Studies. Ophthalmology. 2015 - PubMed
-
- Nguyen QD, Brown DM, Marcus DM, et al. Ranibizumab for Diabetic Macular Edema: Results from 2 Phase III Randomized Trials: RISE and RIDE. Ophthalmology. 2012;119(4):789–801. - PubMed
