. 2016 Mar;13(116):20160070.
doi: 10.1098/rsif.2016.0070.

Estimating oxygen distribution from vasculature in three-dimensional tumour tissue

Affiliations

Estimating oxygen distribution from vasculature in three-dimensional tumour tissue

David Robert Grimes et al. J R Soc Interface. 2016 Mar.

Erratum in

Abstract

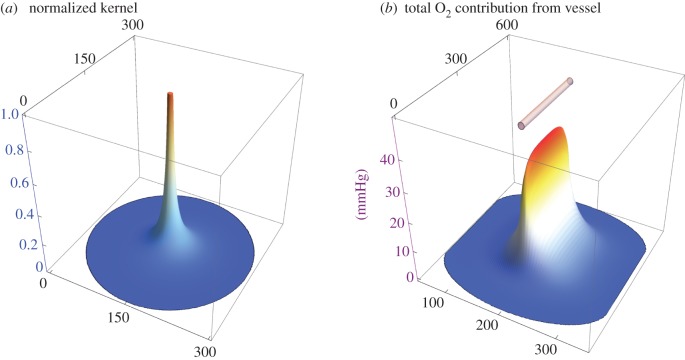
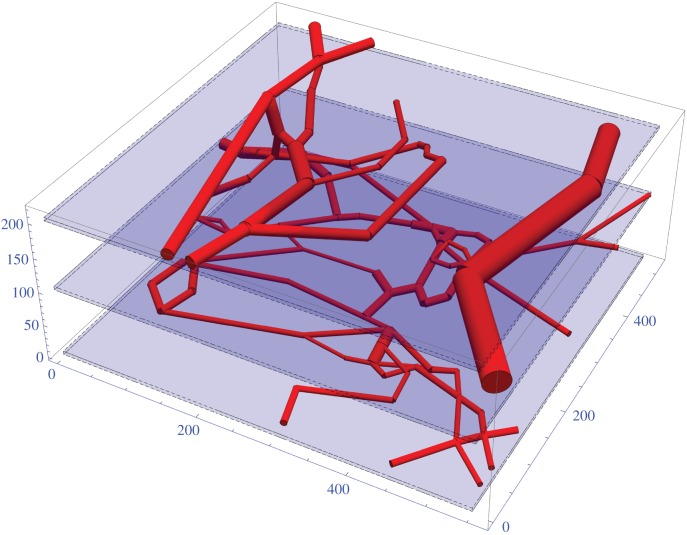
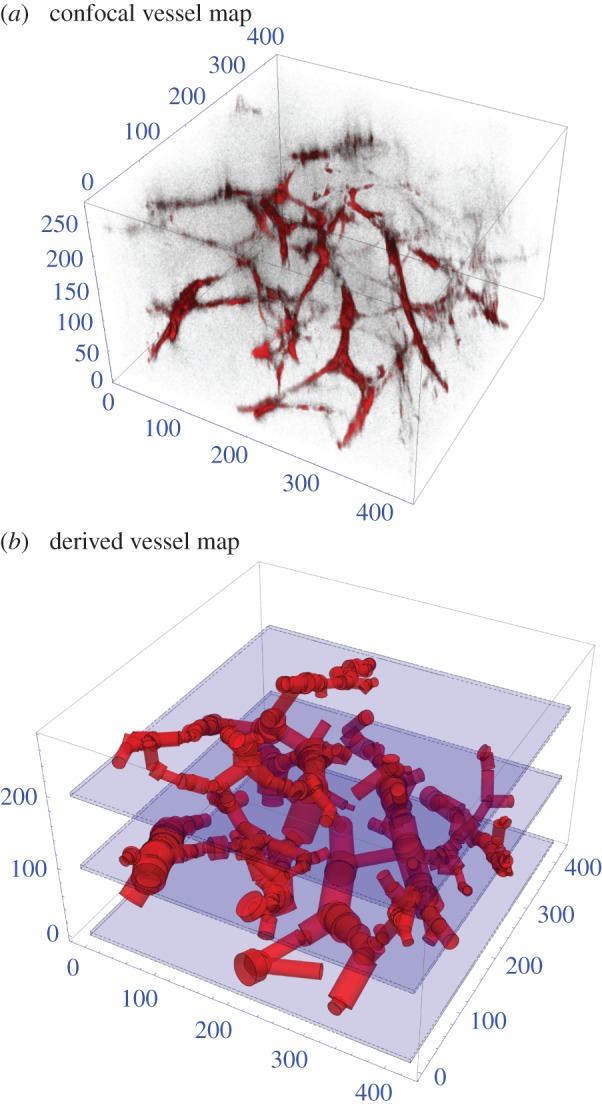
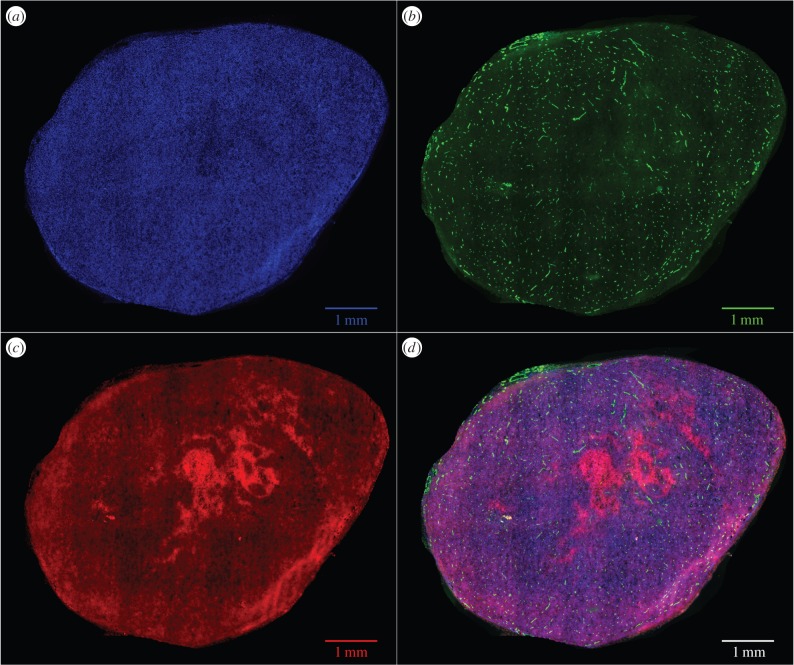
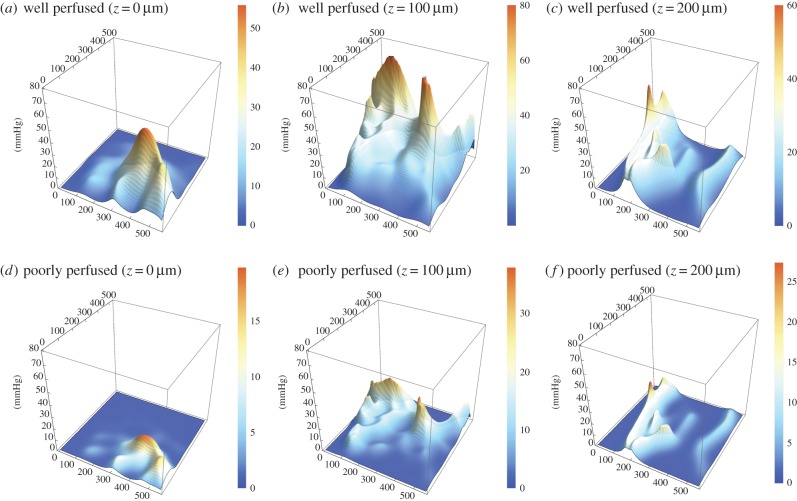
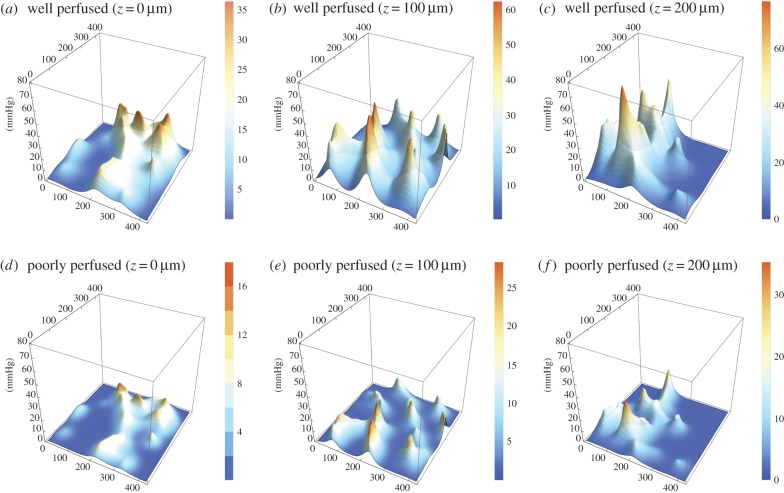
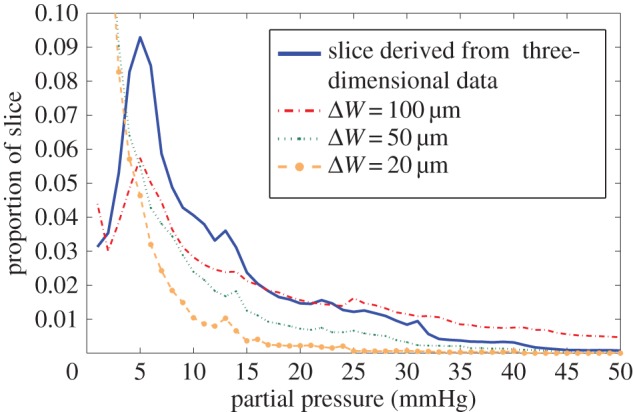
Regions of tissue which are well oxygenated respond better to radiotherapy than hypoxic regions by up to a factor of three. If these volumes could be accurately estimated, then it might be possible to selectively boost dose to radio-resistant regions, a concept known as dose-painting. While imaging modalities such as 18F-fluoromisonidazole positron emission tomography (PET) allow identification of hypoxic regions, they are intrinsically limited by the physics of such systems to the millimetre domain, whereas tumour oxygenation is known to vary over a micrometre scale. Mathematical modelling of microscopic tumour oxygen distribution therefore has the potential to complement and enhance macroscopic information derived from PET. In this work, we develop a general method of estimating oxygen distribution in three dimensions from a source vessel map. The method is applied analytically to line sources and quasi-linear idealized line source maps, and also applied to full three-dimensional vessel distributions through a kernel method and compared with oxygen distribution in tumour sections. The model outlined is flexible and stable, and can readily be applied to estimating likely microscopic oxygen distribution from any source geometry. We also investigate the problem of reconstructing three-dimensional oxygen maps from histological and confocal two-dimensional sections, concluding that two-dimensional histological sections are generally inadequate representations of the three-dimensional oxygen distribution.

Keywords: cancer; hypoxia; modelling; oxygen; radiotherapy.


Figures

Figure 1.
Figure 1.
Line source model of a vessel with radius rv; at a perpendicular distance d from the vessel, contributions along z span −zmzzm.
Figure 2.
Figure 2.
(a) The kernel produced for a point source with 150 µm diffusion distance normalized to unity. (b) The resultant oxygen map taken through the central plane of the 200 µm vessel shown in the top of the figure, with an external partial pressure of 40 mmHg. The x- and y-axes in both parts of the figure depict displacement in micrometres.
Figure 3.
Figure 3.
Rendered vessel maps for a 104 segment 555 × 525 × 215 rat carcinoma. Slice planes are indicated by blue regions and discussed in text. All axes in micrometres.
Figure 4.
Figure 4.
(a) Confocal imaging of the 357 vessel sections in a 425 × 425 × 272 µm3 mouse tumour. (b) Vessel segmented through detection algorithm for this section. All axes in micrometres.
Figure 5.
Figure 5.
An MC-38 tumour, stained with (a) DAPI (blue), (b) vessel stain CD-31 (green), (c) hypoxia marker EF5 (red) and (d) all stained sections combined. Some regions of hypoxia are clearly visible in the light red regions, and more are apparent after image analysis.
Figure 6.
Figure 6.
Contour maps for rat carcinoma as measured by Secomb et al. (a) Well perfused, z = 0 µm, (b) well perfused, z = 100 µm, (c) well perfused, z = 200 µm, (d) poorly perfused, z = 0 µm, (e) poorly perfused, z = 100 µm, (f) poorly perfused, z = 200 µm. Note that z-axes are constant between figures, but colour function differs between plots to facilitate comparison.
Figure 7.
Figure 7.
Contour maps for perfusion stained MC-38 mouse tumour grown for this work. (a) Well perfused, z = 0 µm, (b) well perfused, z = 100 µm, (c) well perfused, z = 200 µm, (d) poorly perfused, z = 0 µm, (e) poorly perfused, z = 100 µm, (f) poorly perfused, z = 200 µm. Note that z-axes are constant between figures, but colour function differs between plots to facilitate comparison.
Figure 8.
Figure 8.
Oxygen histogram for a single slice of the MC-38 mouse tumour at z = 136 µm, derived from the full three-dimensional section and two-dimensional approximations created from vessel sections lying in the subvolume width ΔW. The oxygen histogram for two-dimensional slices does not in general represent the underlying distribution.

References

    1. Gray L, Conger A, Ebert M, Hornsey S, Scott O. 1953. The concentration of oxygen dissolved in tissues at the time of irradiation as a factor in radiotherapy. Br. J. Radiol. 26, 638–648. (10.1259/0007-1285-26-312-638) - DOI - PubMed
    1. Bertout JA, Patel SA, Simon MC. 2008. The impact of O2 availability on human cancer. Nat. Rev. Cancer 8, 967–975. (10.1038/nrc2540) - DOI - PMC - PubMed
    1. Hall E, Giaccia A. 2006. Radiobiology for the radiologist, 6th edn Philadelphia, PA: Lippincott William and Wilkins.
    1. Grimes DR, Partridge M. 2015. A mechanistic investigation of the oxygen fixation hypothesis and oxygen enhancement ratio. Biomed. Phys. Eng. Express. 1, 045209 (10.1088/2057-1976/1/4/045209) - DOI - PMC - PubMed
    1. Bentzen S, Gregoire V. 2011. Molecular-imaging-based dose painting—a novel paradigm for radiation therapy prescription. Semin. Radiat. Oncol. 21, 101–110. (10.1016/j.semradonc.2010.10.001) - DOI - PMC - PubMed

Publication types

MeSH terms

LinkOut - more resources