

The Lipid Bilayer Provides a Site for Cortisone Crystallization at High Cortisone Concentrations
- PMID: 26936102
- PMCID: PMC4776104
- DOI: 10.1038/srep22425
The Lipid Bilayer Provides a Site for Cortisone Crystallization at High Cortisone Concentrations
Abstract
Cortisone is an injected anti-inflammatory drug that can cause painful side effects known as "steroid flares" which are caused by cortisone crystallizing at the injection site. We used molecular dynamics simulations and X-ray diffraction to study the interaction of cortisone with model lipid membranes made of 1-palmitoyl-2-oleoyl-sn-glycero-3-phosphocholine (POPC) at drug concentrations from 0 mol% to 50 mol%. Cortisone was found to partition in the lipid bilayer and locate in the hydrophilic to hydrophobic interface of the membranes. Cortisone strongly affects the integrity of the membrane, as quantified by a decreased membrane thickness, increased area per lipid, and decreased lipid tail order parameters. At cortisone concentrations of more than 20 mol%, signals from crystallized cortisone were observed. These crystallites are embedded in the bilayers and orient with the membranes. While the cortisone molecules align parallel to the bilayers at low concentrations, they start to penetrate the hydrophobic core at higher concentrations. Trans-membrane crystallites start to nucleate when the membrane thickness has decreased such that cortisone molecules in the different leaflets can find partners from the opposite leaflet resulting in a non-zero density of cortisone molecules in the bilayer center. We suggest that the lipid bilayer provides a site for cortisone crystallization.
Figures
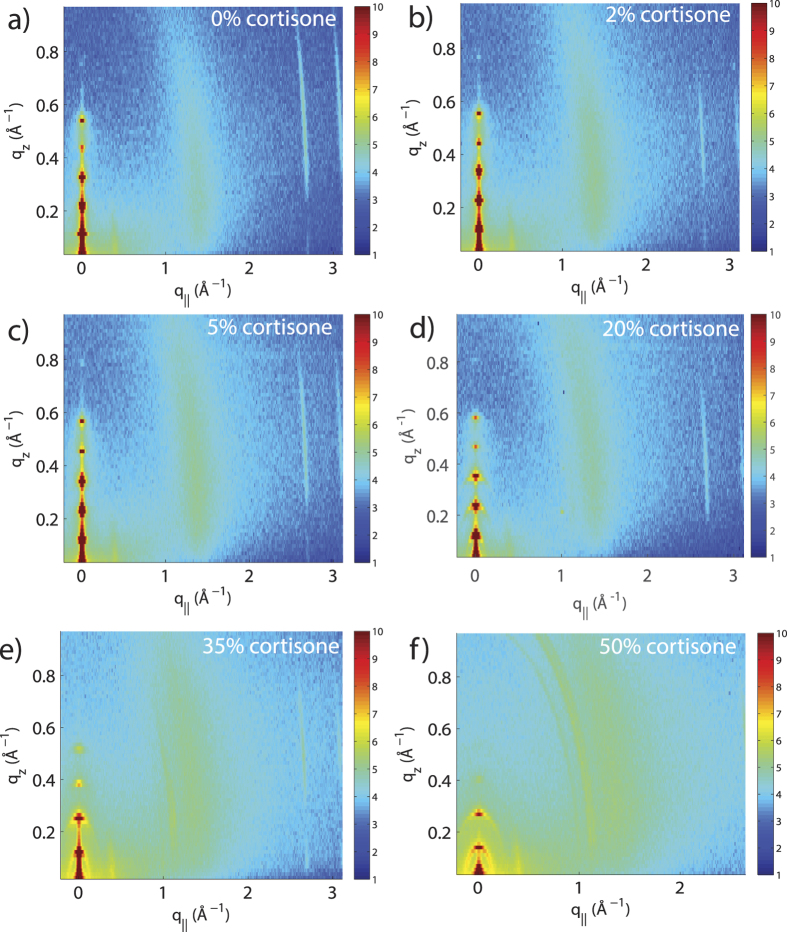
 , and a broad peak at
  , indicative of oriented fluid-phase membranes. At >20 mol%, additional peaks are observed in-plane indicating crystallization of cortisone.
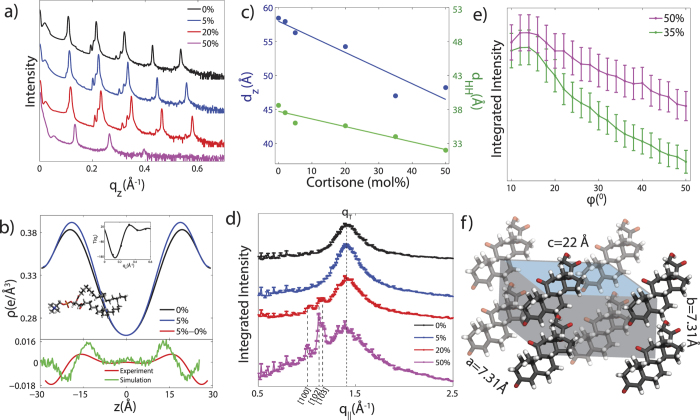
 Å, indicating the position of cortisone, and a negative peak at
  Å due to the thinning of the membrane. The difference curve from the MD simulations at 5 mol% is included for comparison. The slight disagreement in peak position and width between experiment in simulation is likely due to bilayer undulations. An example of
  is shown as an inset. (c) The lamellar spacing,
  , and the head-head distance,
  , as a function of cortisone concentration as determined from diffraction experiments. (d) Scattering along
  for the oriented membrane samples. Additional peaks, which appear for cortisone concentrations >20 mol%, can be indexed by crystalline cortisone. (e) The integrated intensities for the crystalline cortisone peak observed at
  Å−1 as a function of azimuthal angle ϕ. (f) Unit cell of the observed cortisone crystallites, as determined from the in-plane Bragg peaks.
References
-
- Seydel J. et al. The importance of drug-membrane interaction in drug research and development. Quant. Struct.-Act. Rel. 11, 205–210 (1992).
-
- Overington J. P., Al-Lazikani B. & Hopkins A. L. How many drug targets are there? Nat. Rev. Drug Discov. 5, 993–996 (2006). - PubMed
-
- Rheinstädter M. C., Schmalzl K., Wood K. & Strauch D. Protein-protein interaction in purple membrane. Phys. Rev. Lett. 103, 128104–1 (2009). - PubMed
Publication types
MeSH terms
Substances
LinkOut - more resources
Full Text Sources
Other Literature Sources
