

Co-distribution and co-infection of chikungunya and dengue viruses
- PMID: 26936191
- PMCID: PMC4776349
- DOI: 10.1186/s12879-016-1417-2
Co-distribution and co-infection of chikungunya and dengue viruses
Erratum in
-
Erratum to: Co-distribution and co-infection of chikungunya and dengue viruses.BMC Infect Dis. 2016 Apr 29;16:188. doi: 10.1186/s12879-016-1519-x. BMC Infect Dis. 2016. PMID: 27129475 Free PMC article. No abstract available.
Abstract
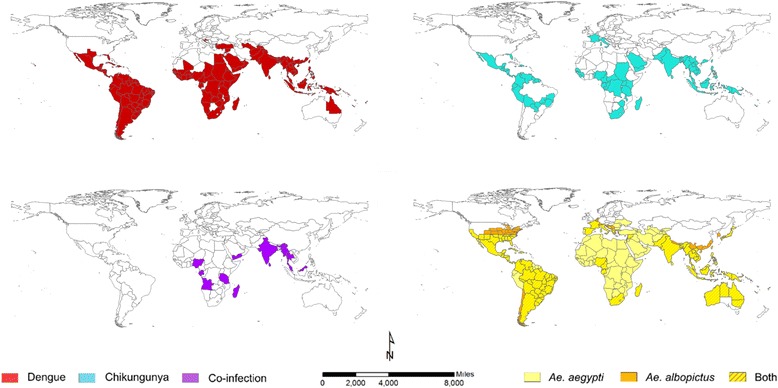
Background: Chikungunya and dengue infections are spatio-temporally related. The current review aims to determine the geographic limits of chikungunya, dengue and the principal mosquito vectors for both viruses and to synthesise current epidemiological understanding of their co-distribution.
Methods: Three biomedical databases (PubMed, Scopus and Web of Science) were searched from their inception until May 2015 for studies that reported concurrent detection of chikungunya and dengue viruses in the same patient. Additionally, data from WHO, CDC and Healthmap alerts were extracted to create up-to-date global distribution maps for both dengue and chikungunya.
Results: Evidence for chikungunya-dengue co-infection has been found in Angola, Gabon, India, Madagascar, Malaysia, Myanmar, Nigeria, Saint Martin, Singapore, Sri Lanka, Tanzania, Thailand and Yemen; these constitute only 13 out of the 98 countries/territories where both chikungunya and dengue epidemic/endemic transmission have been reported.
Conclusions: Understanding the true extent of chikungunya-dengue co-infection is hampered by current diagnosis largely based on their similar symptoms. Heightened awareness of chikungunya among the public and public health practitioners in the advent of the ongoing outbreak in the Americas can be expected to improve diagnostic rigour. Maps generated from the newly compiled lists of the geographic distribution of both pathogens and vectors represent the current geographical limits of chikungunya and dengue, as well as the countries/territories at risk of future incursion by both viruses. These describe regions of co-endemicity in which lab-based diagnosis of suspected cases is of higher priority.
Figures
References
-
- Kroeger A, Nathan M, Hombach J. Disease Watch Focus: Dengue. World Health Organization. 2004. http://www.who.int/tdr/publications/disease_watch/dengue/en/. Accessed Nov 2015
-
- WHO . Global strategy for dengue prevention and control, 2012–2020. Geneva: World Health Organization; 2012.
-
- WHO. Sustaining the drive to overcome the global impact of neglected tropical diseases. Geneva: World Health Organization; 2013. http://www.who.int/neglected_diseases/9789241564540/en/. Accessed Nov 2015.
Publication types
MeSH terms
LinkOut - more resources
Full Text Sources
Other Literature Sources
Medical
Miscellaneous
