. 2016 Mar 16;283(1826):20153030.
doi: 10.1098/rspb.2015.3030.

Myosin filament sliding through the Z-disc relates striated muscle fibre structure to function

Affiliations

Myosin filament sliding through the Z-disc relates striated muscle fibre structure to function

Christian Rode et al. Proc Biol Sci. .

Abstract

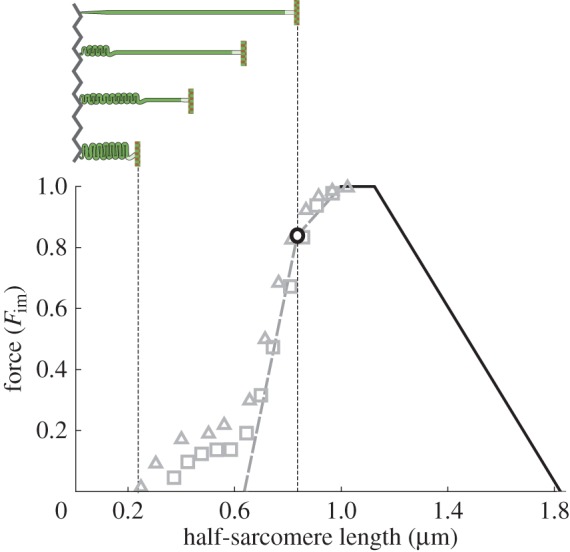
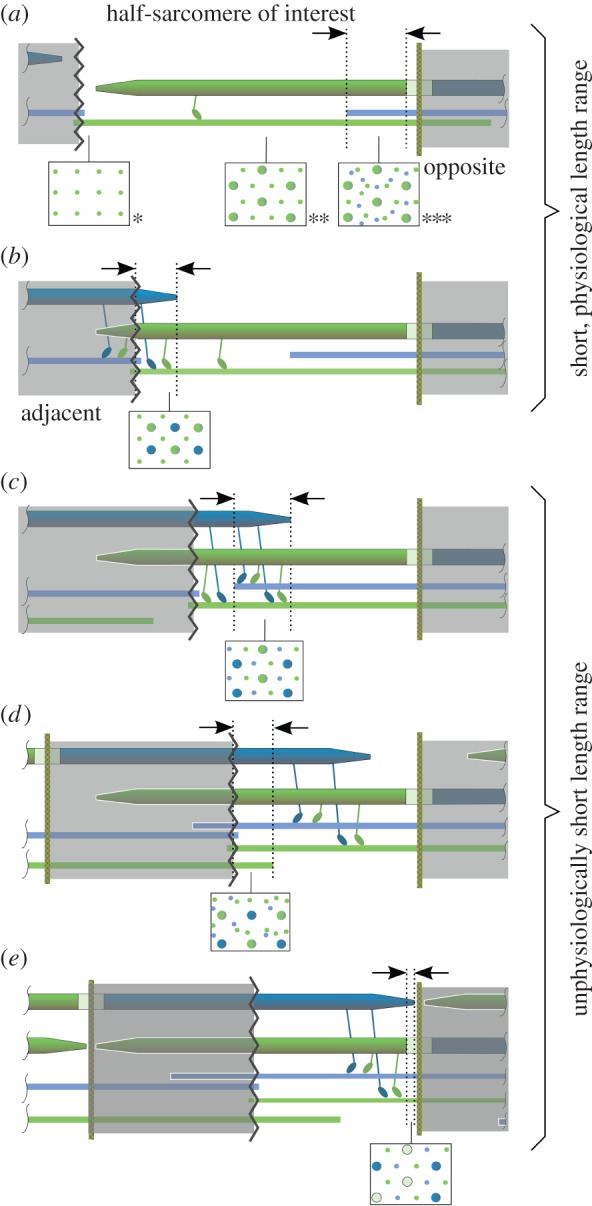
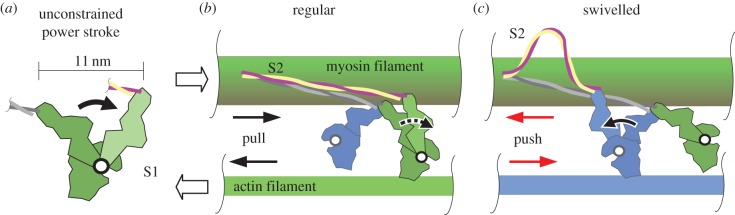
Striated muscle contraction requires intricate interactions of microstructures. The classic textbook assumption that myosin filaments are compressed at the meshed Z-disc during striated muscle fibre contraction conflicts with experimental evidence. For example, myosin filaments are too stiff to be compressed sufficiently by the muscular force, and, unlike compressed springs, the muscle fibres do not restore their resting length after contractions to short lengths. Further, the dependence of a fibre's maximum contraction velocity on sarcomere length is unexplained to date. In this paper, we present a structurally consistent model of sarcomere contraction that reconciles these findings with the well-accepted sliding filament and crossbridge theories. The few required model parameters are taken from the literature or obtained from reasoning based on structural arguments. In our model, the transition from hexagonal to tetragonal actin filament arrangement near the Z-disc together with a thoughtful titin arrangement enables myosin filament sliding through the Z-disc. This sliding leads to swivelled crossbridges in the adjacent half-sarcomere that dampen contraction. With no fitting of parameters required, the model predicts straightforwardly the fibre's entire force-length behaviour and the dependence of the maximum contraction velocity on sarcomere length. Our model enables a structurally and functionally consistent view of the contractile machinery of the striated fibre with possible implications for muscle diseases and evolution.

Keywords: Z-disc; model; myofilaments; sliding filament theory; striated muscle fibre.


Figures

Figure 1.
Figure 1.
Isometric force over half-sarcomere length. Force is given as a fraction of maximum isometric force Fim (data by Gordon et al. [2] approximated as straight lines; data by Ramsey & Street [3] shown for two specimen as squares and triangles, respectively). The descending limb and the plateau (black lines) of this curve are directly predicted by the sliding filament [4,5] and crossbridge theories [6]. The slope change on the ascending limb (black circle) is related to the fibre length where myosin filaments reach the Z-disc. Explanation of the grey data is subject to scientific discussion (see text). The schematic half-sarcomere (top)—bounded by Z-disc (zigzag line) and M-line (vertical line)—illustrates required myosin filament (horizontal bar) compression or folding following the typical assumption that myosin filaments cannot penetrate the Z-disc. (Online version in colour).
Figure 2.
Figure 2.
Myofilament arrangement after myosin filament sliding through the Z-disc. α-actinin molecules (black and grey) cross-link the tetragonal actin filament (helices) grids of opposite half-sarcomeres (green and blue, respectively) to form the Z-disc structure. Actin grids of opposite polarity are assumed to align as a consequence of myosin filament (thick rods) sliding through the Z-disc. Myosin filaments fill the previously empty spots within the chequered actin filament grid of the adjacent half-sarcomere. For further details on the sliding process, the Z-disc structure and the alignment of the actin grids, see text (see also figure 3; electronic supplementary material, figure S1 and text S1).
Figure 3.
Figure 3.
Schematic of proposed myosin (thick) and actin (thin) filament sliding. (a) Known [9,22,23] (cross sections *, **, ***) and (b–e) hypothesized filament arrangements and cross sections evolving during half-sarcomere shortening. (a) Starting from the plateau of the FLR, actin filaments from the opposite half-sarcomere passing the M-line enter the regular actin–myosin overlap, leading to actin–actin–myosin overlap. (b) Then myosin filaments from the adjacent half-sarcomere slide through the Z-disc, and a myosin–myosin–actin overlap zone evolves. (c) At even shorter length, the myosin–myosin–actin overlap zone meets the forthcoming actin–actin–myosin overlap zone, leading to actin–actin–myosin–myosin overlap. (d) Subsequently, actin filaments from the adjacent sarcomere enter the half-sarcomere of interest, leading to actin–actin–actin–myosin–myosin overlap. (e) Finally, the tips of myosin filaments from the adjacent half-sarcomere enter the myosin bare zone of the sarcomere of interest and eventually meet the M-line, where contraction is assumed to stop. Myosin heads projecting from the myosin filaments adjust to the polarity of the actin filament [19,20]. Same-colour myosin and actin filament represent relative filament orientation in regular overlap. During a shortening contraction, myosin heads interacting with actin of the same colour act concentrically, while myosin heads interacting with actin of a different colour act eccentrically.
Figure 4.
Figure 4.
Illustration of proposed crossbridge action. (a) The full, unconstrained power stroke of the myosin S1 region covers 11 nm [28]. (b) The two myosin heads of one myosin molecule are shown in green and blue, respectively. Stiff myofilaments (actin and myosin) and no relative myofilament movement are assumed in an isometric (constant length) contraction. During the regular crossbridge power stroke of the green myosin head, its S1 region performs a sub-step of the unconstrained power stroke and deforms itself because the S2 region is stiff when pulled [29,30]. The crossbridge force tends to shorten the sarcomere (relative filament movement for fibre shortening indicated by unfilled arrows). (c) The swivelled crossbridge (blue) is formed because of flipped polarity of actin filaments (blue) compared with that in regular overlap. In contrast with the regular crossbridge, the swivelled crossbridge pushes the myofilaments, tending to elongate the sarcomere (red arrows). This leads to compression and buckling of the S2 region as a consequence of the power stroke because of low S2 compressive strength [29].
Figure 5.
Figure 5.
Comparison of model-predicted force–length relationship (black lines) and data (grey). Prediction I assumes that regular and swivelled crossbridges produce equal forces. Prediction II assumes that swivelled crossbridges produce half the force of regular crossbridges (see figure 4; electronic supplementary material, text S3). Overlap regions with abundant actin are assumed to produce no force [13]. Parameters used for the geometric model are myosin filament length 1.6 µm [31], bare region length of the myosin filaments 0.125 µm (lower range of reported values) [32], Z-disc width 0 µm, and actin filament length 1.025 µm (calculated from fully extended sarcomere length l1 = 3.65 µm, [2]). Ranges A–E correspond to figure 3ae, half-sarcomere lengths l1l8 correspond to equation (A 2).
Figure 6.
Figure 6.
Comparison of model-predicted maximum half-sarcomere contraction velocity (black line) and data (symbols [38]). The model and the data show a similar decrease of maximum contraction velocity for half-sarcomere lengths smaller than l4. For orientation, the force–length relationship is depicted below. The maximum half-sarcomere contraction velocity is normalized to vmax, its value in the plateau range of the force–length relationship. The increase in maximum contraction velocity in the grey shaded area stems from passive forces [38] not considered in our model.
Figure 7.
Figure 7.
Isometric measurements with a segment of a single muscle fibre of rat M. extensor digitorum longus show considerable force at lengths below classic zero force for extended activation. Force–time traces generated by the muscle fibre at optimum (1.25 µm, black line) and short (0.53 µm, grey line) half-sarcomere lengths. Preparation and fixation of fibres followed the protocol of Goldman & Simmons [41]. The permeabilized fibre was maximally (pCa 4.5) activated for 10 s and 25 s at 1.25 µm and 0.53 µm, respectively, at 12°C. Force was measured using a fibre test apparatus (Aurora Scientific, 1400A). Mean sarcomere length was measured microscopically (Nikon Ti-S, 500×) within the white boxed part of the fibre (top graphs) with a high-speed video system for sarcomere length measurement (Aurora Scientific, 901B). Calcium activation started at time t = 0. At very short, unphysiological half-sarcomere length (0.53 µm), the muscle fibre segment is initially slack (it sags). After pulling in the slack, the fibre segment becomes taut and force develops slowly. Force reached about 30% of maximum isometric force (Fim) at the end of activation. In the inset, the measured steady-state lengths and forces can be compared with the rat's theoretical force–length relationship (obtained with the same parameters as in figure 6 but with longer rat actin length of 1.13 µm [32]).

References

    1. Blix M. 1891. Die Länge und die Spannung des Muskels. Skand. Arch. Physiol. 3, 295–118. ( 10.1111/j.1748-1716.1892.tb00660.x) - DOI
    1. Gordon AM, Huxley AF, Julian FJ. 1966. The variation in isometric tension with sarcomere length in vertebrate muscle fibres. J. Physiol. 184, 170–192. ( 10.1113/jphysiol.1966.sp007909) - DOI - PMC - PubMed
    1. Ramsey RW, Street SF. 1940. The isometric length-tension diagram of isolated skeletal muscle fibers of the frog. J. Cell. Compar. Physiol. 15, 11–34. ( 10.1002/jcp.1030150103) - DOI
    1. Huxley H, Hanson J. 1954. Changes in the cross-striations of muscle during contraction and stretch and their structural interpretation. Nature 173, 973–976. ( 10.1038/173973a0) - DOI - PubMed
    1. Huxley AF, Niedergerke R. 1954. Structural changes in muscle during contraction: interference microscopy of living muscle fibres. Nature 173, 971–973. ( 10.1038/173971a0) - DOI - PubMed

LinkOut - more resources