Controlled Clinical Trial
. 2016 Jun;30(6):2266-81.
doi: 10.1096/fj.201500198R. Epub 2016 Mar 2.

Activation of satellite cells and the regeneration of human skeletal muscle are expedited by ingestion of nonsteroidal anti-inflammatory medication

Affiliations
Controlled Clinical Trial

Activation of satellite cells and the regeneration of human skeletal muscle are expedited by ingestion of nonsteroidal anti-inflammatory medication

Abigail L Mackey et al. FASEB J. 2016 Jun.

Abstract

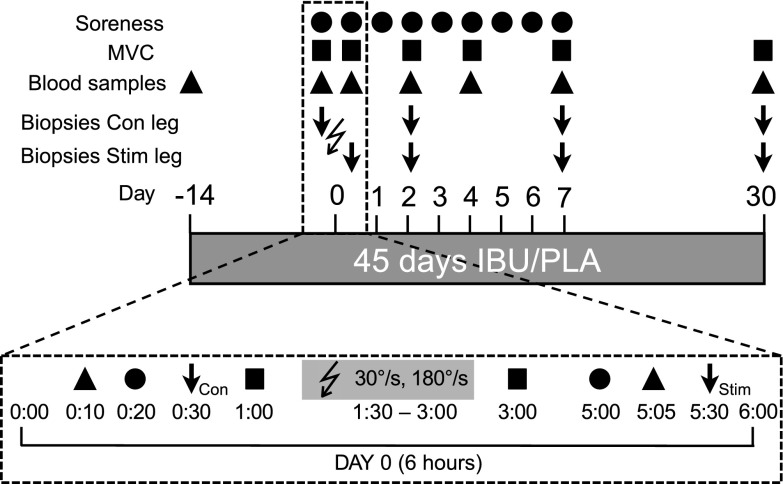
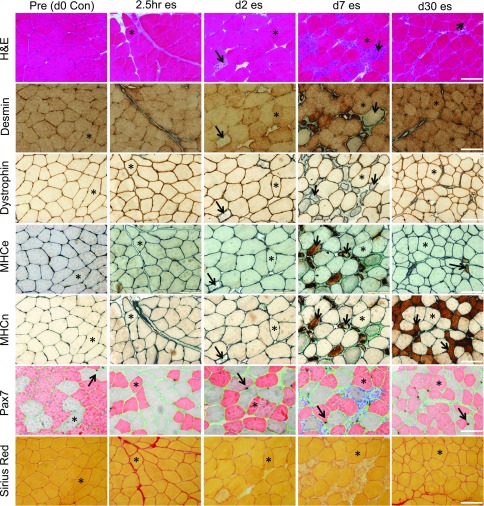
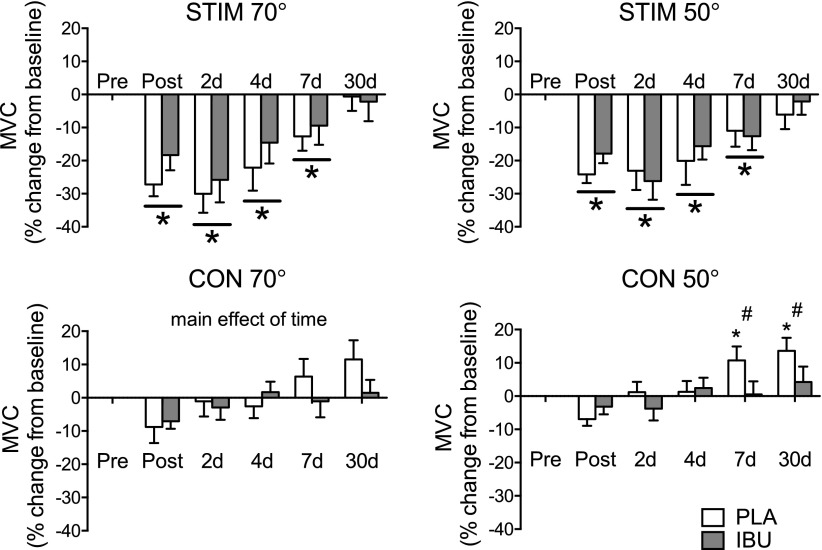
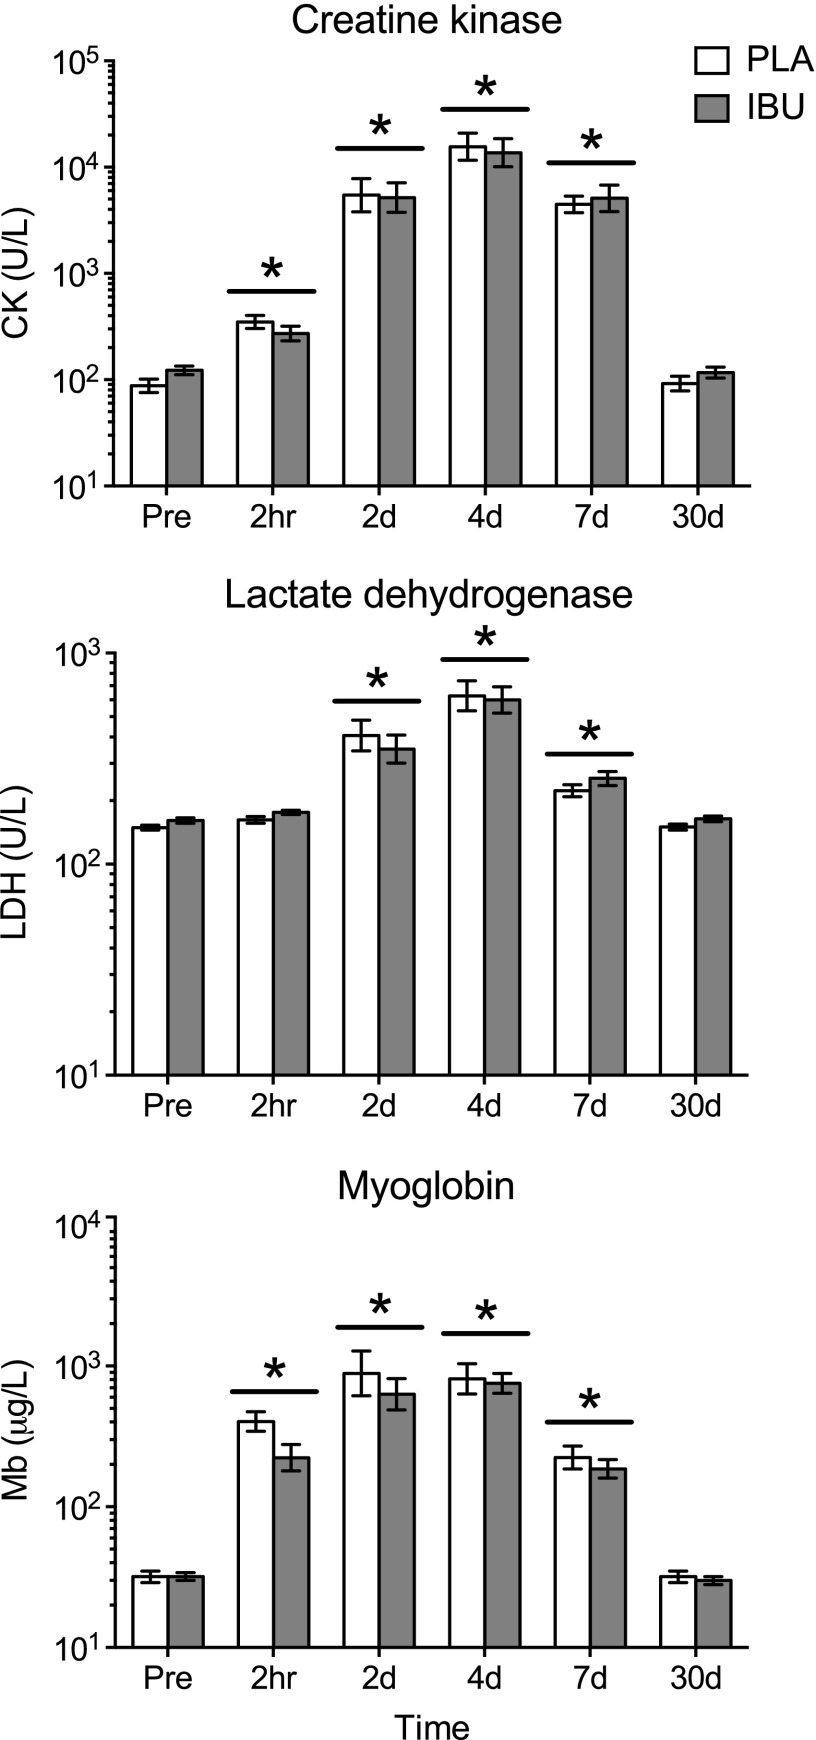
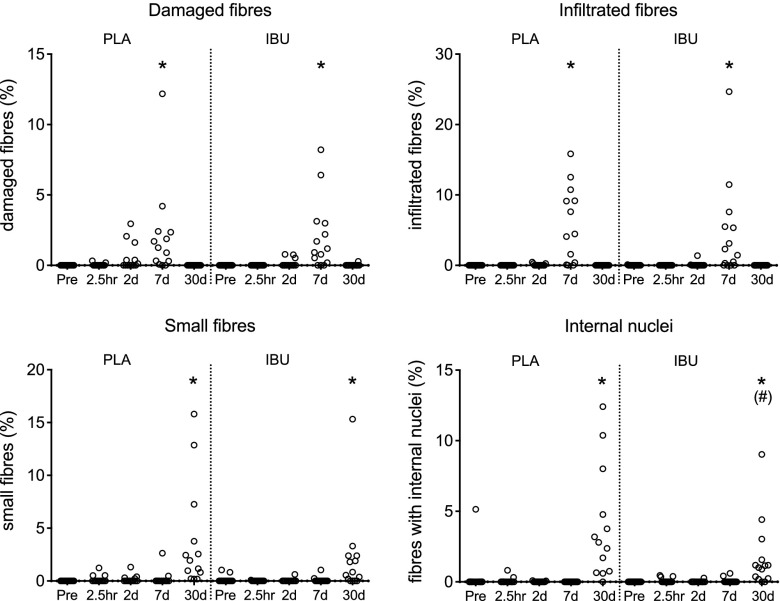
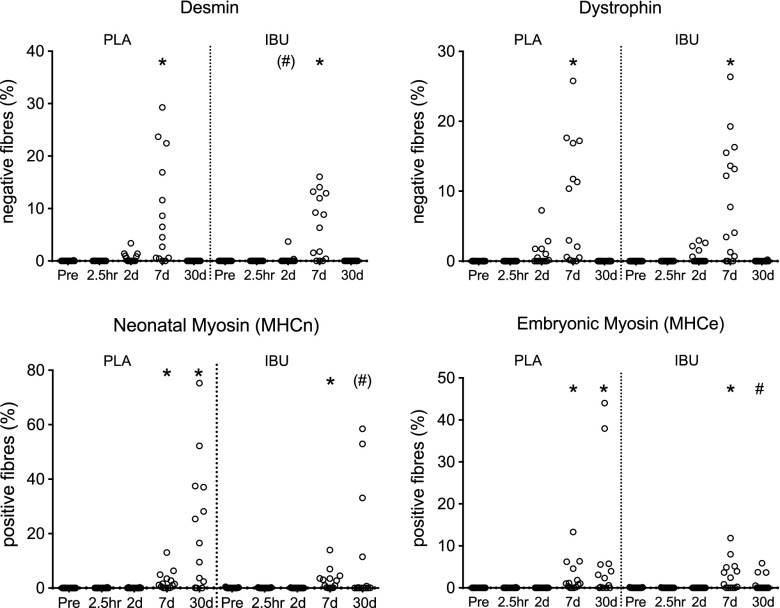
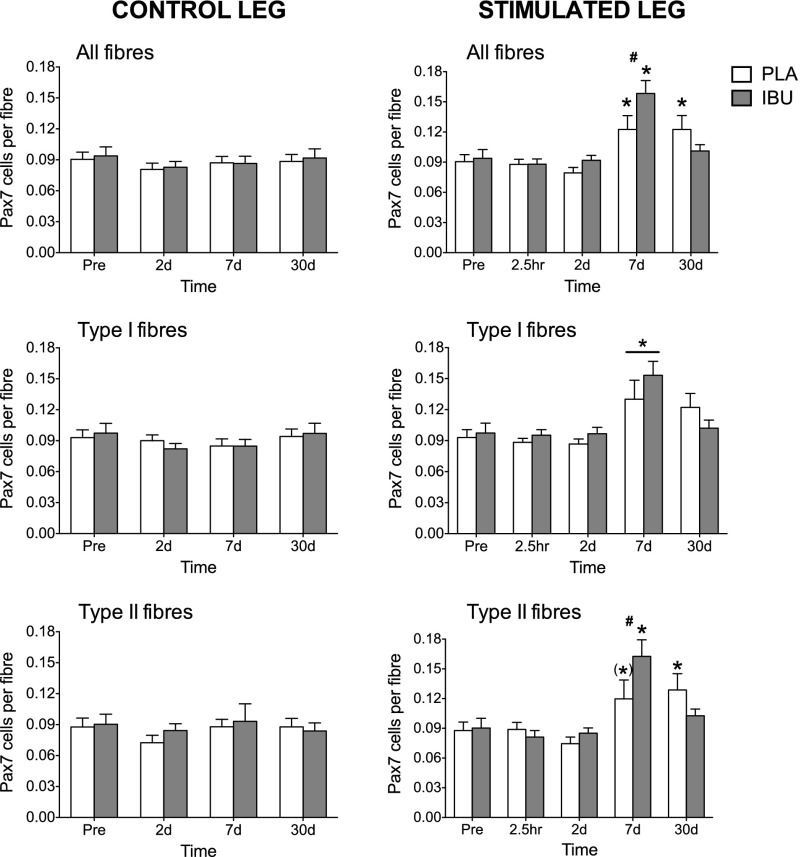
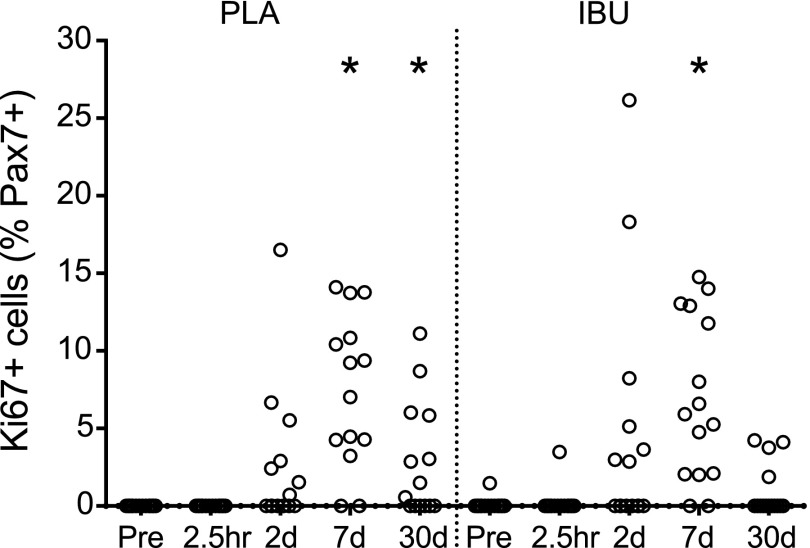
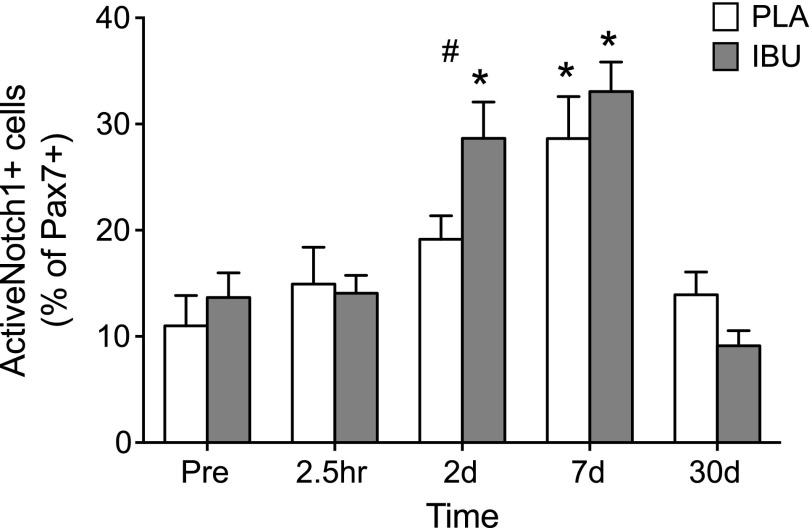
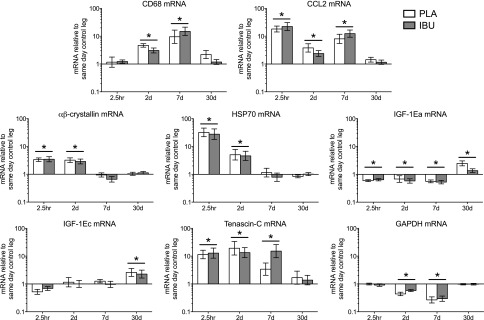
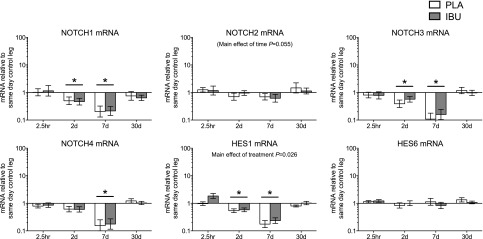
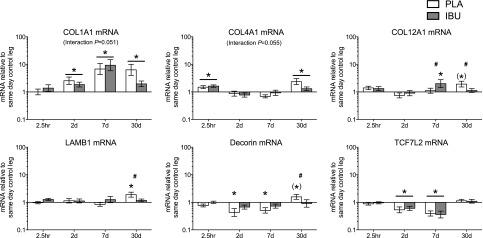
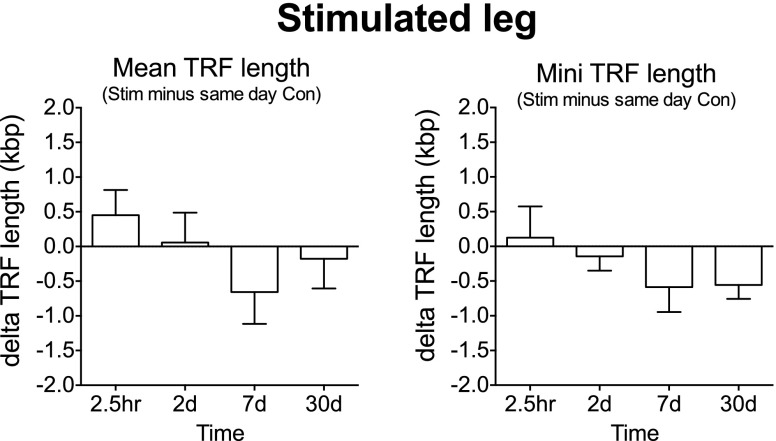
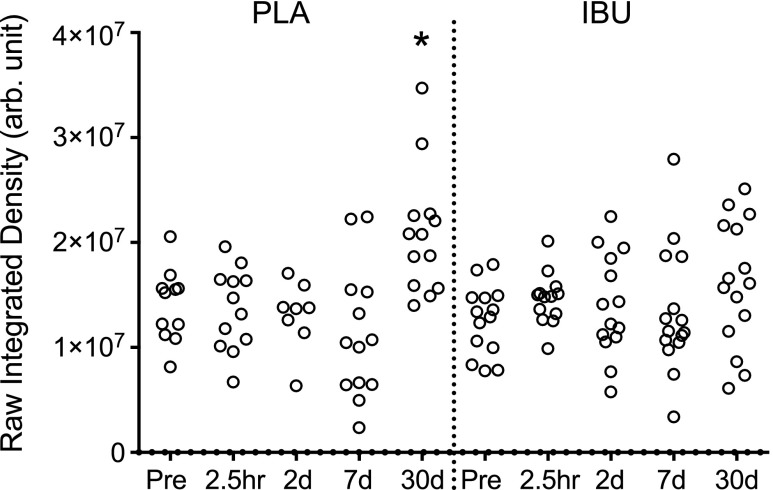
With this study we investigated the role of nonsteroidal anti-inflammatory drugs (NSAIDs) in human skeletal muscle regeneration. Young men ingested NSAID [1200 mg/d ibuprofen (IBU)] or placebo (PLA) daily for 2 wk before and 4 wk after an electrical stimulation-induced injury to the leg extensor muscles of one leg. Muscle biopsies were collected from the vastus lateralis muscles before and after stimulation (2.5 h and 2, 7, and 30 d) and were assessed for satellite cells and regeneration by immunohistochemistry and real-time RT-PCR, and we also measured telomere length. After injury, and compared with PLA, IBU was found to augment the proportion of ActiveNotch1(+) satellite cells at 2 d [IBU, 29 ± 3% vs. PLA, 19 ± 2% (means ± sem)], satellite cell content at 7 d [IBU, 0.16 ± 0.01 vs. PLA, 0.12 ± 0.01 (Pax7(+) cells/fiber)], and to expedite muscle repair at 30 d. The PLA group displayed a greater proportion of embryonic myosin(+) fibers and a residual ∼2-fold increase in mRNA levels of matrix proteins (all P < 0.05). Endomysial collagen was also elevated with PLA at 30 d. Minimum telomere length shortening was not observed. In conclusion, ingestion of NSAID has a potentiating effect on Notch activation of satellite cells and muscle remodeling during large-scale regeneration of injured human skeletal muscle.-Mackey, A. L., Rasmussen, L. K., Kadi, F., Schjerling, P., Helmark, I. C., Ponsot, E., Aagaard, P., Durigan, J. L. Q., Kjaer, M. Activation of satellite cells and the regeneration of human skeletal muscle are expedited by ingestion of nonsteroidal anti-inflammatory medication.

Keywords: Notch signaling pathway; Pax7; electrical stimulation; extracellular matrix; telomere length.


Figures

Figure 1.
Figure 1.
Study design. Overview of the study design indicating the timing of blood sampling, muscle biopsies, and measurements of muscle soreness and MVC during the 45-d period of IBU or PLA ingestion in young healthy male volunteers. The bottom timeline displays in more detail the timing and order of events during the 6-h protocol for d 0 when ES was performed. On this day, 100 slow (30°/s) and 100 fast (180°/s) lengthening contractions were induced by ES to the vastus lateralis muscle of one leg. Four biopsies were collected from the stimulated (stim) leg and 4 from the unstimulated leg as a control (con). The order of events on the postinjury d was as follows: blood sampling, biopsies, and MVC. The lightning bolt symbol indicates ES.
Figure 2.
Figure 2.
Microscope images of histologic analyses. To provide insight into the extent of myofiber damage, these images depict sections cut from Pre biopsies before a single bout of es and from postinjury at 2.5 h, and on d 2, 7, and 30. All sections are from the same participant and, in most cases, for each time point, the same fibers (indicated with asterisks) can be identified in the 7 different stains used to evaluate damage (H&E and desmin-negative or dystrophin-negative fibers) and regeneration [embryonic (MHCe) or neonatal (MHCn) myosin-positive fibers] as well as the muscle content of satellite cells (Pax7) and collagen (Sirius Red). Examples of affected fibers, as described in Materials and Methods, are indicated with arrows. Pax7 cells are visible as black cells (arrows), associated with type I (red) or type II (gray) fibers. Laminin (green) was used to indicate the fiber borders. Scale bars, 100 μm.
Figure 3.
Figure 3.
Muscle strength. Changes in MVC measured immediately after and in the days following a single bout of ES of the thigh muscles of one leg in young healthy men receiving either PLA or IBU. Values are percent change from baseline and are presented separately for the stimulated (stim) and control (con) legs at 70 or 50° of knee flexion (means ± sem). IBU, n = 15; PLA, n = 14. *P < 0.05 vs. Pre (main effect of time underlined); #P < 0.05 between groups.
Figure 4.
Figure 4.
Circulating markers of muscle damage. Circulating levels of CK, LDH, and Mb were measured as indirect markers of skeletal muscle damage before (Pre) and at 2 h and on d 2, 4, 7, and 30 after a single bout of ES of the thigh muscles of one leg in young healthy men receiving either PLA or IBU. Data are geometric means ± back-transformed sem, displayed on a logarithmic scale y axis. IBU, n = 15; PLA, n = 14. *P < 0.05 vs. (main effect of time underlined).
Figure 5.
Figure 5.
Damage and regeneration (H&E). An assessment of H&E-stained cross sections of muscle biopsies collected before (Pre) a single bout of ES and postinjury at 2.5 h and on d 2, 7, and 30 in young men receiving either PLA or IBU. The proportion of damaged fibers and infiltrated fibers were used to assess fiber injury, whereas the proportion of small fibers and fibers with internal nuclei were used as an indication of muscle regeneration. Note that the y axis scale is not the same on all graphs. IBU, n = 15; PLA, n = 13. #P < 0.05 between groups; *P < 0.05 vs. Pre.
Figure 6.
Figure 6.
Damage and regeneration (IHC). An assessment of IHC-stained cross sections of muscle biopsies collected before (Pre) a single bout of ES and postinjury at 2.5 h and on d 2, 7, and 30 in young men receiving either PLA or IBU. Desmin-negative and dystrophin-negative fibers are indicative of muscle damage, whereas the presence of MHCn-positive and MHCe-positive fibers is evidence of muscle regeneration. Note that the y axis scale is not the same on all graphs. IBU, n = 15; PLA, n = 14. #P < 0.05 between groups; *P < 0.05 vs. Pre.
Figure 7.
Figure 7.
Satellite cell content. Satellite cell (Pax7+) content as assessed on cross sections of muscle biopsies collected before (Pre) and after (2.5 h and on d 2, 7, and 30) a bout of ES of the thigh muscles of one leg (stimulated leg) from young healthy men receiving either PLA or IBU. Data for the control leg are also shown. Data are expressed relative to the total number of all fibers or separately for the number of type I or type II fibers. IBU, n = 15; PLA, n = 14. #P < 0.05 between groups; *P < 0.05 vs. Pre (main effect of time underlined); (*)P = 0.051 vs. Pre.
Figure 8.
Figure 8.
Proliferating satellite cells. The percentage of proliferating (Ki-67+) satellite cells (Pax7+) assessed on cross sections of muscle biopsies collected before (Pre) and after (2.5 h and on d 2, 7, and 30) a bout of ES in young men receiving either PLA or IBU. IBU, n = 15; PLA, n = 14. *P < 0.05 vs. Pre.
Figure 9.
Figure 9.
ActiveNotch1+ satellite cells. The percentage of ActiveNotch1+ satellite cells (Pax7+) assessed on cross sections of muscle biopsies collected before (Pre) and after (2.5 h and on d 2, 7, and 30) a bout of ES in young men receiving either PLA or IBU. IBU, n = 15; PLA, n = 14. #P < 0.05 between groups; *P < 0.05 vs. Pre.
Figure 10.
Figure 10.
Stimulated leg: damage markers. Gene expression levels of markers sensitive to damage in muscle subjected to a bout of ES. Muscle biopsies were collected before and at 2.5 h and on d 2, 7, and 30 poststimulation, and participants received either PLA or IBU for the duration of the study. mRNA levels of CD68, CCL2, αβ-crystallin, HSP70, IGF-1Ea, IGF-1Ec, tenascin-C, and GAPDH are displayed, expressed relative to values for the same-day control leg. Data are geometric means ± back-transformed sem, displayed on a logarithmic scaled y axis. IBU, n = 15; PLA, n = 14. *P < 0.05 vs. Pre (main effect of time underlined).
Figure 11.
Figure 11.
Stimulated leg: notch. Gene expression levels of Notch signaling in muscle subjected to a bout of ES. Muscle biopsies were collected before and at 2.5 h and on d 2, 7, and 30 poststimulation, and participants received either PLA or IBU for the duration of the study. mRNA levels of NOTCH1, NOTCH2, NOTCH3, NOTCH4, HES1, and HES6 are displayed, expressed relative to values for the same-day control leg. Data are geometric means ± back-transformed sem, displayed on a logarithmic scaled y axis. IBU, n = 15; PLA, n = 14. *P < 0.05 vs. Pre (main effect of time underlined).
Figure 12.
Figure 12.
Stimulated leg: ECM. Gene expression levels of ECM components in muscle subjected to a bout of ES. Muscle biopsies were collected before and at 2.5 h and on d 2, 7, and 30 poststimulation, and participants received either PLA or IBU for the duration of the study. mRNA levels of collagen types I (COL1A1), IV (COL4A1), XII (COL12A1), and laminin-β1 (LAMB1), decorin, and TCF7L2 are displayed, expressed relative to values for the same-day control leg. Data are geometric means ± back-transformed sem, displayed on a logarithmic scaled y axis. IBU, n = 15; PLA, n = 14. #P < 0.05 between groups; *P < 0.05 vs. Pre (main effect of time underlined); (*)P < 0.06 vs. Pre.
Figure 13.
Figure 13.
Mean and minimum muscle telomere length. Muscle biopsies were collected before and after (2.5 h and on d 2, 7, and 30) a bout of ES to the thigh muscles of one leg in young men receiving either PLA or IBU. Data are pooled PLA (n = 5) and IBU (n = 4), expressed as δ values for the stimulated (stim) leg vs. same-day biopsy from control (con) leg. TRF, terminal restriction fragment.
Figure 14.
Figure 14.
Muscle collagen content. A histologic assessment of Sirius Red–stained cross sections of muscle biopsies collected before (Pre) a single bout of ES and postinjury at 2.5 h and on d 2, 7, and 30 in young men receiving either PLA or IBU. Data reflect endomysial collagen only, as areas that contained perimysium were excluded, and are presented as arbitrary units (arb. unit). IBU, n = 15; PLA, n = 13. *P < 0.05 vs. Pre.

References

    1. Relaix F., Zammit P. S. (2012) Satellite cells are essential for skeletal muscle regeneration: the cell on the edge returns centre stage. Development 139, 2845–2856 - PubMed
    1. McCarthy J. J., Mula J., Miyazaki M., Erfani R., Garrison K., Farooqui A. B., Srikuea R., Lawson B. A., Grimes B., Keller C., Van Zant G., Campbell K. S., Esser K. A., Dupont-Versteegden E. E., Peterson C. A. (2011) Effective fiber hypertrophy in satellite cell-depleted skeletal muscle. Development 138, 3657–3666 - PMC - PubMed
    1. Fry C. S., Lee J. D., Jackson J. R., Kirby T. J., Stasko S. A., Liu H., Dupont-Versteegden E. E., McCarthy J. J., Peterson C. A. (2014) Regulation of the muscle fiber microenvironment by activated satellite cells during hypertrophy. FASEB J. 28, 1654–1665 - PMC - PubMed
    1. Urso M. L. (2013) Anti-inflammatory interventions and skeletal muscle injury: benefit or detriment? J. Appl. Physiol. (1985) 115, 920–928 - PubMed
    1. Trappe T. A., Liu S. Z. (2013) Effects of prostaglandins and COX-inhibiting drugs on skeletal muscle adaptations to exercise. J. Appl. Physiol. (1985) 115, 909–919 - PMC - PubMed

Publication types

MeSH terms