Express photolithographic DNA microarray synthesis with optimized chemistry and high-efficiency photolabile groups
- PMID: 26936369
- PMCID: PMC4776362
- DOI: 10.1186/s12951-016-0166-0
Express photolithographic DNA microarray synthesis with optimized chemistry and high-efficiency photolabile groups
Abstract
Background: DNA microarrays are a core element of modern genomics research and medical diagnostics, allowing the simple and simultaneous determination of the relative abundances of hundreds of thousands to millions of genomic DNA or RNA sequences in a sample. Photolithographic in situ synthesis, using light projection from a digitally-controlled array of micromirrors, has been successful at both commercial and laboratory scales. The advantages of this synthesis method are its ability to reliably produce high-quality custom microarrays with a very high spatial density of DNA features using a compact device with few moving parts. The phosphoramidite chemistry used in photolithographic synthesis is similar to that used in conventional solid-phase synthesis of oligonucleotides, but some unique differences require an independent optimization of the synthesis chemistry to achieve fast and low-cost synthesis without compromising microarray quality.
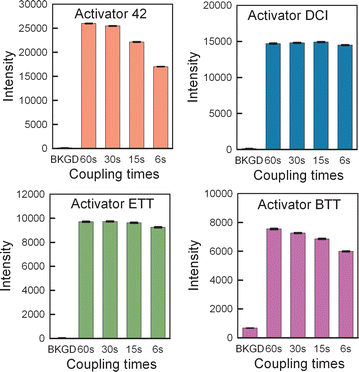
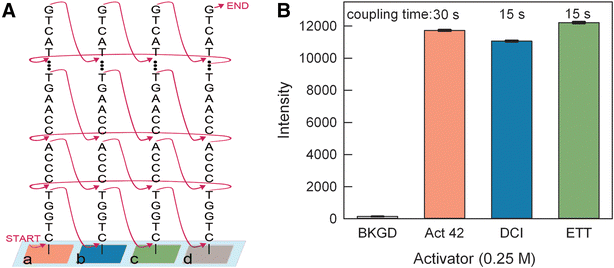
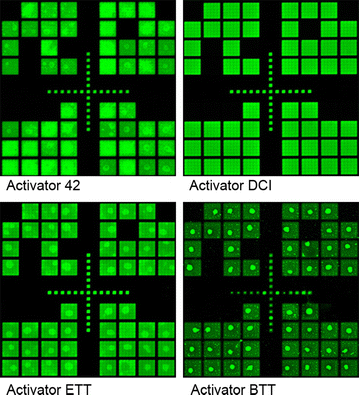
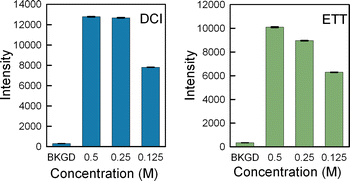
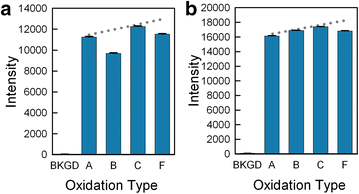
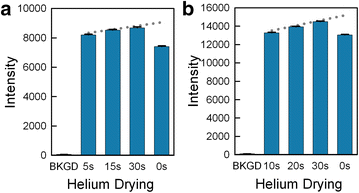
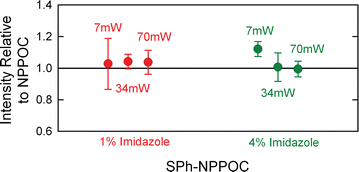
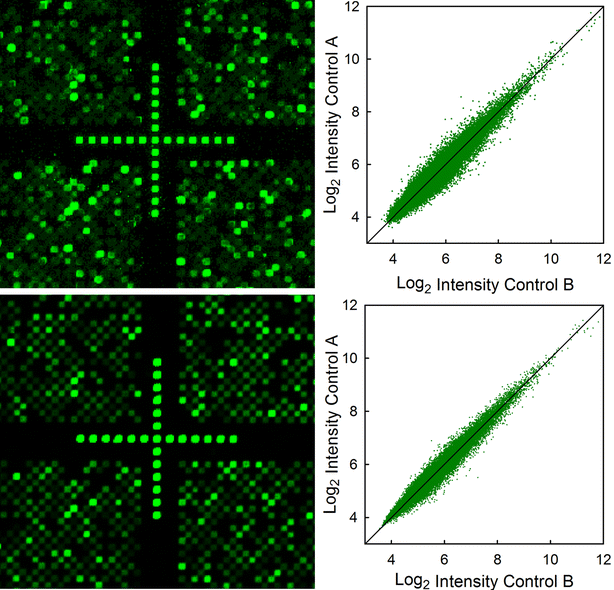
Results: High microarray quality could be maintained while reducing coupling time to a few seconds using DCI activator. Five coupling activators were compared, which resulted in microarray hybridization signals following the order ETT > Activator 42 > DCI ≫ BTT ≫ pyridinium chloride, but only the use of DCI led to both high signal and highly uniform feature intensities. The photodeprotection time was also reduced to a few seconds by replacing the NPPOC photolabile group with the new thiophenyl-NPPOC group. Other chemical parameters, such as oxidation and washing steps were also optimized.
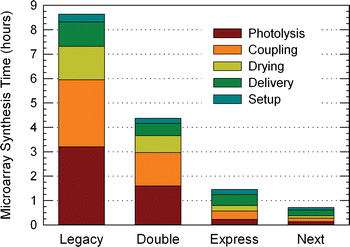
Conclusions: Highly optimized and microarray-specific phosphoramidite chemistry, along with the use of the very photosensitive thiophenyl-NPPOC protecting group allow for the synthesis of high-complexity DNA arrays using coupling times of 15 s and deprotection times of 9 s. The resulting overall cycle time (coupling to coupling) of about 50 s, results in a three-fold reduction in synthesis time.
Figures
Similar articles
-
Efficiency, error and yield in light-directed maskless synthesis of DNA microarrays.J Nanobiotechnology. 2011 Dec 8;9:57. doi: 10.1186/1477-3155-9-57. J Nanobiotechnology. 2011. PMID: 22152062 Free PMC article.
-
High-Efficiency Reverse (5'→3') Synthesis of Complex DNA Microarrays.Sci Rep. 2018 Oct 10;8(1):15099. doi: 10.1038/s41598-018-33311-3. Sci Rep. 2018. PMID: 30305718 Free PMC article.
-
High-Density DNA and RNA microarrays - Photolithographic Synthesis, Hybridization and Preparation of Large Nucleic Acid Libraries.J Vis Exp. 2019 Aug 12;(150). doi: 10.3791/59936. J Vis Exp. 2019. PMID: 31449249
-
Synthesis of 5'-O-phosphoramidites with a photolabile 3'-O-protecting group.Curr Protoc Nucleic Acid Chem. 2004 Sep;Chapter 12:Unit 12.3. doi: 10.1002/0471142700.nc1203s17. Curr Protoc Nucleic Acid Chem. 2004. PMID: 18428919 Review.
-
Arrays of immobilized oligonucleotides--contributions to nucleic acids technology.Curr Pharm Biotechnol. 2003 Dec;4(6):379-95. doi: 10.2174/1389201033377454. Curr Pharm Biotechnol. 2003. PMID: 14683432 Review.
Cited by
-
Dipodal Silanes Greatly Stabilize Glass Surface Functionalization for DNA Microarray Synthesis and High-Throughput Biological Assays.Anal Chem. 2023 Oct 17;95(41):15384-15393. doi: 10.1021/acs.analchem.3c03399. Epub 2023 Oct 6. Anal Chem. 2023. PMID: 37801728 Free PMC article.
-
Encrypted Oligonucleotide Arrays for Molecular Authentication.ACS Comb Sci. 2019 Aug 12;21(8):562-567. doi: 10.1021/acscombsci.9b00088. Epub 2019 Jul 15. ACS Comb Sci. 2019. PMID: 31276622 Free PMC article.
-
l-DNA Duplex Formation as a Bioorthogonal Information Channel in Nucleic Acid-Based Surface Patterning.Chemistry. 2020 Nov 11;26(63):14310-14314. doi: 10.1002/chem.202001871. Epub 2020 Oct 14. Chemistry. 2020. PMID: 32515523 Free PMC article.
-
Accelerated, high-quality photolithographic synthesis of RNA microarrays in situ.Sci Adv. 2024 Aug 2;10(31):eado6762. doi: 10.1126/sciadv.ado6762. Epub 2024 Jul 31. Sci Adv. 2024. PMID: 39083603 Free PMC article.
-
Exposure of Human Gastric Cells to Oxidized Lipids Stimulates Pathways of Amino Acid Biosynthesis on a Genomic and Metabolomic Level.Molecules. 2019 Nov 14;24(22):4111. doi: 10.3390/molecules24224111. Molecules. 2019. PMID: 31739445 Free PMC article.
References
Publication types
MeSH terms
Substances
Grants and funding
LinkOut - more resources
Full Text Sources
Other Literature Sources

