. 2016 Feb;139(2):938-57.
doi: 10.1121/1.4941916.

Nonlinear frequency compression: Influence of start frequency and input bandwidth on consonant and vowel recognition

Affiliations

Nonlinear frequency compression: Influence of start frequency and input bandwidth on consonant and vowel recognition

Joshua M Alexander. J Acoust Soc Am. 2016 Feb.

Abstract

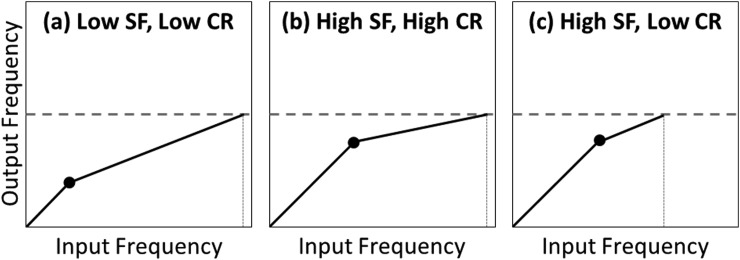
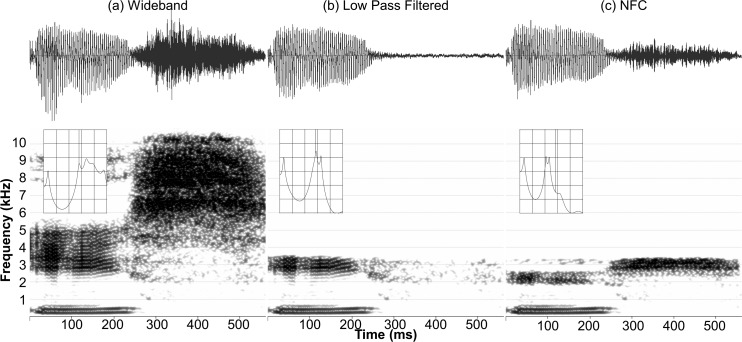
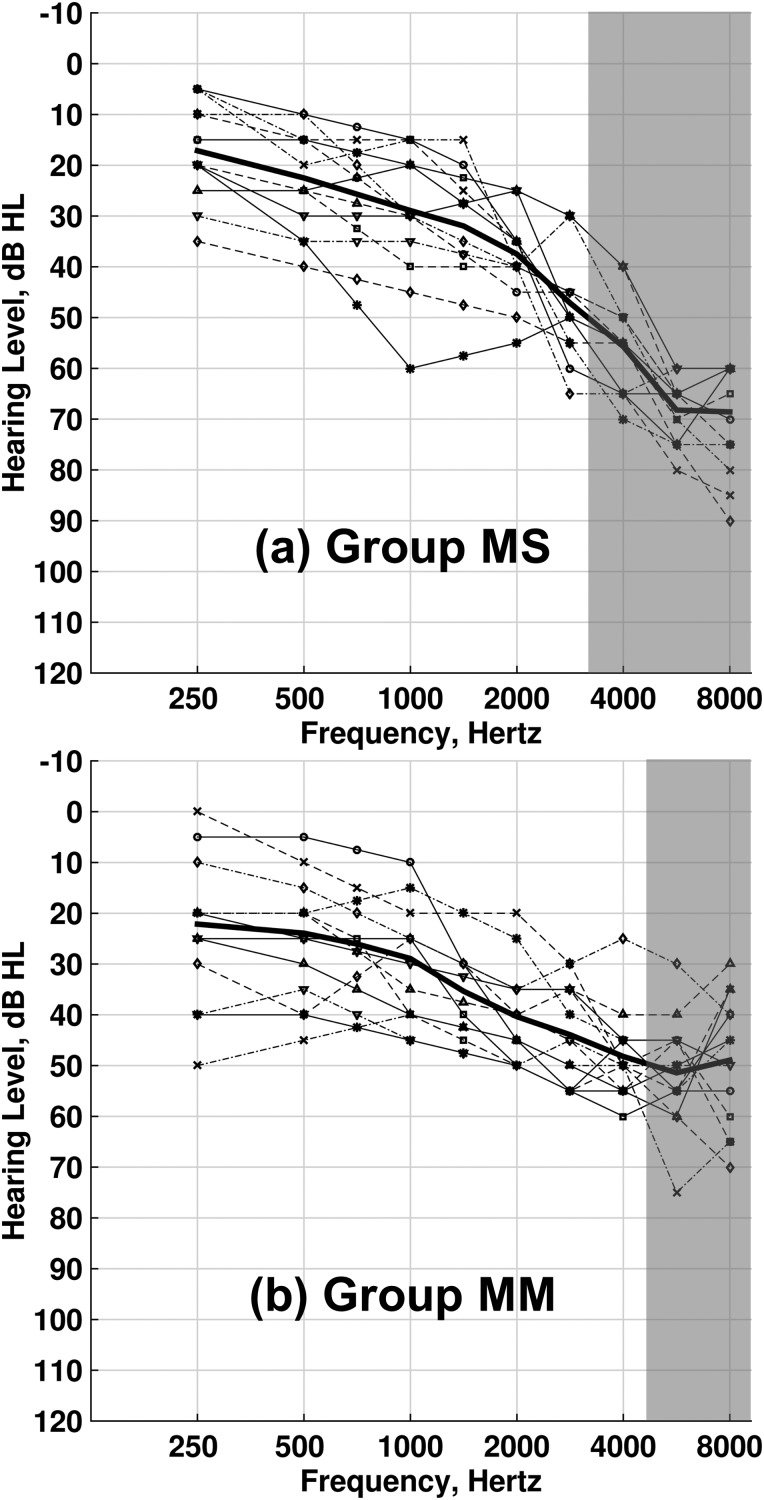
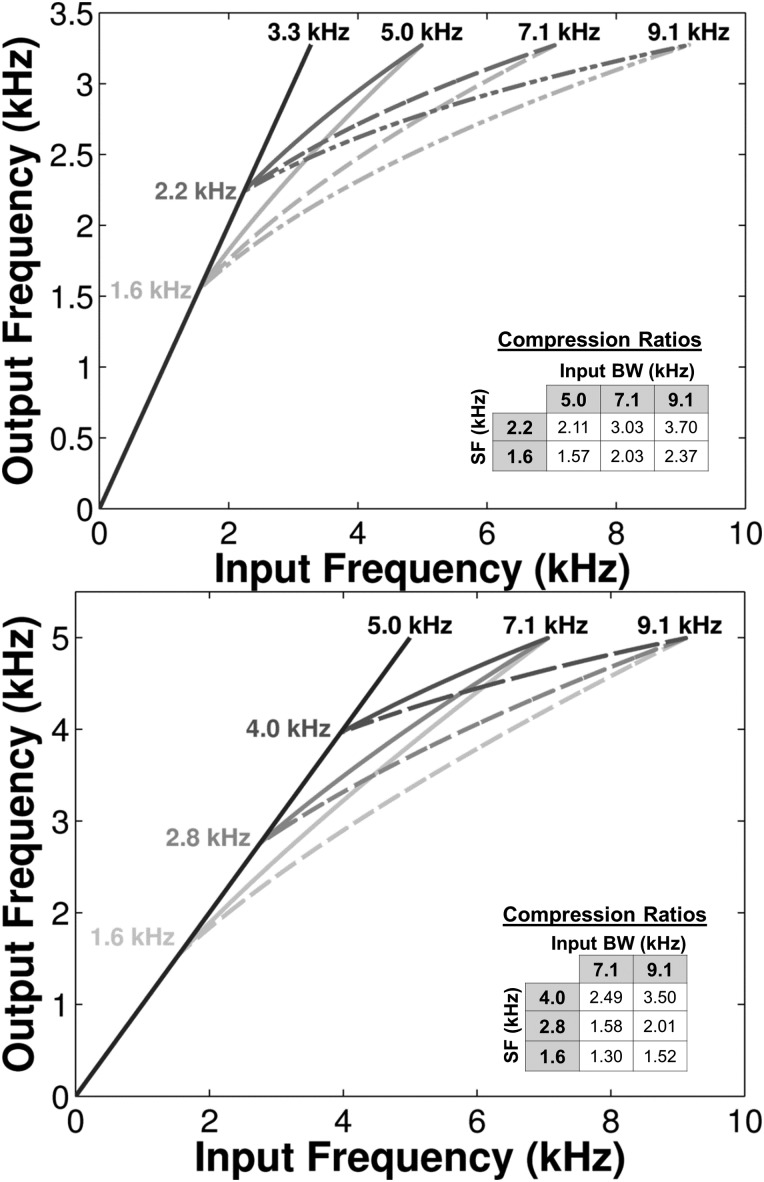
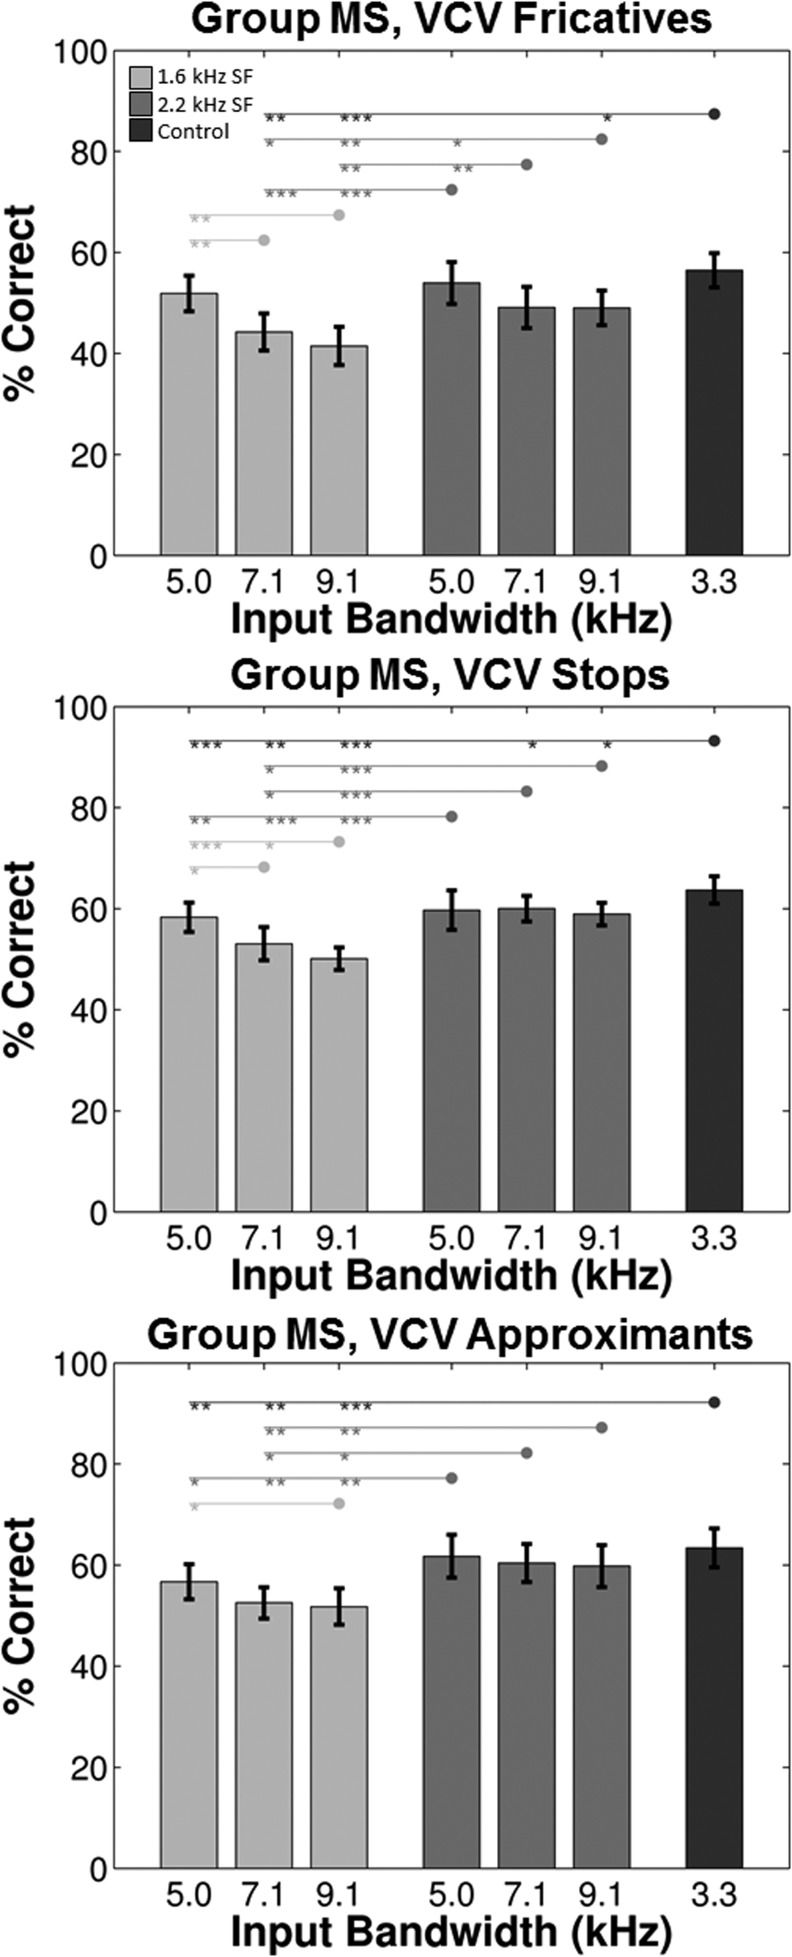
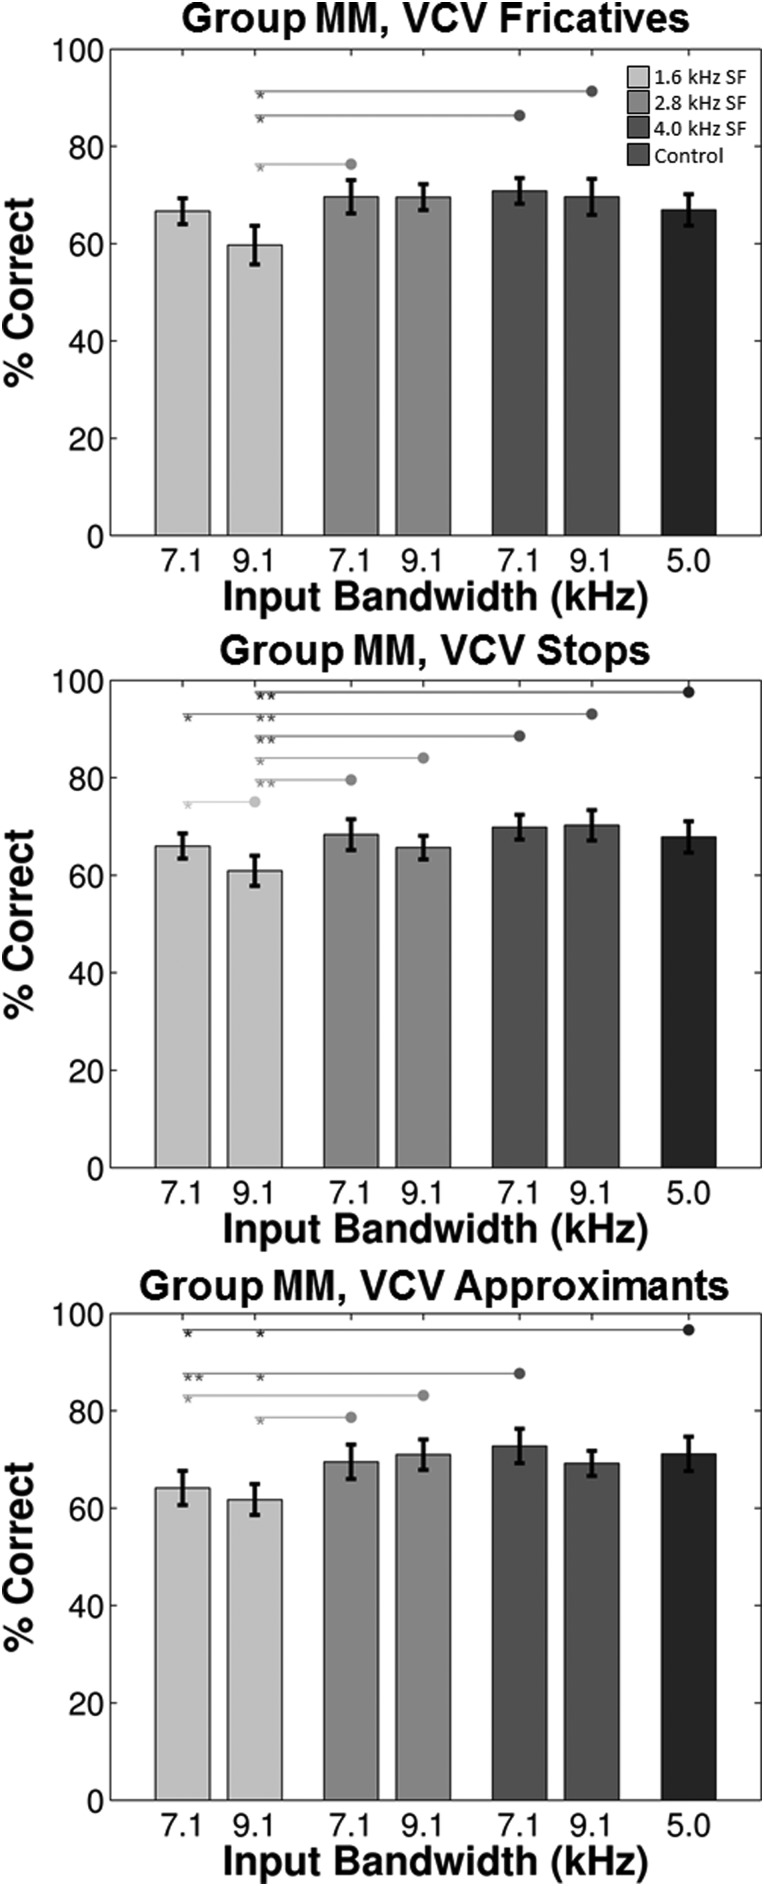
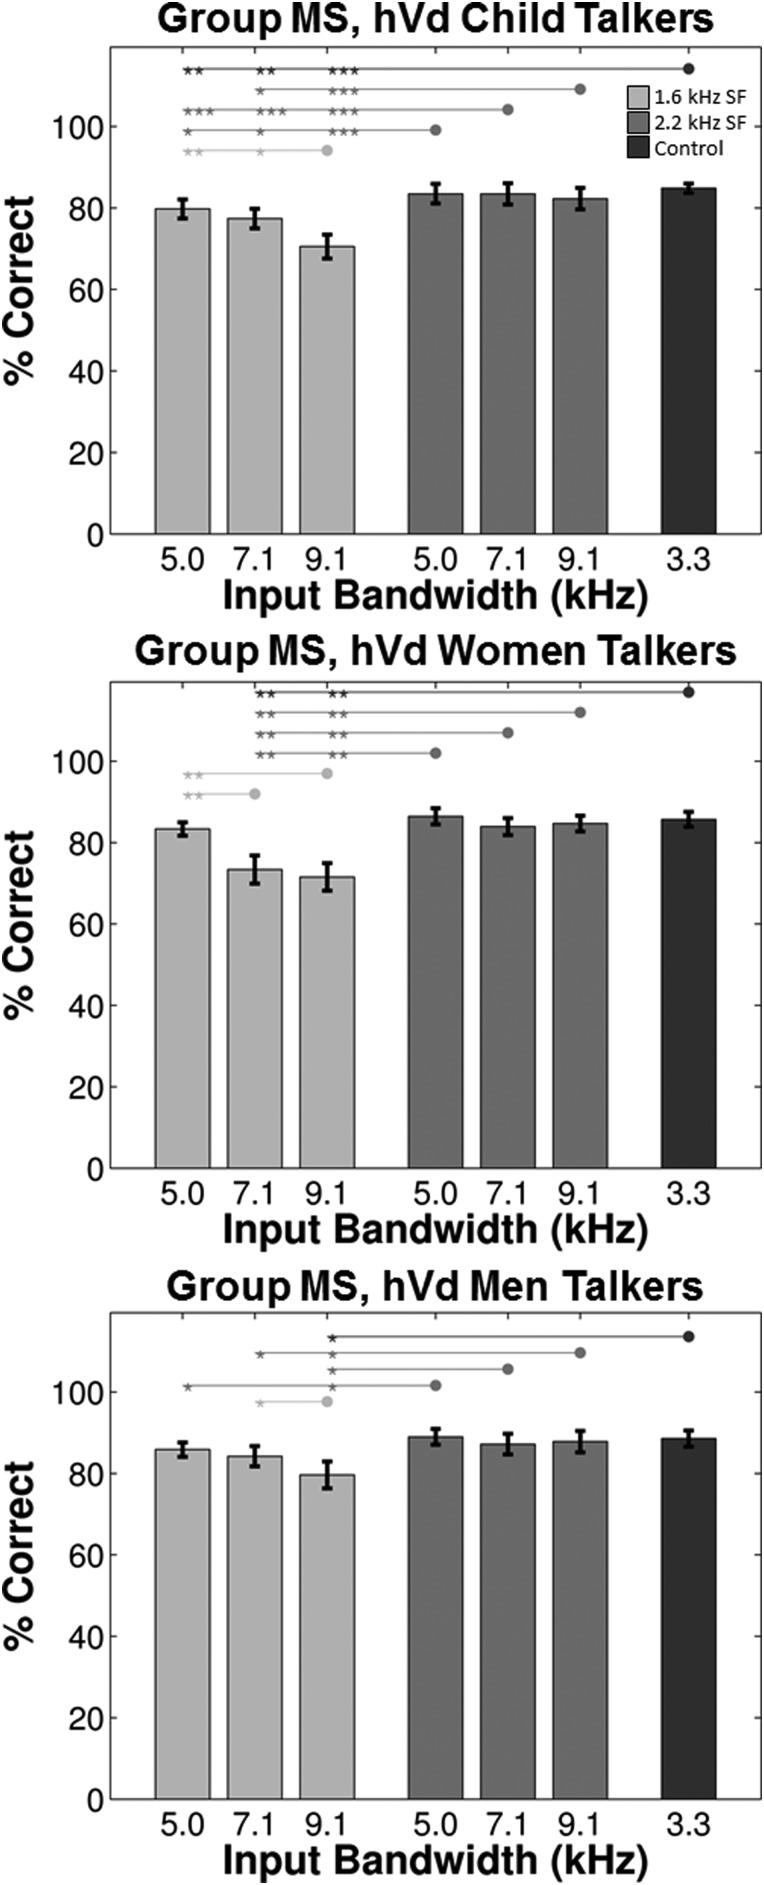
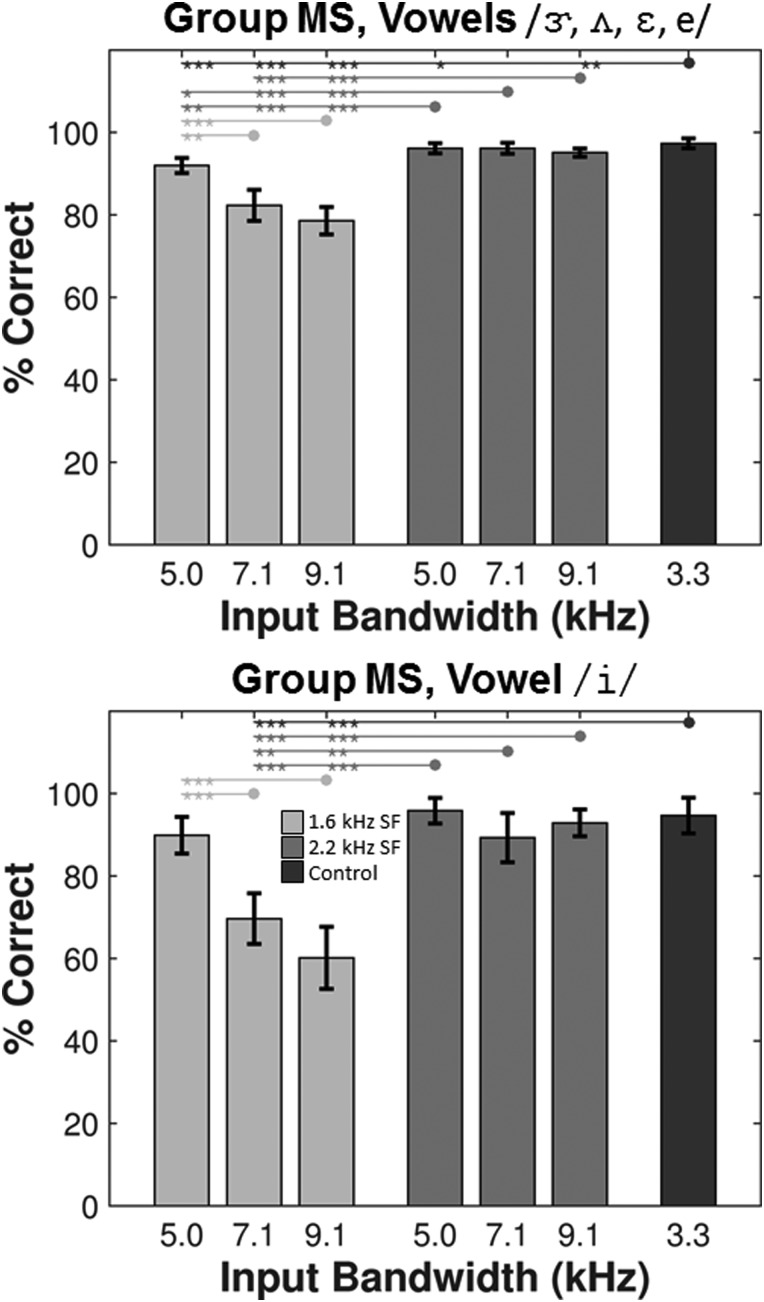
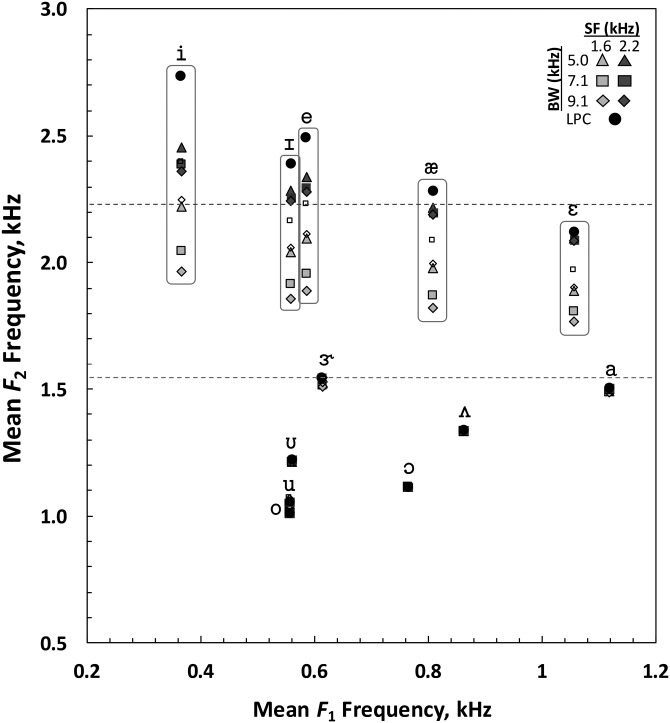
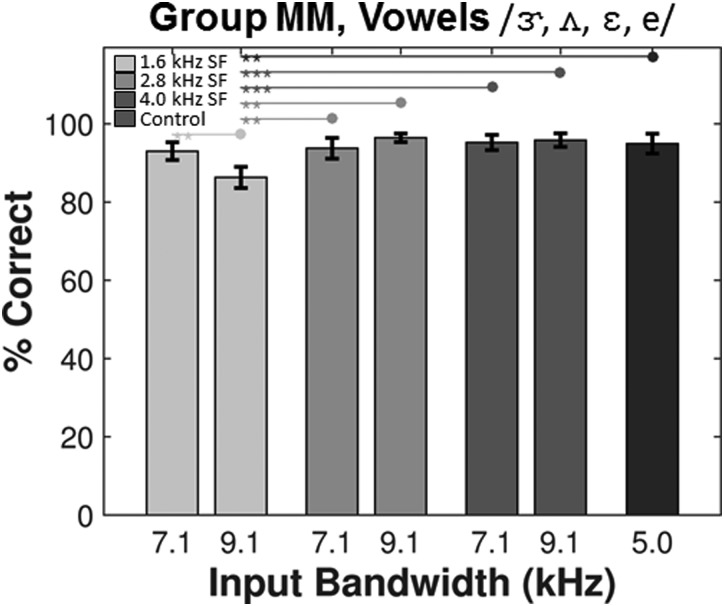
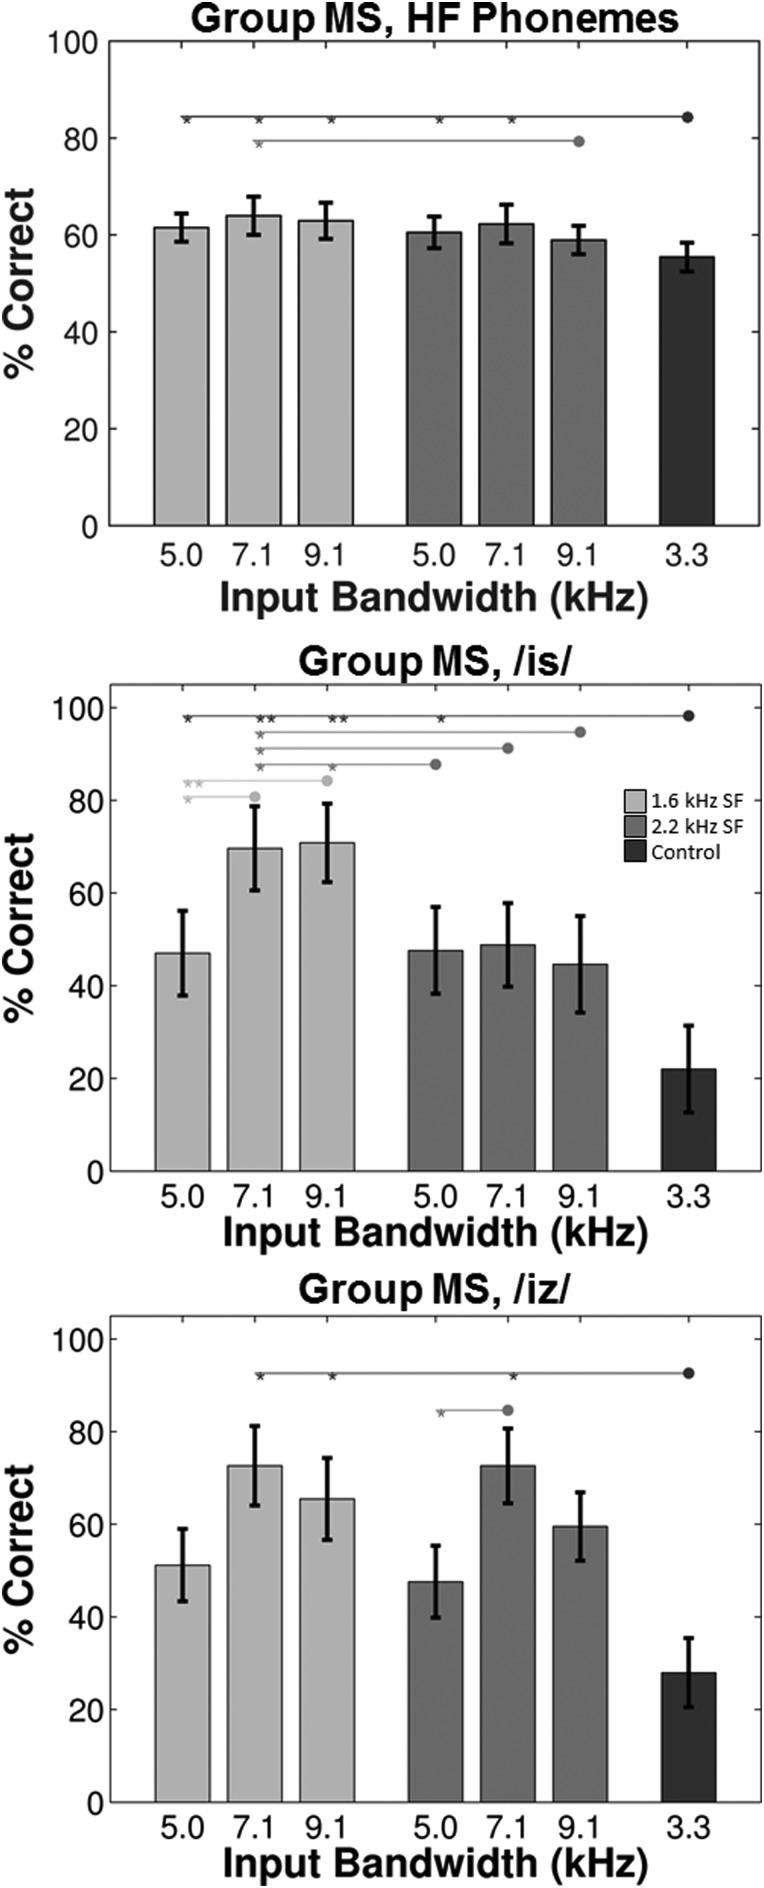
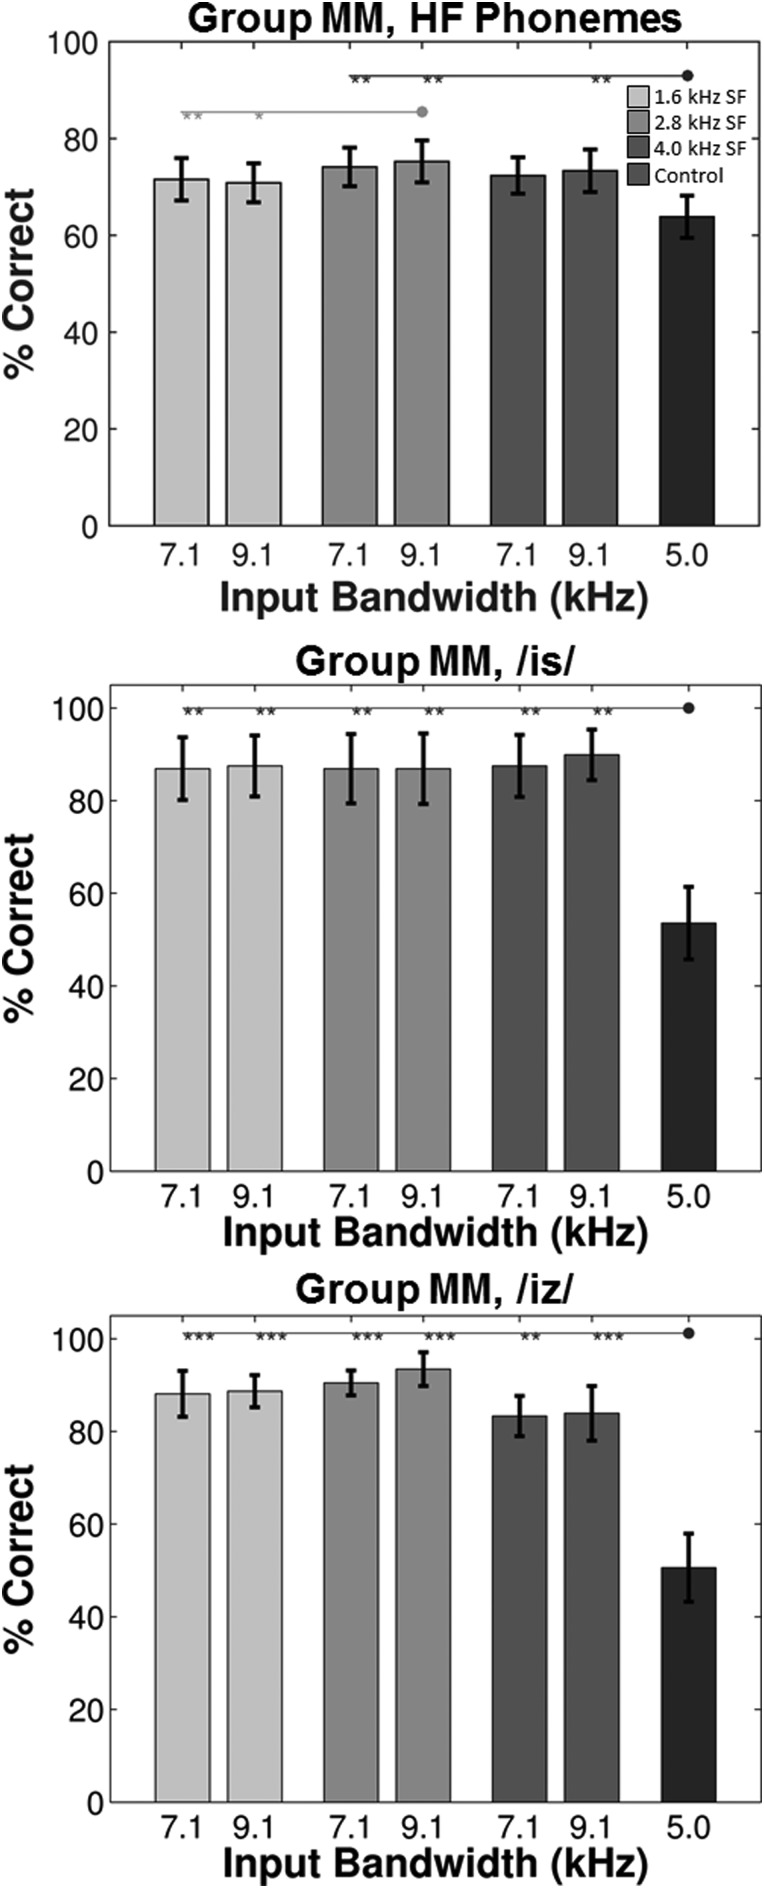
By varying parameters that control nonlinear frequency compression (NFC), this study examined how different ways of compressing inaudible mid- and/or high-frequency information at lower frequencies influences perception of consonants and vowels. Twenty-eight listeners with mild to moderately severe hearing loss identified consonants and vowels from nonsense syllables in noise following amplification via a hearing aid simulator. Low-pass filtering and the selection of NFC parameters fixed the output bandwidth at a frequency representing a moderately severe (3.3 kHz, group MS) or a mild-to-moderate (5.0 kHz, group MM) high-frequency loss. For each group (n = 14), effects of six combinations of NFC start frequency (SF) and input bandwidth [by varying the compression ratio (CR)] were examined. For both groups, the 1.6 kHz SF significantly reduced vowel and consonant recognition, especially as CR increased; whereas, recognition was generally unaffected if SF increased at the expense of a higher CR. Vowel recognition detriments for group MS were moderately correlated with the size of the second formant frequency shift following NFC. For both groups, significant improvement (33%-50%) with NFC was confined to final /s/ and /z/ and to some VCV tokens, perhaps because of listeners' limited exposure to each setting. No set of parameters simultaneously maximized recognition across all tokens.


Figures

FIG. 1.
FIG. 1.
Schematic of hypothetical frequency remapping functions that demonstrate tradeoffs when using NFC to remap speech into a fixed output BW (horizontal dotted line). The abscissa and ordinate represent the input and output frequencies, respectively, and the solid black line in each panel represents the frequency input-output function, with the black dot corresponding to the start frequency. Where the input-output function intersects with the output BW (vertical dashed line) is the input BW, the maximum input frequency represented in the audible range after lowering. (a) Setting with a low SF and a low CR; (b) the opposite in which a higher SF is traded for a higher CR in order to maintain an equivalent input BW; (c) a high SF is combined with a low CR, thereby, sacrificing input BW.
FIG. 2.
FIG. 2.
Time waveforms and spectrograms for the vowel-consonant syllable /is/: (a) the wideband source signal; (b) low-pass filtered at 3.3 kHz to simulate a loss of audibility associated with moderately severe hearing loss; (c) processed with nonlinear frequency compression (NFC) using settings that reduce the range of frequencies from 1.6 to 9.1 kHz to 1.6 to 3.3 kHz. The inlets in each panel show the spectrum of the steady portion of the vowel with the dark vertical line demarcating the original frequency of the second formant and with units on the abscissa and ordinate representing 1 kHz and 10 dB, respectively.
FIG. 3.
FIG. 3.
Audiometric thresholds for the listeners in group MS (a) and group MM (b), with each line and symbol combination representing a different listener and with the thick black line representing the group mean. The gray-shaded regions represent where stimuli were low-pass filtered at 3.3 kHz to create a moderately severe bandwidth restriction (a) or at 5.0 kHz to create a mild-to-moderate bandwidth restriction (b).
FIG. 4.
FIG. 4.
The frequency input-output functions and the NFC parameters used to derive them for group MS and group MM (top and bottom panels, respectively). Each SF is represented by a different shade of gray. For each SF, the desired input BWs were achieved by the selection of CR (see inlet for values).
FIG. 5.
FIG. 5.
Mean recognition scores and post hoc test outcomes for consonants when analyzed by manner of articulation (different panels) for group MS. Bars are grouped and shaded by the SF (1.6 kHz and 2.2 kHz), with the labels underneath corresponding to the three input BWs (5.0, 7.1, and 9.1 kHz). The last dark-gray bar corresponds to the 3.3-kHz low-pass control condition. Statistically significant paired comparisons are indicated by the lines and symbols above the bars, with the shaded dot corresponding to the reference condition used for each comparison and the shaded asterisks corresponding the level of significance (*p ≤ 0.05; **p ≤ 0.01; ***p ≤ 0.001).
FIG. 6.
FIG. 6.
Mean recognition scores and post hoc test outcomes for consonants when analyzed by manner of articulation (different panels) for group MM. Bars are grouped and shaded by the SF (1.6 kHz, 2.8 kHz, and 4.0 kHz), with the labels underneath corresponding to the two input BWs (7.1 and 9.1 kHz). The last dark-gray bar corresponds to the 5.0-kHz low-pass control condition.
FIG. 7.
FIG. 7.
Mean recognition scores and post hoc test outcomes for vowels when analyzed by talker for group MS. Results are plotted in the same manner as Fig. 5 for children, women, and men in the top, middle, and bottom panels, respectively.
FIG. 8.
FIG. 8.
For group MS, mean recognition scores and post hoc test outcomes for the vowels /ɝ, ʌ, ɛ, e/ are shown in the top panel and recognition scores and post hoc test outcomes for the vowel /i/ are shown in the bottom panel. Analyses revealed that only these vowels demonstrated significant differences between conditions and that the effect of condition was statistically equivalent for the vowels represented in the top panel.
FIG. 9.
FIG. 9.
Acoustic vowel space showing the effects of nonlinear frequency compression on the formant frequencies for the twelve vowels, averaged across all talkers in group MS. The light-gray and dark-gray symbols represent the 1.6 - and 2.2-kHz SF conditions, respectively, and the black circles represent the low-pass control condition. Triangles, squares, and diamonds represent the 5.0 -, 7.1 -, and 9.1-kHz BW conditions, respectively. The two horizontal dotted lines represent the two start frequencies. The smaller, open square and diamond symbols, respectively, represent the 1.6 kHz SF with 7.1 - and 9.1-kHz BW conditions from group MM because these were the only conditions from this group that caused a noticeable change in average F2 frequency. Note that the 1.6 kHz SF with 5.0 kHz BW (CR = 1.57) from group MS (light-gray triangles) and the 1.6 kHz SF with 9.1 kHz BW (CR = 1.52) from group MM (small, open diamonds) had almost the same frequency remapping functions, with the exception that the latter extended to 5.0 kHz in the output.
FIG. 10.
FIG. 10.
For group MM, mean recognition scores and post hoc test outcomes for the vowels /ɝ, ʌ, ɛ, e/. Analyses revealed that only these vowels demonstrated significant differences between conditions and that the effect of condition was statistically equivalent across these vowels.
FIG. 11.
FIG. 11.
Mean recognition scores and post hoc test outcomes for the high-frequency stimuli in group MS. The overall mean is plotted in the top panel and the individual results for /is/ and /iz/ are plotted in the middle and bottom panels, respectively.
FIG. 12.
FIG. 12.
Mean recognition scores and post hoc test outcomes for the high-frequency stimuli in group MM. The overall mean is plotted in the top panel and the individual results for /is/ and /iz/ are plotted in the middle and bottom panels, respectively.

References

    1. Alexander, J. M. (2010). “ Maximizing benefit from nonlinear frequency compression,” in 4th Phonak Virtual Audiology Conference.
    1. Alexander, J. M. (2013). “ Individual variability in recognition of frequency-lowered speech,” Semin. Hear. 34, 86–109.10.1055/s-0033-1341346 - DOI
    1. Alexander, J. M. (2014). “ How to use probe microphone measures with frequency-lowering hearing aids,” Audiol. Prac. 6(4), 8–13.
    1. Alexander, J. M. , Jenison, R. L. , and Kluender, K. R. (2011). “ Real-time contrast enhancement to improve speech recognition,” PLoS One 6(9), e24630.10.1371/journal.pone.0024630 - DOI - PMC - PubMed
    1. Alexander, J. M. , Kopun, J. G. , and Stelmachowicz, P. G. (2014). “ Effects of frequency compression and frequency transposition on fricative and affricate perception in listeners with normal hearing and mild to moderate hearing loss,” Ear Hear 35, 519–532.10.1097/AUD.0000000000000040 - DOI - PMC - PubMed

Publication types

MeSH terms