

The heritability and patterns of DNA methylation in normal human colorectum
- PMID: 26936820
- PMCID: PMC5181623
- DOI: 10.1093/hmg/ddw072
The heritability and patterns of DNA methylation in normal human colorectum
Abstract
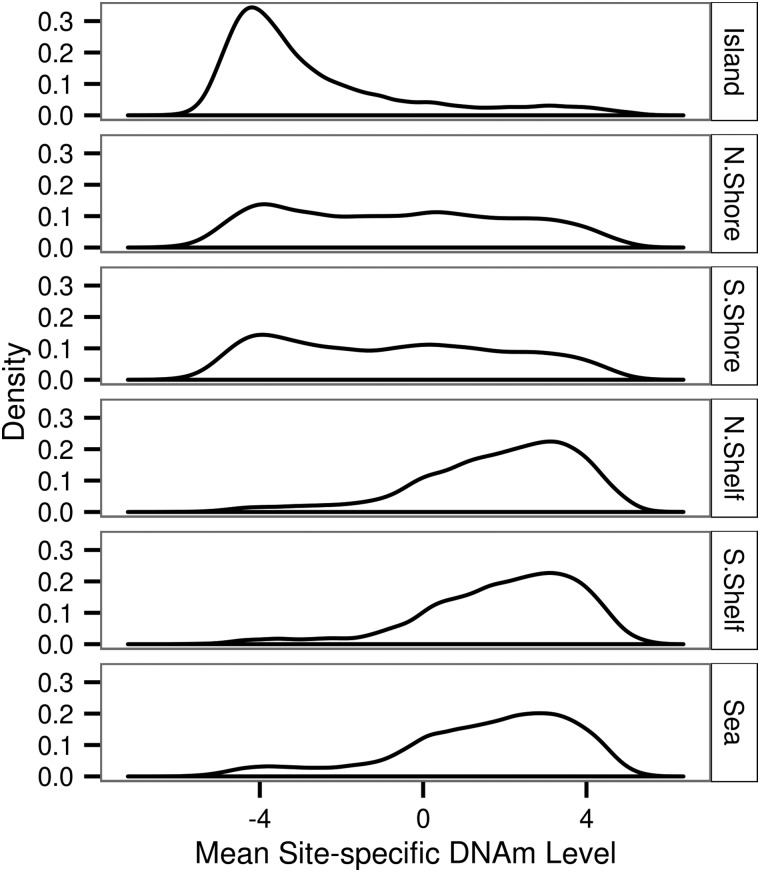
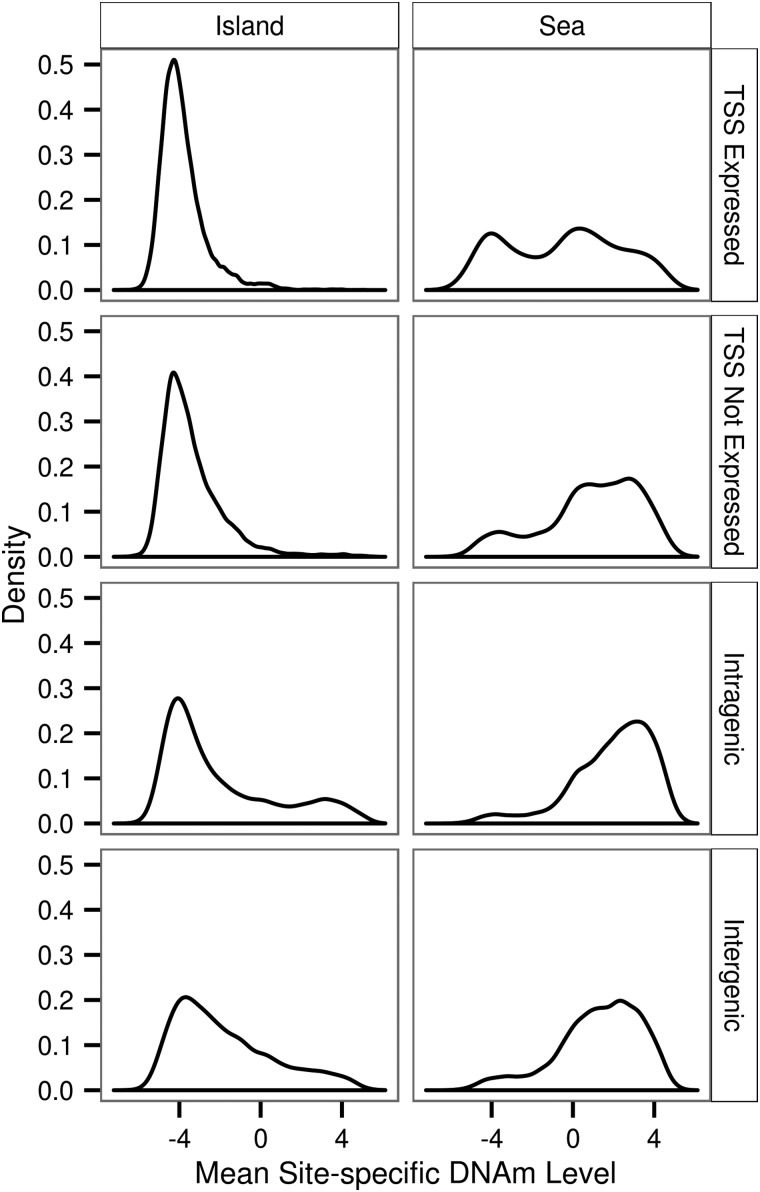
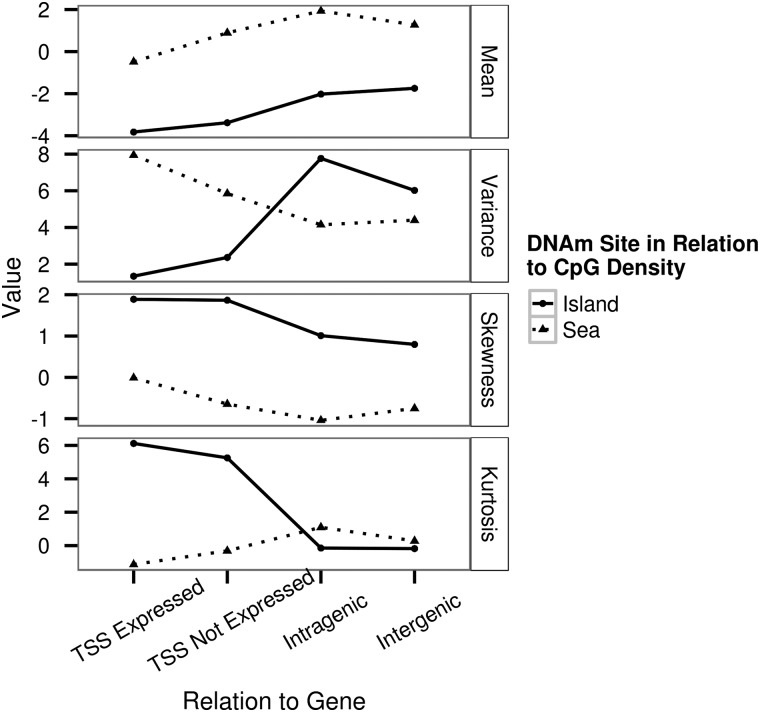
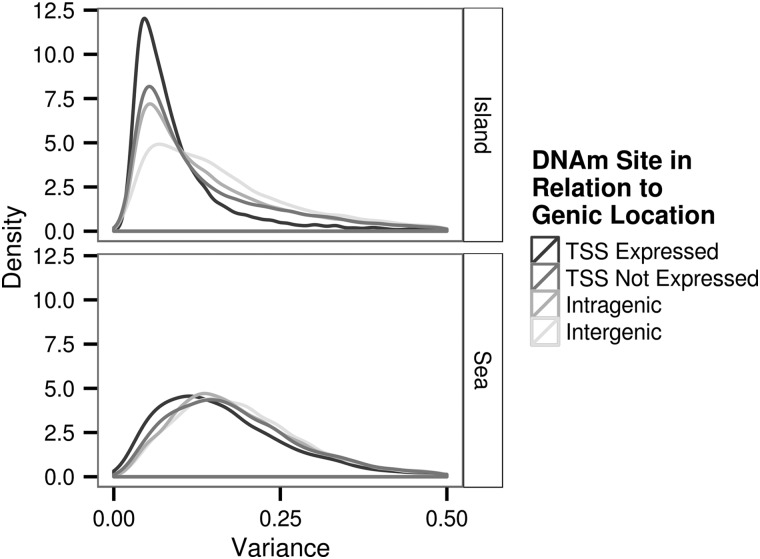
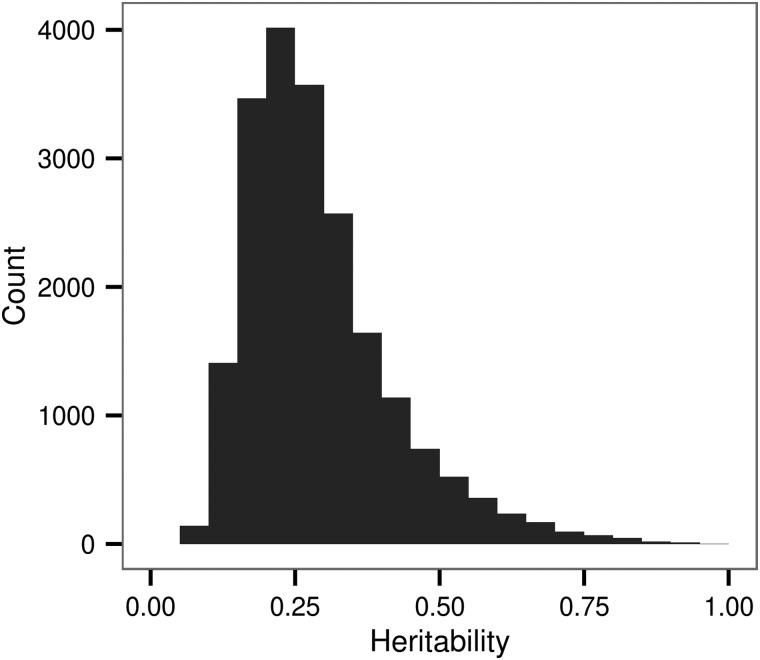
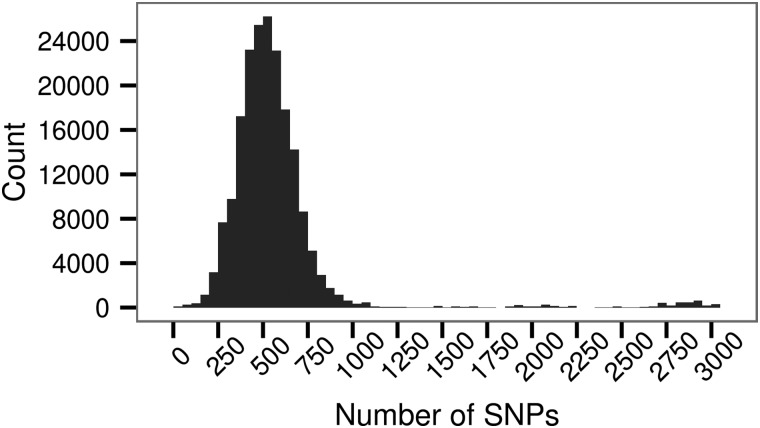
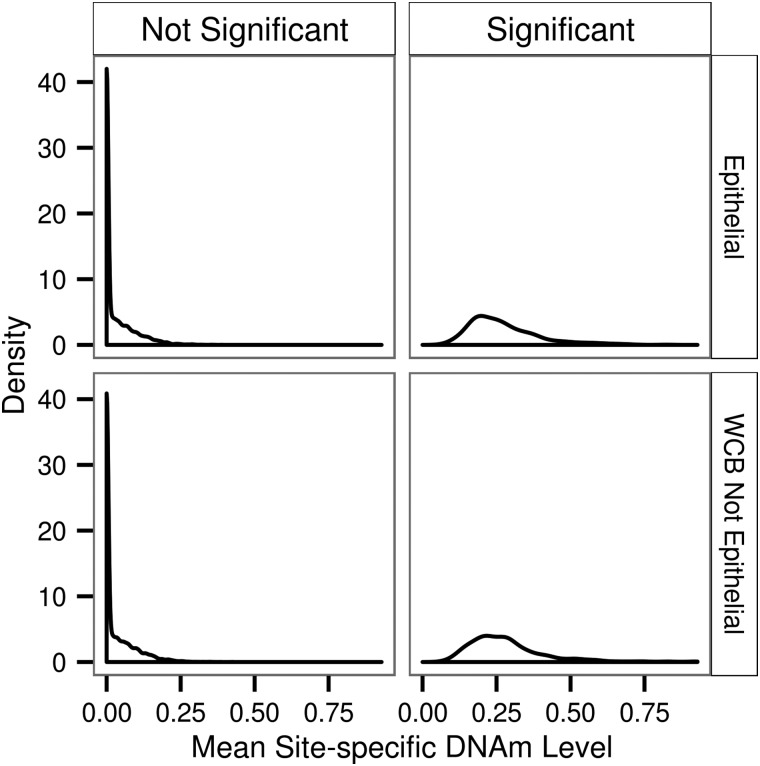
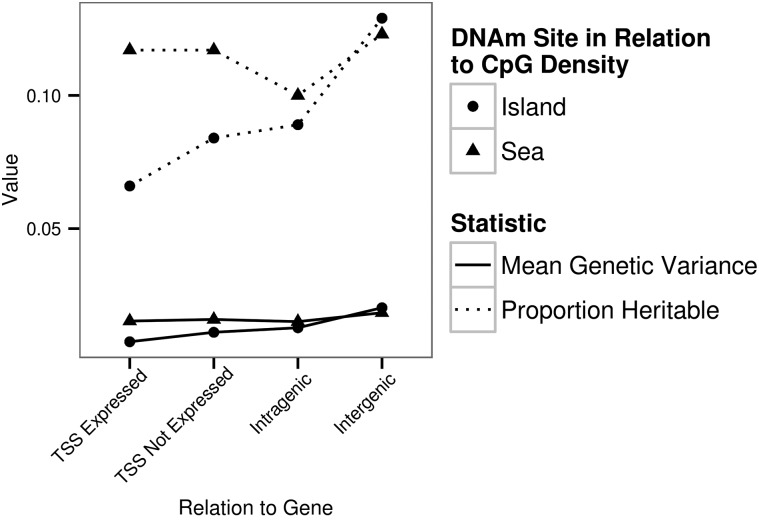
DNA methylation (DNAm) has been linked to changes in chromatin structure, gene expression and disease. The DNAm level can be affected by genetic variation; although, how this differs by CpG dinucleotide density and genic location of the DNAm site is not well understood. Moreover, the effect of disease causing variants on the DNAm level in a tissue relevant to disease has yet to be fully elucidated. To this end, we investigated the phenotypic profiles, genetic effects and regional genomic heritability for 196080 DNAm sites in healthy colorectum tissue from 132 unrelated Colombian individuals. DNAm sites in regions of low-CpG density were more variable, on average more methylated and were more likely to be significantly heritable when compared with DNAm sites in regions of high-CpG density. DNAm sites located in intergenic regions had a higher mean DNAm level and were more likely to be heritable when compared with DNAm sites in the transcription start site (TSS) of a gene expressed in colon tissue. Within CpG-dense regions, the propensity of the DNAm level to be heritable was lower in the TSS of genes expressed in colon tissue than in the TSS of genes not expressed in colon tissue. In addition, regional genetic variation was associated with variation in local DNAm level no more frequently for DNAm sites within colorectal cancer risk regions than it was for DNAm sites outside such regions. Overall, DNAm sites located in different genomic contexts exhibited distinguishable profiles and may have a different biological function.
© The Author 2016. Published by Oxford University Press.
Figures
References
-
- Cantone I., Fisher A.G. (2013) Epigenetic programming and reprogramming during development. Nat. Struct. Mol. Biol., 20, 282–289. - PubMed
-
- Sasaki H., Matsui Y. (2008) Epigenetic events in mammalian germ-cell development: reprogramming and beyond. Nat. Rev. Genet., 9, 129–140. - PubMed
-
- Weaver J.R., Susiarjo M., Bartolomei M.S. (2009) Imprinting and epigenetic changes in the early embryo. Mamm. Genome., 20, 532–543. - PubMed
-
- Bestor T.H. (2000) The DNA methyltransferases of mammals. Hum. Mol. Genet., 9, 2395–2402. - PubMed
Publication types
MeSH terms
Grants and funding
- MR/N003179/1/MRC_/Medical Research Council/United Kingdom
- BBS/E/D/20211553/BB_/Biotechnology and Biological Sciences Research Council/United Kingdom
- P30 GM114732/GM/NIGMS NIH HHS/United States
- BBS/E/D/20211554/BB_/Biotechnology and Biological Sciences Research Council/United Kingdom
- MC_PC_U127592696/MRC_/Medical Research Council/United Kingdom
LinkOut - more resources
Full Text Sources
Other Literature Sources
