. 2016 Sep;22(9):3206-20.
doi: 10.1111/gcb.13233. Epub 2016 Mar 3.

Temperature effects on fish production across a natural thermal gradient

Affiliations

Temperature effects on fish production across a natural thermal gradient

Eoin J O'Gorman et al. Glob Chang Biol. 2016 Sep.

Abstract

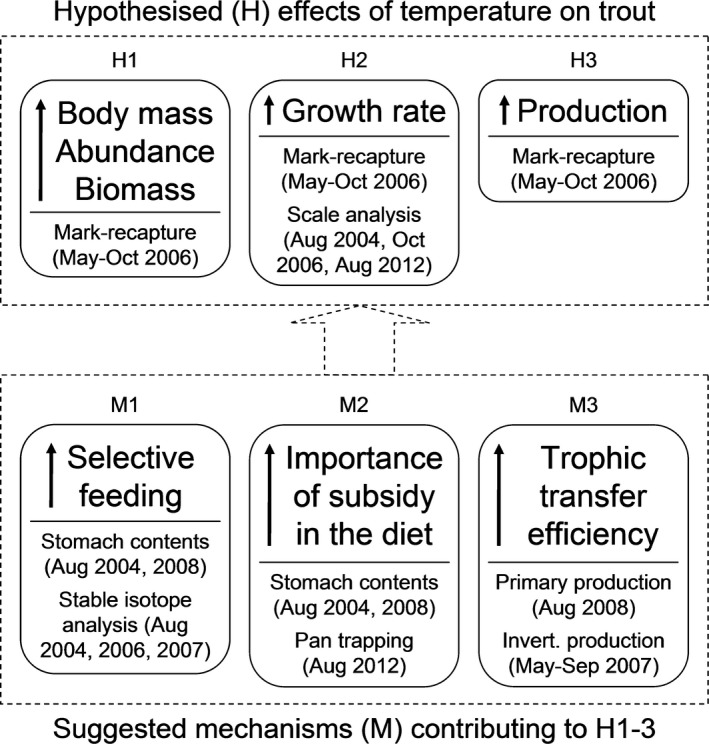
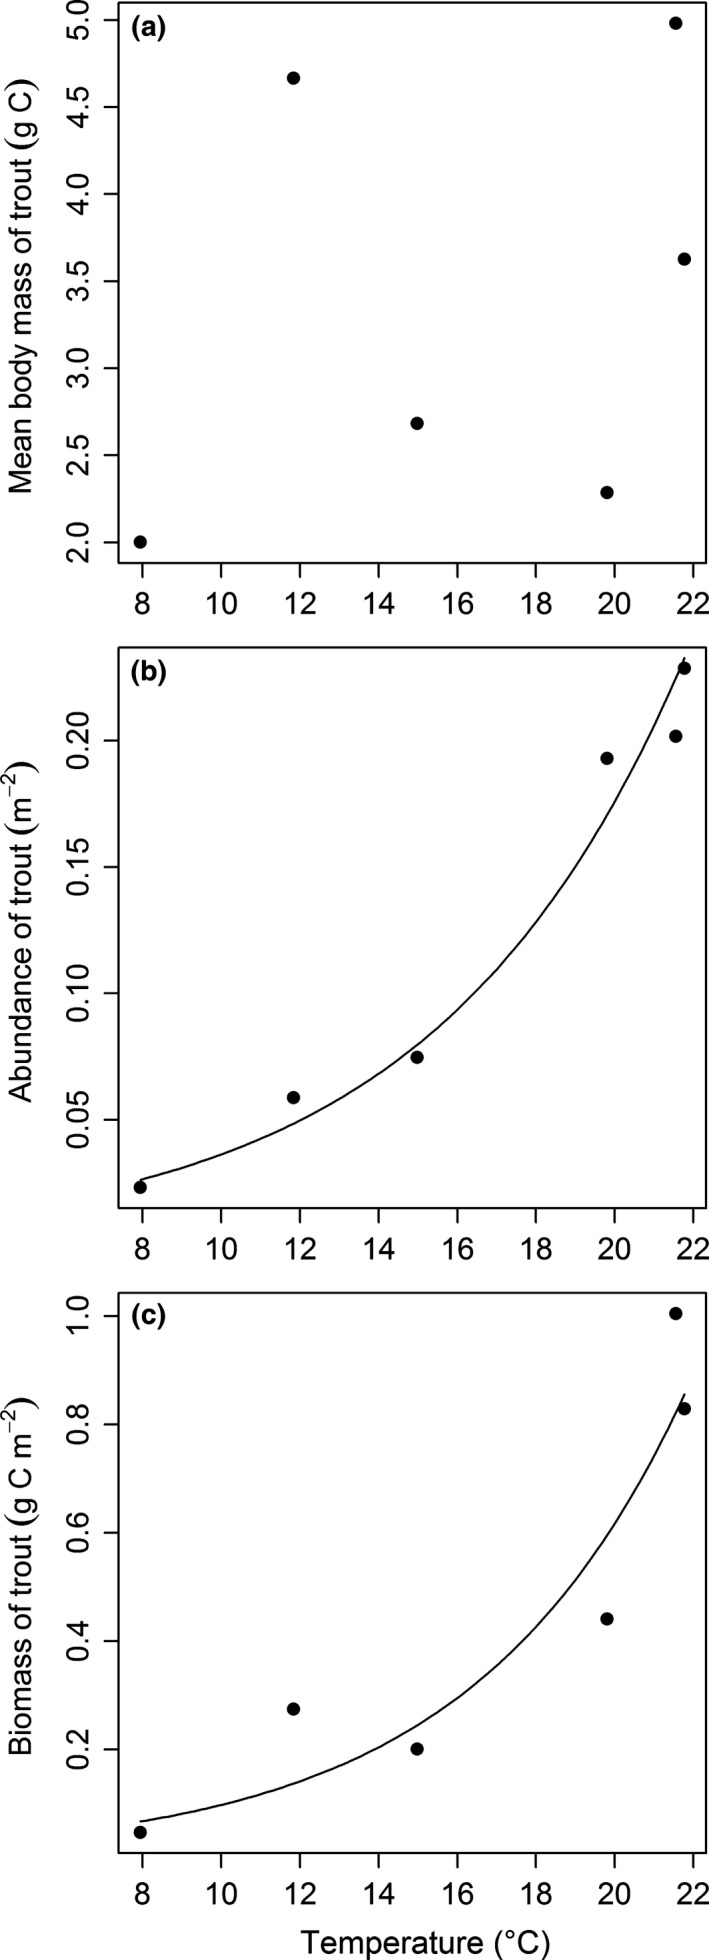
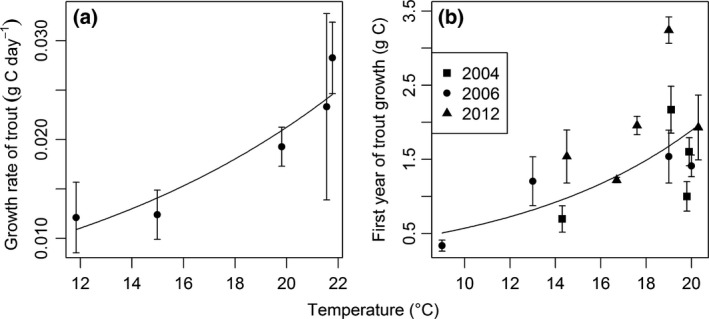
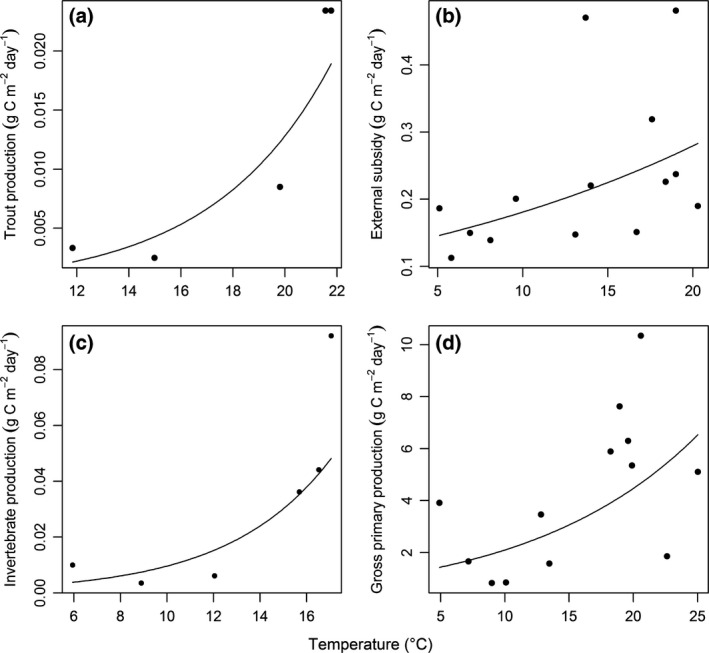
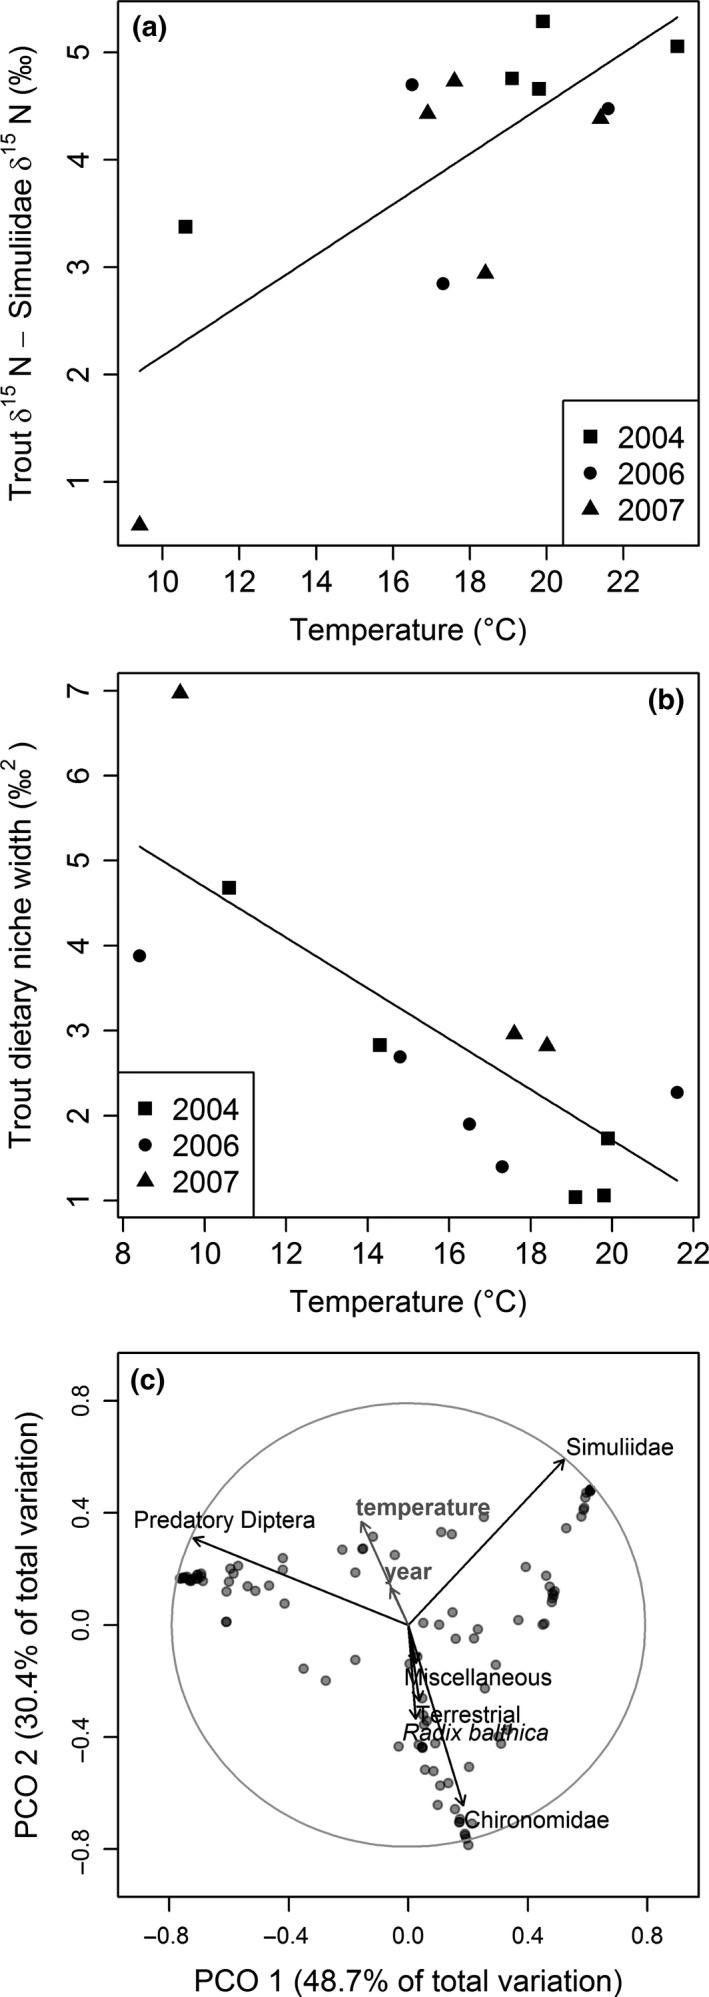
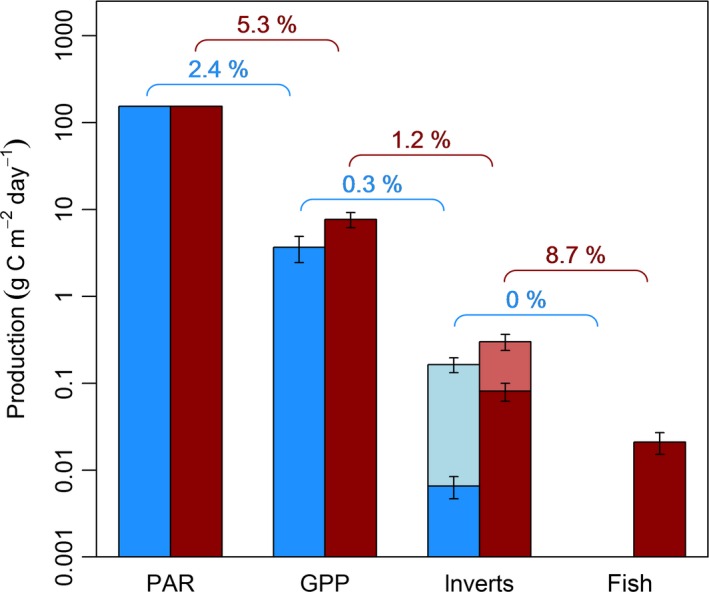
Global warming is widely predicted to reduce the biomass production of top predators, or even result in species loss. Several exceptions to this expectation have been identified, however, and it is vital that we understand the underlying mechanisms if we are to improve our ability to predict future trends. Here, we used a natural warming experiment in Iceland and quantitative theoretical predictions to investigate the success of brown trout as top predators across a stream temperature gradient (4-25 °C). Brown trout are at the northern limit of their geographic distribution in this system, with ambient stream temperatures below their optimum for maximal growth, and above it in the warmest streams. A five-month mark-recapture study revealed that population abundance, biomass, growth rate, and production of trout all increased with stream temperature. We identified two mechanisms that contributed to these responses: (1) trout became more selective in their diet as stream temperature increased, feeding higher in the food web and increasing in trophic position; and (2) trophic transfer through the food web was more efficient in the warmer streams. We found little evidence to support a third potential mechanism: that external subsidies would play a more important role in the diet of trout with increasing stream temperature. Resource availability was also amplified through the trophic levels with warming, as predicted by metabolic theory in nutrient-replete systems. These results highlight circumstances in which top predators can thrive in warmer environments and contribute to our knowledge of warming impacts on natural communities and ecosystem functioning.

Keywords: Arctic; Hengill; PIT tag; Salmo trutta fario; ecosystem services; freshwater; mark-recapture; natural experiment.


Figures

Figure 1
Figure 1
Overview of hypotheses and suggested mechanisms contributing to them, around which the paper is structured. Trout in our system are at the northern limit of their distribution, leading us to hypothesize that: (1) body mass, abundance and biomass; (2) growth rate; and (3) production will increase with temperature. We expect increases in: (1) feeding selectivity; (2) importance of external subsidy in the diet; and (3) trophic transfer efficiency at higher temperatures to facilitate our hypothesized effects on trout. Methodological approaches and timing of sampling are listed in smaller print beneath each metric.
Figure 2
Figure 2
Relationships between stream temperature and: (a) mean body mass (Linear regression: F 1,4 = 0.76, = 0.433); (b) population abundance (Linear regression: log = log 0.0075 + 0.1578x, F 1,4 = 194.4, < 0.001, r 2 = 0.97); (c) biomass (Linear regression: log = log 0.0154 + 0.1844x, F 1,4 = 28.02, = 0.006, r 2 = 0.84) of trout.
Figure 3
Figure 3
Relationships between stream temperature and: (a) geometric mean growth rate of trout in grams of carbon per day (Linear regression: log = log 0.0041 + 0.0817x, F 1,4 = 28.00, = 0.0132, r 2 = 0.87); (b) geometric mean grams of carbon after the first year of growth (GLMM: log = log 0.1730 + 0.1195x, t 9 = 3.817, = 0.004, r 2 = 0.63). Since growth rates are calculated from individual trout measurements, standard error bars are displayed for each stream.
Figure 4
Figure 4
Relationships between stream temperature and: (a) trout production (Linear regression: log = log 0.00016 + 0.2192x, F 1,3 = 15.11, = 0.030, r 2 = 0.78); (b) subsidy of adult Diptera to the streams (Linear regression: log = log 0.1171 + 0.0435x, F 1,12 = 4.85, = 0.048, r 2 = 0.23); (c) benthic invertebrate production (Linear regression: log = log 0.00098 + 0.2282x, F 1,4 = 7.79, = 0.049, r 2 = 0.58); and (d) gross primary production (GPP) (Linear regression: log = log 0.9857 + 0.0756x, F 1,11 = 5.52, = 0.039, r = 0.27).
Figure 5
Figure 5
Relationships between stream temperature and the (a) average trophic position of trout relative to filter feeding Simuliidae (GLMM:= 0.2350x – 0.1742; t = 3.615, = 0.006; r 2 = 0.56); and (b) dietary niche width of trout (GLMM:= −0.2979x + 7.6689; t 9 = −5.326, < 0.001; r 2 = 0.77). (c) Euclidean ordination based on the resemblance matrix created from trout selectivity for six prey groups. The plot facilitates comparison of trout selectivity for the six prey groups (black arrows) with the predictor variables temperature and year (grey arrows) in multivariate space. Longer vectors indicate a stronger correlation. Darker symbols indicate one or more points overlaying each other.
Figure 6
Figure 6
Mean trophic transfer efficiencies between each trophic level in the system for three cold (in blue) and three warm (in red) streams. Error bars represent the standard error around the mean for the three streams in each category. PAR is the same for every stream in the system, so no error bars are shown. Production estimates are expressed in g C m−2 day−1 at each trophic level for consistent comparison, with external subsidy of adult Diptera to the streams highlighted in pale blue and red. Mean invertebrate production in the cold and warm streams was 0.0066 and 0.0810 g C m−2 year−1, respectively; mean external subsidy in the cold and warm streams was 0.1637 and 0.3011 g C m−2 day−1, respectively.

References

    1. Adams G, Pichler DE, Cox EJ, O'Gorman EJ, Seeney A, Woodward G, Reuman DC (2013) Diatoms can be an important exception to temperature‐size rules at species and community levels of organization. Global Change Biology, 19, 3540–3552. - PMC - PubMed
    1. Allen A, Gillooly J, Brown J (2005) Linking the global carbon cycle to individual metabolism. Functional Ecology, 19, 202–213.
    1. Almodóvar A, Nicola GG, Ayllón D, Elvira B (2012) Global warming threatens the persistence of Mediterranean brown trout. Global Change Biology, 18, 1549–1560.
    1. Anderson MJ (2001) A new method for non‐parametric multivariate analysis of variance. Austral Ecology, 26, 32–46.
    1. Anderson‐Teixeira KJ, Vitousek PM, Brown JH (2008) Amplified temperature dependence in ecosystems developing on the lava flows of Mauna Loa, Hawai'i. Proceedings of the National Academy of Sciences of the United States of America, 105, 228–233. - PMC - PubMed