. 2016 Apr 12;133(15):1458-71; discussion 1471.
doi: 10.1161/CIRCULATIONAHA.115.020678. Epub 2016 Mar 2.

Cardiac Stim1 Silencing Impairs Adaptive Hypertrophy and Promotes Heart Failure Through Inactivation of mTORC2/Akt Signaling

Affiliations

Cardiac Stim1 Silencing Impairs Adaptive Hypertrophy and Promotes Heart Failure Through Inactivation of mTORC2/Akt Signaling

Ludovic Bénard et al. Circulation. .

Abstract

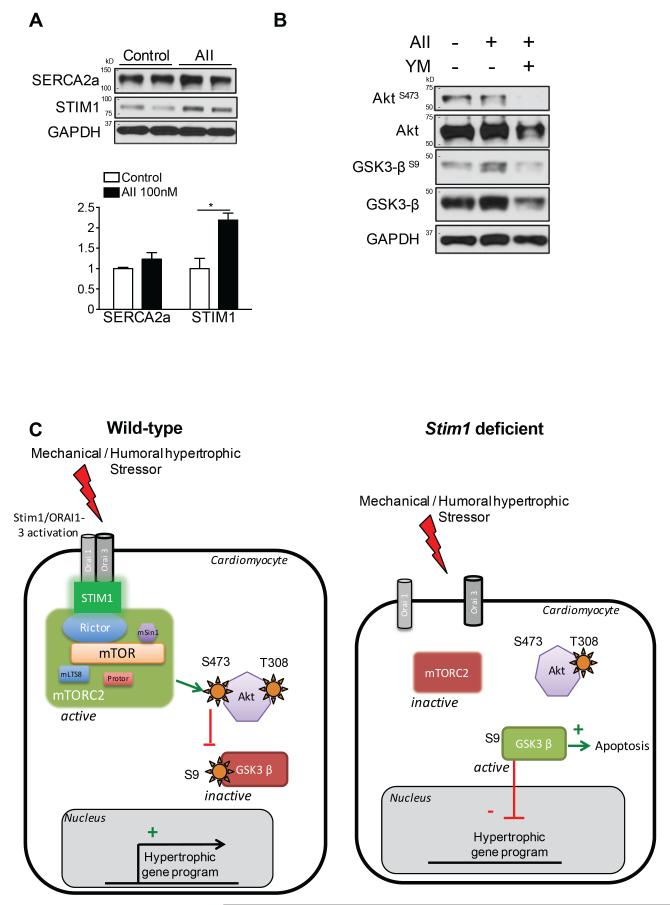
Background: Stromal interaction molecule 1 (STIM1) is a dynamic calcium signal transducer implicated in hypertrophic growth of cardiomyocytes. STIM1 is thought to act as an initiator of cardiac hypertrophic response at the level of the sarcolemma, but the pathways underpinning this effect have not been examined.

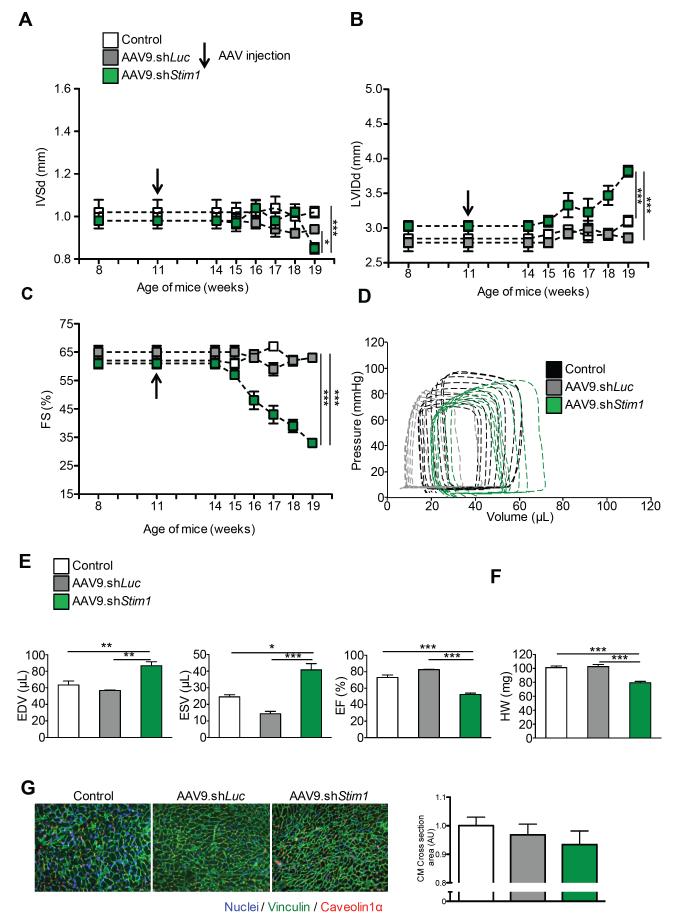
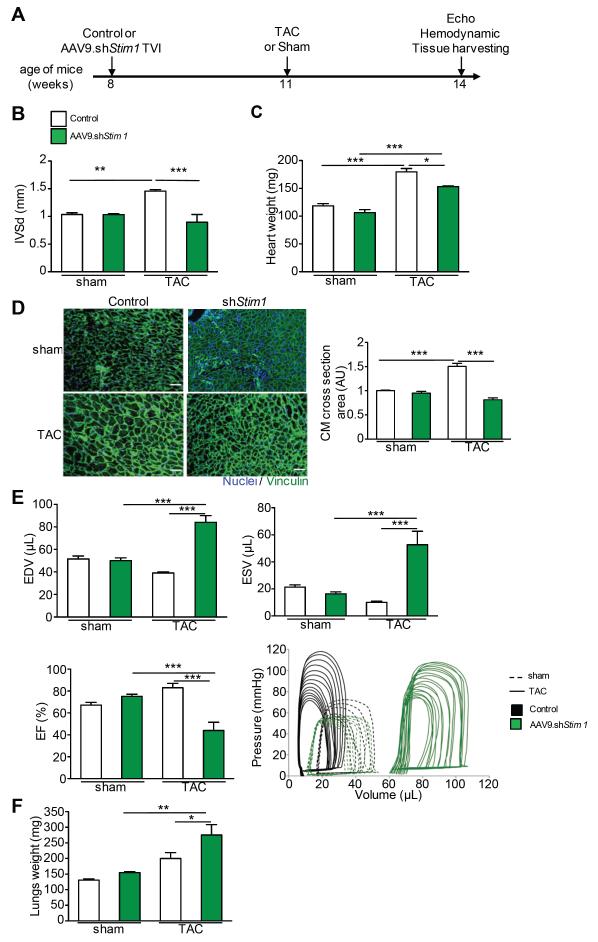
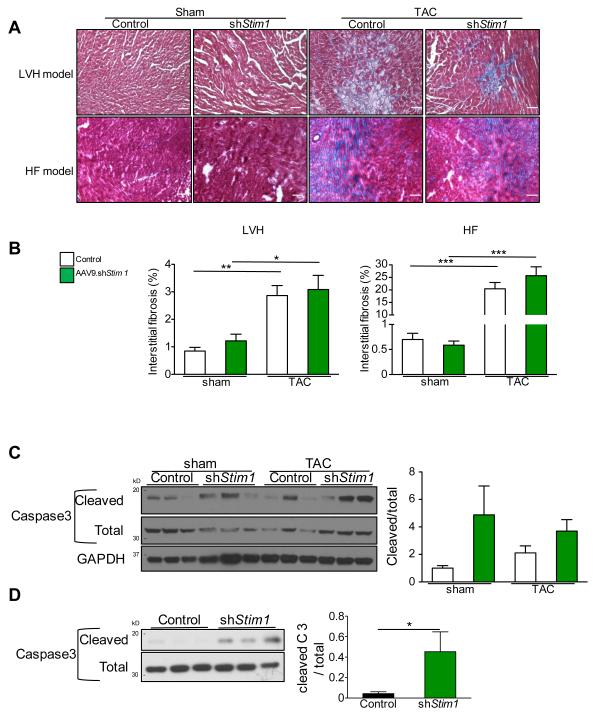
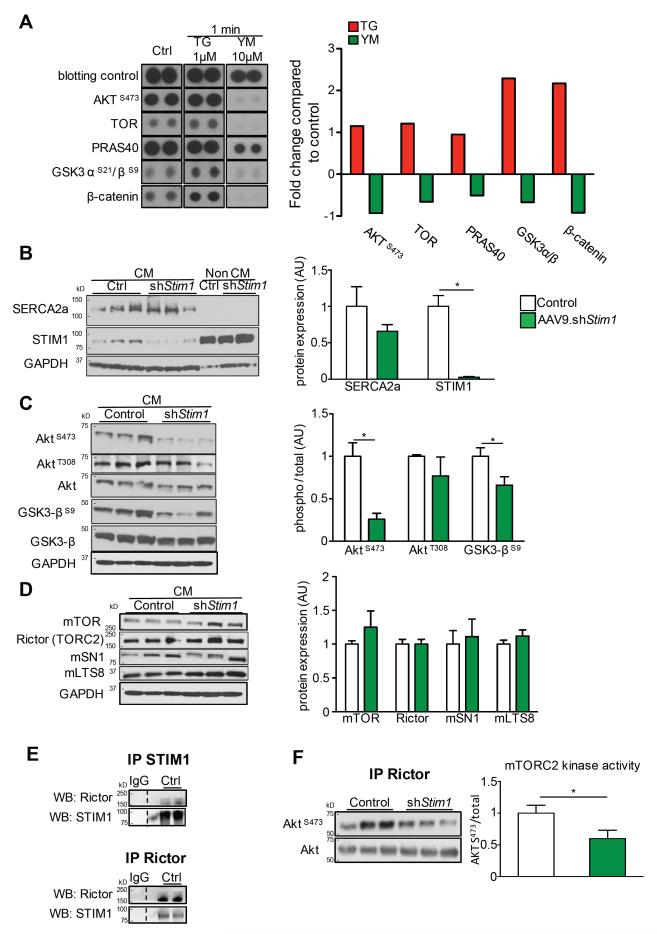
Methods and results: To determine the mechanistic role of STIM1 in cardiac hypertrophy and during the transition to heart failure, we manipulated STIM1 expression in mice cardiomyocytes by using in vivo gene delivery of specific short hairpin RNAs. In 3 different models, we found that Stim1 silencing prevents the development of pressure overload-induced hypertrophy but also reverses preestablished cardiac hypertrophy. Reduction in STIM1 expression promoted a rapid transition to heart failure. We further showed that Stim1 silencing resulted in enhanced activity of the antihypertrophic and proapoptotic GSK-3β molecule. Pharmacological inhibition of glycogen synthase kinase-3 was sufficient to reverse the cardiac phenotype observed after Stim1 silencing. At the level of ventricular myocytes, Stim1 silencing or inhibition abrogated the capacity for phosphorylation of Akt(S473), a hydrophobic motif of Akt that is directly phosphorylated by mTOR complex 2. We found that Stim1 silencing directly impaired mTOR complex 2 kinase activity, which was supported by a direct interaction between STIM1 and Rictor, a specific component of mTOR complex 2.

Conclusions: These data support a model whereby STIM1 is critical to deactivate a key negative regulator of cardiac hypertrophy. In cardiomyocytes, STIM1 acts by tuning Akt kinase activity through activation of mTOR complex 2, which further results in repression of GSK-3β activity.

Keywords: Stim1 protein, mouse; TOR complex 2; calcium; genetic therapy; heart failure.


Figures

Figure 1
Figure 1
Stim1 silencing under physiological conditions. Time-course analysis of A, inter ventricular septum thickness (IVSd), B, left ventricular internal diastolic diameter (LVIDd) and C, fractional shortening (FS) of wild-type mice treated with AAV9.shStim1 (green), AAV9.shLuciferase (gray) or PBS (white). Mice were followed up to 8 weeks after infection. d = in diastole. D, Representative Pressure-Volume loops in wild-type mice treated with AAV9.shStim1 (green), AAV9.shLuciferase (gray) or PBS (black). E, Hemodynamic parameters (end diastolic volumes (EDV); end systolic volumes (ESV); ejection fraction (EF)) assessed 8 weeks after AAV injection. F, Heart weights. G, Cardiomyocyte areas in the three groups. Immunofluorescence analysis was performed on left ventricular sections (8μm) using an antibody against Vinculin (green) and Caveolin1α (red). Nuclei were stained with DAPI. Images were taken at 20X magnification. N=5-10 animals per group for all experiments, * p<0.05, ** p<0.01, *** p<0.001
Figure 2
Figure 2
Stim1 silencing before TAC prevented the establishment of cardiac hypertrophy. A, Schematic timeline to study Stim1 silencing effect on TAC-induced left ventricular hypertrophy (LVH). B, Cardiac walls thickness assessed by echocardiography in sham vs. TAC animals treated with AAV9.shStim1 (green), or control (white). IVS=Interventricular Septum, d=in diastole. C, Heart weights. D, Left, immunofluorescence analysis of left ventricular sections (8μm) using an antibody against Vinculin (green). Nuclei were stained with DAPI. Images were taken at 20X magnification. Right, quantification of cardiomyocyte area in the four groups. E, Cardiac function assessed by hemodynamic measurements. Top left, End Diastolic volume (EDV). Top right, End Systolic Volume (ESV). Bottom left, Ejection Fraction (EF) and bottom right, characteristic pressure-volume loops. AAV9.shStim1 treated groups are in green, controls are in white for the bar graphs and in black for the PV loops. F, Lung weights. N≥8 per groups. * p<0.05, ** p<0.01, *** p<0.001.
Figure 3
Figure 3
Stim1 silencing after TAC reverted established cardiac hypertrophy. A, Schematic timeline to study Stim1 silencing effect on TAC-induced heart failure (HF). B, Time-course of Fractional Shortening (left) and Left Ventricular Internal Diameter (right) assessed by echocardiography. d=in diastole. Sham (dotted line) vs. TAC (straight line) animals treated with AAV9.shStim1 (green) or control (white). C, Cardiac function and volumes assessed by hemodynamic measurements. Top left, End Diastolic volume (EDV). Top right, End Systolic Volume (ESV). Bottom left, Ejection Fraction (EF) and bottom right, representative pressure-volume loops in the four groups of animals. D, Time-course of Inter Ventricular Septum thickness in diastole (IVSd) assessed by echocardiography in the four groups of animals. Sham (dotted line) vs. TAC (straight line) animals treated with AAV9.shStim1 (green) or control (white). E, Heart and lung weights at the time of sacrifice. F, Left, immunofluorescence analysis of left ventricular sections (8μm) using an antibody against Vinculin (green) and Caveolin1α (red). Nuclei were stained with DAPI. Images were taken at 20X magnification. Right, quantification of cardiomyocyte area. N≥6 per groups. * p<0.05, ** p<0.01, *** p<0.0001.
Figure 4
Figure 4
Influence of Stim1 silencing on the establishment of cardiac interstitial fibrosis and on the activation of Caspase 3. A, Characteristic images of Masson’s trichrome staining of left ventricular sections of sham and TAC control vs. shStim1 treated animals in both LVH and HF models. B, Quantification of interstitial fibrosis from mice of LVH model (left) and from mice of HF model (Right). C, Left, Western blot analysis on whole cardiac tissue of total and cleaved Caspase 3 from mice of the HF model. Right, quantification of Western blots. D, Left, Western blot analysis on isolated cardiac myocytes of total and cleaved Caspase 3 from wild-type mice treated with AAV9.shStim1 or control. Right, quantification of Western blots. n≥6 animals per group for fibrosis measurements and n=3 animals per group for caspase3 Western Blot, * p<0.05, ** p<0.01, *** p<0.001.
Figure 5
Figure 5
GSK-3β inhibition blocked Stim1 silencing pro-atrophic effect. A, Left, Western blot analysis on whole cardiac tissue of GSK3β (total and phosphorylated form of GSK3β at Ser9) and STIM1 from the four groups in the TAC-induced HF model. Right, quantification of phosphorylated form of GSK3β at Ser9 on total. B, Schematic timeline to study GSK3β inhibition effect in the context of Stim1 silencing in a model of TAC-induced heart failure. Vehicle or GSK3β inhibitor (TDZD8) were administered daily via intra-peritoneal administration starting 3 weeks after AAV9.shStim1 injection. C, Left, Western blot analysis on whole cardiac tissue of STIM1 and GSK3β after vehicle or TDZD8 treatment. Right, quantification of Western blots. D, Time-course of Inter Ventricular Septum (IVS) thickness (left), Left Ventricular Internal Diameter (LVID) in diastole (middle) and Fractional Shortening (right) assessed by serial echocardiography in AAV9.shStim1-treated mice receiving vehicle (green) or GSK3β inhibitor (red) E, Left, immunofluorescence analysis of left ventricular sections (8μm) using an antibody against Vinculin (green). Images were taken at 20X magnification. Right, quantification of cardiomyocyte area. F, Heart weights. d=in diastole. n≥3 per groups. * p<0.05, ** p<0.01, *** p<0.001.
Figure 6
Figure 6
STIM1/ORAI dependent calcium entry regulates Akt and GSK3β phosphorylation in HEK cells and cardiac myocytes. A, Human phospho-kinase Assay (R&D Systems®) in HEK cells. Typical patterns of five main targets (AktS473, TOR, PRAS40, GSK3 αS21S9, β-catenin) and blotting control in basal conditions (left panel), in response to the STIM1 activator Thapsigargin (middle panel) and to the STIM1/Orai blocker YM-58483. Right, quantification of typical changes in phosphorylation of the selected 5 targets compared to control condition. B, Left, Western blot analysis of SERCA2a and STIM1 on isolated cardiac myocytes and non cardiac myocytes fractions from control and AAV9.shStim1 treated mice. Right, quantification of Western blots. C, Left, Western blot analysis of phosphorylation of AktS473, AktT308, GSK3βS9 on isolated cardiac myocytes from control and AAV9.shStim1 infected mice. Right, quantification of Western blots. D, Left, Western blot analysis of mTOR, Rictor, mSN1 and mLTS8 on isolated cardiac myocytes from control and AAV9.shStim1 infected mice. Right, quantification of Western blots. E, STIM1 (Top) or Rictor (Bottom) were immuno-precipitated from isolated mouse cardiac myocytes. Immunoprecipitates with control IgG were used as control. Representative immunoblots of STIM1 and Rictor in both co-immunoprecipitates (as indicated) are shown. F, mTORC2 in vitro kinase assay was performed on control and shStim1-treated cardiac myocytes using immunopurified mTORC2 (Rictor) and recombinant kinase-dead Akt as a substrate. Left, Western blot analysis of AktS473 and total Akt, Right, quantification of Western blot. n=3 per groups for Western blot, n=3 in duplicate for mTORC2 kinase assay. * p<0.05, ** p<0.01, *** p<0.001.
Figure 7
Figure 7
Pharmacological STIM1/ORAI inhibition blocked AktS473 and GSK3βS9 phosphorylation in isolated cardiac myocytes. A, Left, Western blot analysis of SERCA2a and STIM1 on isolated cardiac myocytes from control mice treated 48 hours with Angiotensin II 100nM. Right, quantification of Western blots. B, Western blot analysis of phosphorylation of Akt at Ser473 and GSK3β at Ser9 on isolated cardiac myocytes from control mice treated with 48 hours with Angiotensin II 100nM +/− YM-58483 1μM. C, Schematic model of the role of STIM1 activation on mTORC2/Akt signaling during hypertrophic stimulation in wild-type (left) and Stim1-deficient (right) cardiac myocytes.

References

    1. Porrello ER, Olson EN. A neonatal blueprint for cardiac regeneration. Stem Cell Res. 2014;13:556–570. - PMC - PubMed
    1. Heineke J, Molkentin JD. Regulation of cardiac hypertrophy by intracellular signalling pathways. Nat Rev Mol Cell Biol. 2006;7:589–600. - PubMed
    1. Molkentin JD. Dichotomy of ca2+ in the heart: Contraction versus intracellular signaling. J Clin Invest. 2006;116:623–626. - PMC - PubMed
    1. Hulot JS, Fauconnier J, Ramanujam D, Chaanine A, Aubart F, Sassi Y, Merkle S, Cazorla O, Ouille A, Dupuis M, Hadri L, Jeong D, Muhlstedt S, Schmitt J, Braun A, Benard L, Saliba Y, Laggerbauer B, Nieswandt B, Lacampagne A, Hajjar RJ, Lompre AM, Engelhardt S. Critical role for stromal interaction molecule 1 in cardiac hypertrophy. Circulation. 2011;124:796–805. - PMC - PubMed
    1. Correll RN, Goonasekera SA, van Berlo JH, Burr AR, Accornero F, Zhang H, Makarewich CA, York AJ, Sargent MA, Chen X, Houser SR, Molkentin JD. Stim1 elevation in the heart results in aberrant ca(2+) handling and cardiomyopathy. J Mol Cell Cardiol. 2015;87:38–47. - PMC - PubMed

Publication types

MeSH terms

Substances