

Cerebrospinal fluid analysis detects cerebral amyloid-β accumulation earlier than positron emission tomography
- PMID: 26936941
- PMCID: PMC4806222
- DOI: 10.1093/brain/aww015
Cerebrospinal fluid analysis detects cerebral amyloid-β accumulation earlier than positron emission tomography
Abstract
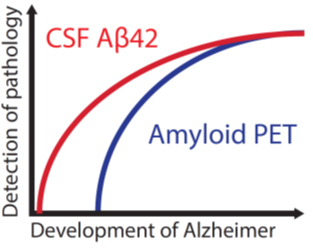
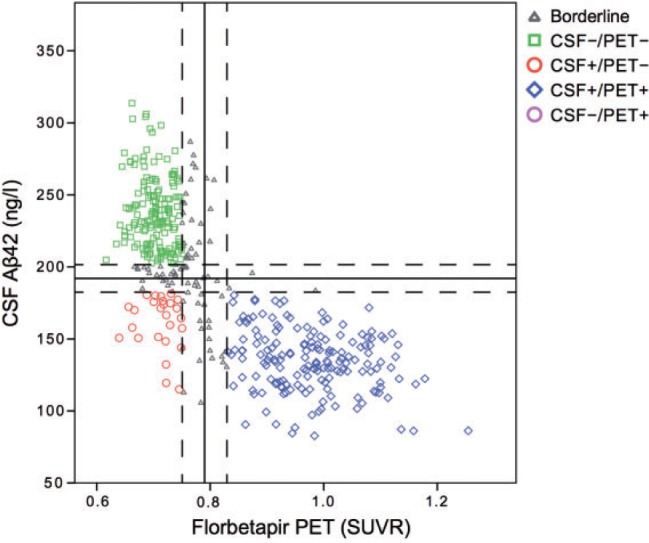
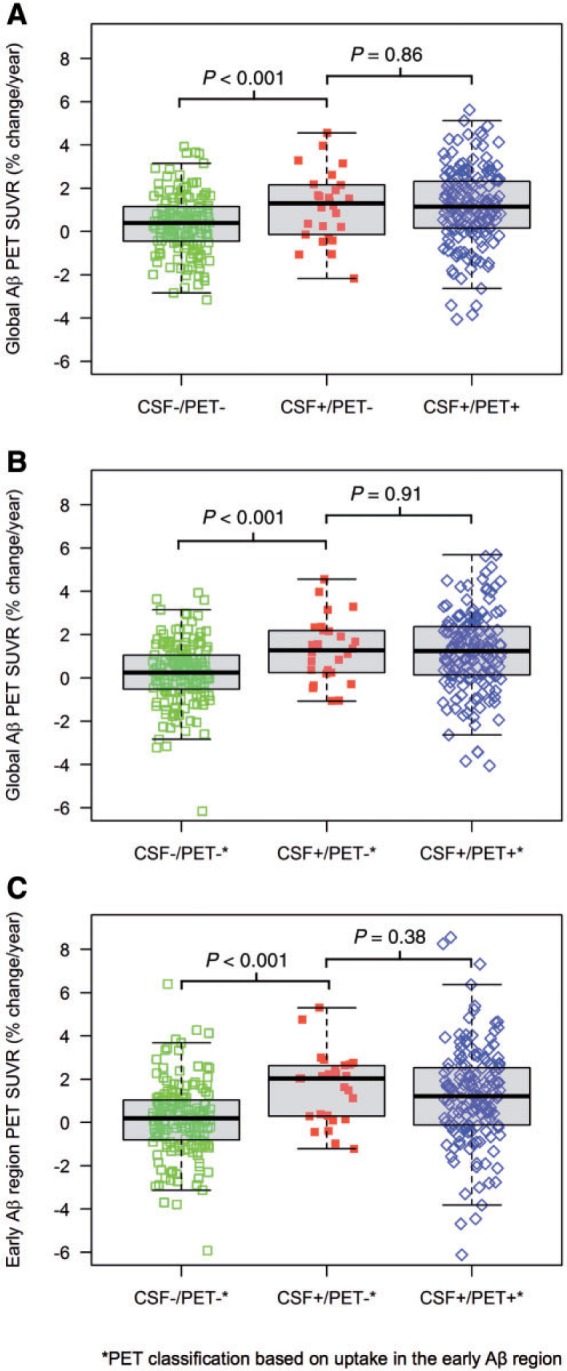
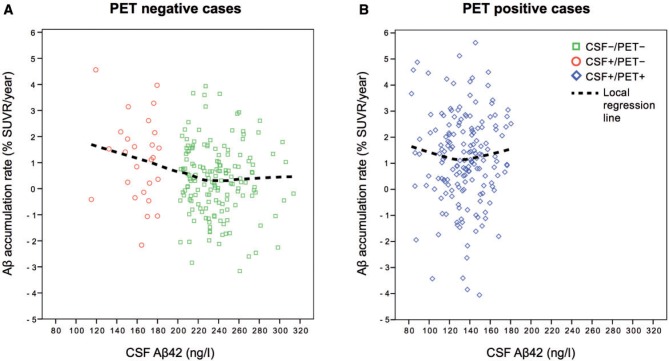
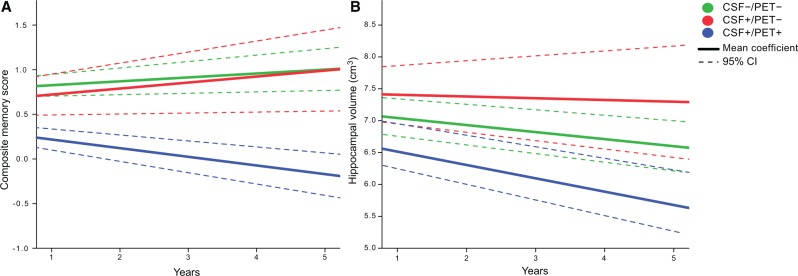
Cerebral accumulation of amyloid-β is thought to be the starting mechanism in Alzheimer's disease. Amyloid-β can be detected by analysis of cerebrospinal fluid amyloid-β42 or amyloid positron emission tomography, but it is unknown if any of the methods can identify an abnormal amyloid accumulation prior to the other. Our aim was to determine whether cerebrospinal fluid amyloid-β42 change before amyloid PET during preclinical stages of Alzheimer's disease. We included 437 non-demented subjects from the prospective, longitudinal Alzheimer's Disease Neuroimaging Initiative (ADNI) study. All underwent (18)F-florbetapir positron emission tomography and cerebrospinal fluid amyloid-β42 analysis at baseline and at least one additional positron emission tomography after a mean follow-up of 2.1 years (range 1.1-4.4 years). Group classifications were based on normal and abnormal cerebrospinal fluid and positron emission tomography results at baseline. We found that cases with isolated abnormal cerebrospinal fluid amyloid-β and normal positron emission tomography at baseline accumulated amyloid with a mean rate of 1.2%/year, which was similar to the rate in cases with both abnormal cerebrospinal fluid and positron emission tomography (1.2%/year, P = 0.86). The mean accumulation rate of those with isolated abnormal cerebrospinal fluid was more than three times that of those with both normal cerebrospinal fluid and positron emission tomography (0.35%/year, P = 0.018). The group differences were similar when analysing yearly change in standardized uptake value ratio of florbetapir instead of percentage change. Those with both abnormal cerebrospinal fluid and positron emission tomography deteriorated more in memory and hippocampal volume compared with the other groups (P < 0.001), indicating that they were closer to Alzheimer's disease dementia. The results were replicated after adjustments of different factors and when using different cut-offs for amyloid-β abnormality including a positron emission tomography classification based on the florbetapir uptake in regions where the initial amyloid-β accumulation occurs in Alzheimer's disease. This is the first study to show that individuals who have abnormal cerebrospinal amyloid-β42 but normal amyloid-β positron emission tomography have an increased cortical amyloid-β accumulation rate similar to those with both abnormal cerebrospinal fluid and positron emission tomography and higher rate than subjects where both modalities are normal. The results indicate that cerebrospinal fluid amyloid-β42 becomes abnormal in the earliest stages of Alzheimer's disease, before amyloid positron emission tomography and before neurodegeneration starts.
Keywords: Alzheimer’s disease; CSF Aβ42; PET; amyloid-β; florbetapir.
© The Author (2016). Published by Oxford University Press on behalf of the Guarantors of Brain.
Figures
Comment in
-
Amyloid biomarkers: pushing the limits of early detection.Brain. 2016 Apr;139(Pt 4):1008-10. doi: 10.1093/brain/aww025. Brain. 2016. PMID: 27012491 Free PMC article.
-
Reply: Do we still need positron emission tomography for early Alzheimer's disease diagnosis?Brain. 2016 Nov 1;139(11):e61. doi: 10.1093/brain/aww169. Brain. 2016. PMID: 27383527 No abstract available.
-
Do we still need positron emission tomography for early Alzheimer's disease diagnosis?Brain. 2016 Nov 1;139(11):e60. doi: 10.1093/brain/aww168. Brain. 2016. PMID: 27383528 No abstract available.
References
-
- Albert MS, DeKosky ST, Dickson D, Dubois B, Feldman HH, Fox NC , et al. . The diagnosis of mild cognitive impairment due to Alzheimer's disease: recommendations from the National Institute on Aging-Alzheimer's Association workgroups on diagnostic guidelines for Alzheimer's disease . Alzheimers Dement 2011. ; 7 : 270 – 9 . - PMC - PubMed
-
- Benaglia T, Chauveau D, Hunter DR, Young D . mixtools: an R package for analyzing finite mixture models . J Stat Softw 2009. ; 32 : 1 – 29 .
-
- Biogen . A Randomized, Blinded, Placebo-Controlled Single Ascending Dose Study of the Safety, Tolerability, and Pharmacokinetics of BIIB037 in Subjects with Mild to Moderate Alzheimer's Disease. In: AD/PD International Conference, Nice, France, 2015. .
-
- Braak H, Braak E . Neuropathological stageing of Alzheimer-related changes . Acta Neuropathol 1991. ; 82 : 239 – 59 . - PubMed
Publication types
MeSH terms
Substances
Grants and funding
LinkOut - more resources
Full Text Sources
Other Literature Sources
Medical
