. 2016 Jun 1;115(6):3162-73.
doi: 10.1152/jn.00935.2015. Epub 2016 Mar 2.

Similar prevalence and magnitude of auditory-evoked and visually evoked activity in the frontal eye fields: implications for multisensory motor control

Affiliations

Similar prevalence and magnitude of auditory-evoked and visually evoked activity in the frontal eye fields: implications for multisensory motor control

Valeria C Caruso et al. J Neurophysiol. .

Abstract

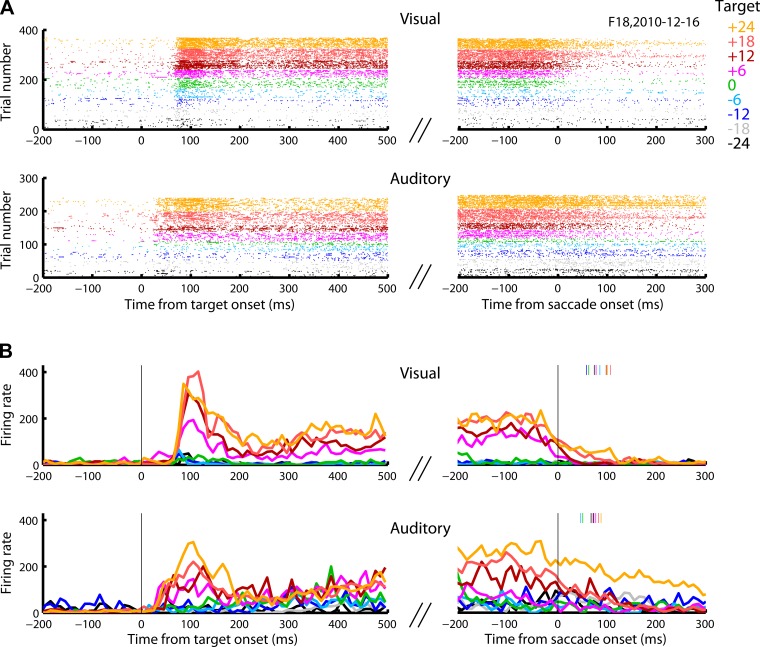
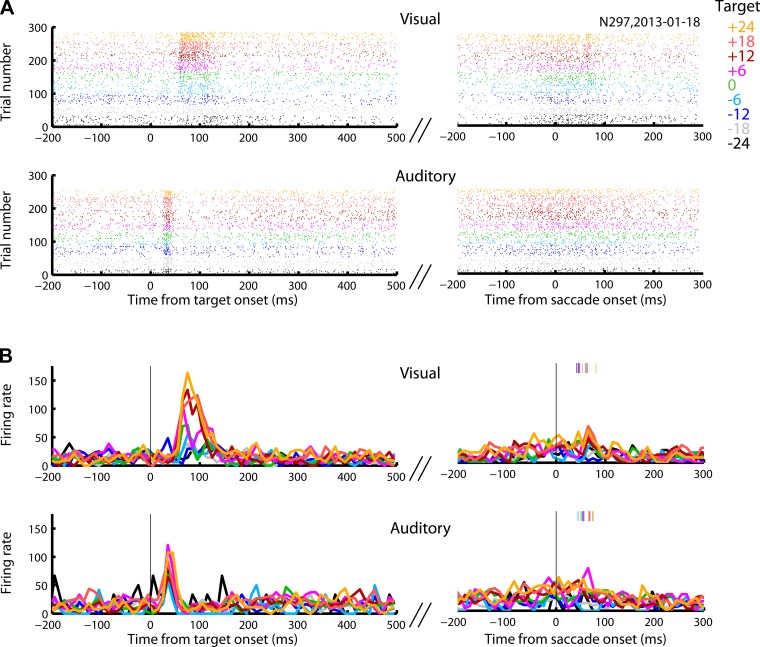
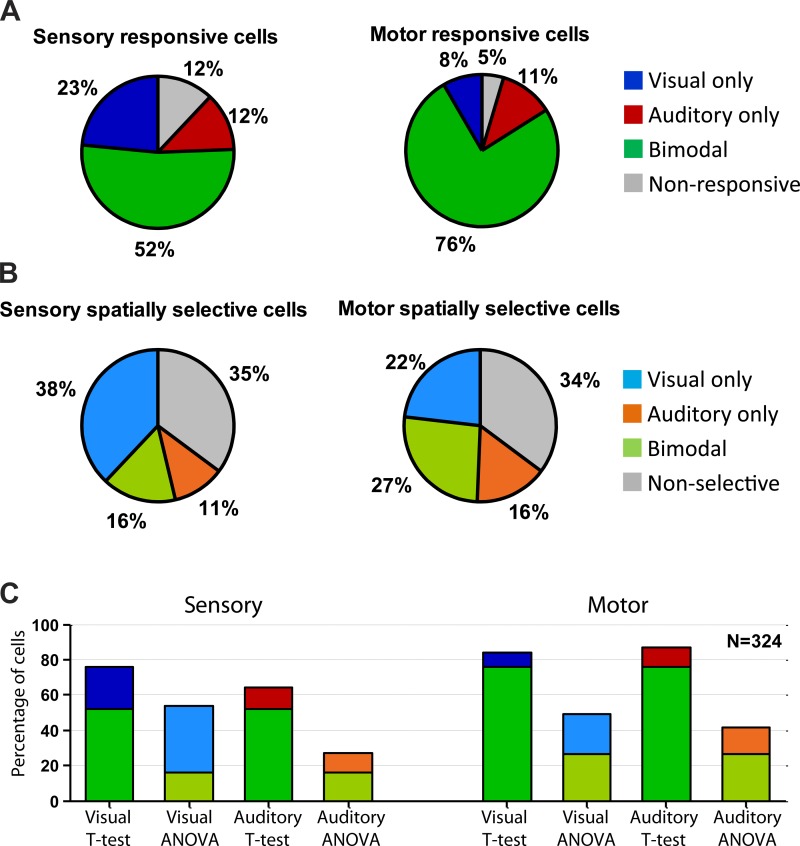
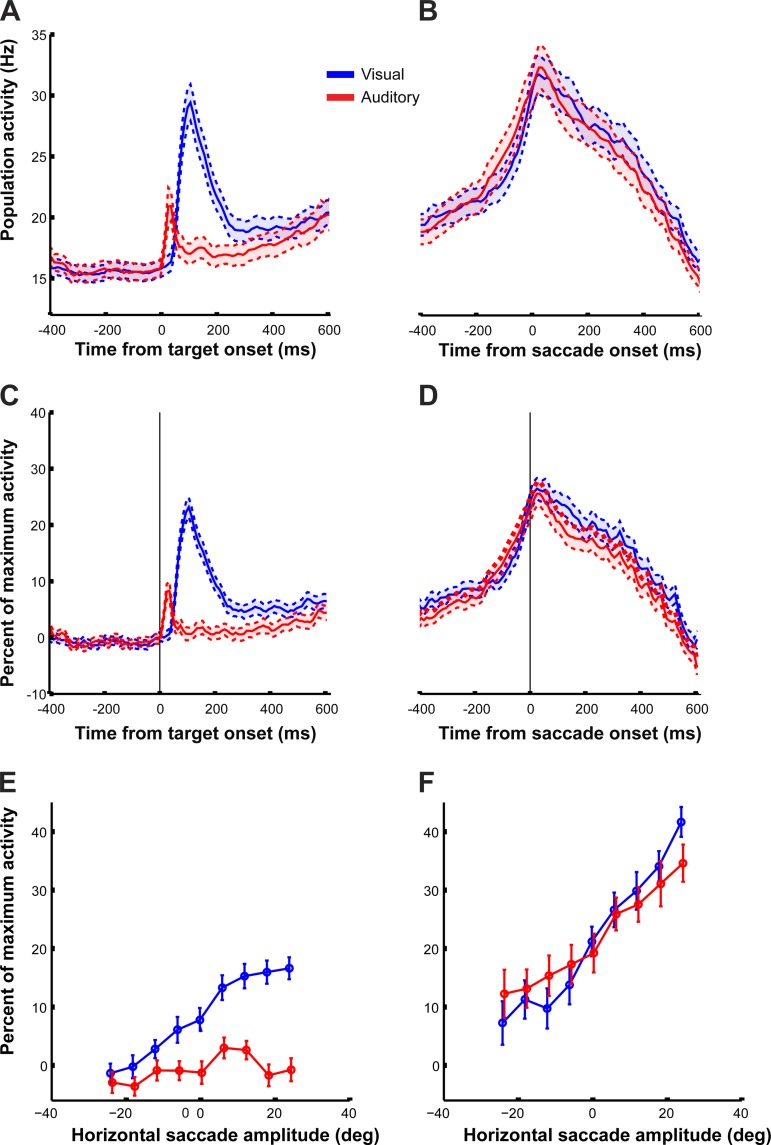
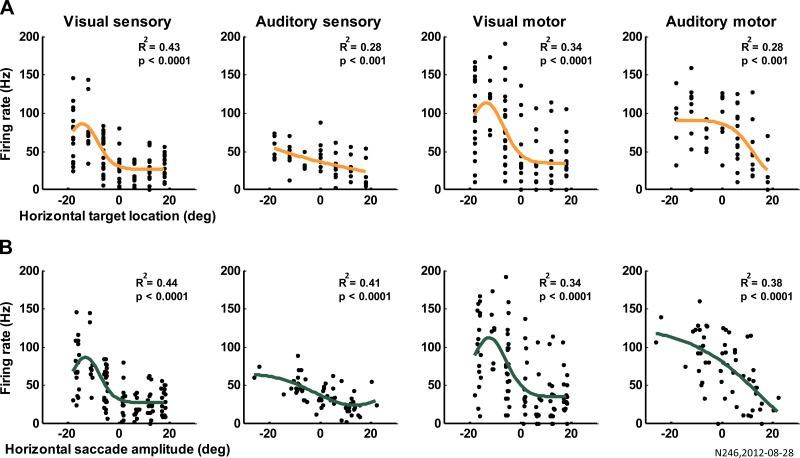
Saccadic eye movements can be elicited by more than one type of sensory stimulus. This implies substantial transformations of signals originating in different sense organs as they reach a common motor output pathway. In this study, we compared the prevalence and magnitude of auditory- and visually evoked activity in a structure implicated in oculomotor processing, the primate frontal eye fields (FEF). We recorded from 324 single neurons while 2 monkeys performed delayed saccades to visual or auditory targets. We found that 64% of FEF neurons were active on presentation of auditory targets and 87% were active during auditory-guided saccades, compared with 75 and 84% for visual targets and saccades. As saccade onset approached, the average level of population activity in the FEF became indistinguishable on visual and auditory trials. FEF activity was better correlated with the movement vector than with the target location for both modalities. In summary, the large proportion of auditory-responsive neurons in the FEF, the similarity between visual and auditory activity levels at the time of the saccade, and the strong correlation between the activity and the saccade vector suggest that auditory signals undergo tailoring to match roughly the strength of visual signals present in the FEF, facilitating accessing of a common motor output pathway.

Keywords: auditory; frontal eye field (FEF); multisensory; saccade.


Figures

Fig. 1.
Fig. 1.
Experimental paradigm. A: an MRI image of the grid and electrode placement on the right FEF of monkey N. SAR, superior arcuate sulcus; IAR, inferior arcuate sulcus. B: location of visual and auditory stimuli. deg, Degrees. C: overlap saccade task. The visual or auditory target was presented while the monkey's gaze was directed toward an initial fixation light. After an overlap time of 600–900 ms, the fixation light was turned off and the monkey initiated a saccade toward the target. The row of fixation lights could be either above or below the row of saccade targets to facilitate placement of the latter in the receptive fields of FEF neurons.
Fig. 2.
Fig. 2.
Saccade accuracy and velocity. A–E: examples of trajectories of visual (blue) and auditory (red) saccades to the same target locations. The black rectangles indicate the area within which a saccade was considered correct. In the low left corners is the session from which the examples were taken (N, monkey N; F, monkey F). F–J: velocity profiles of the saccades above. K: horizontal saccade accuracy (mean ± SD) for monkey F (left) and for monkey N (right). All saccades attempted within 500 ms from the go cue are included (correct and incorrect). Data pooled from all recording sessions in which eye position was sampled with a scleral search coil and the auditory data are slightly displaced along the x-axis for visualization purposes. L: vertical saccade accuracy as a function of target horizontal location (vertical location of targets did not vary). The inset shows the average vertical saccade endpoint (mean ± SD) for the 2 monkeys combined. All other details as in K. M: average auditory peak velocity as a proportion of the average visual peak velocity for the corresponding saccade amplitude range (mean ± SD, bin size = 4°). Data pooled from all recording sessions involving scleral search coil and both monkeys.
Fig. 3.
Fig. 3.
Raster plot and perievent time histogram (PETH) of an example cell. This cell responded vigorously to the onset of contralateral visual and auditory targets. The activity persisted in time until a saccade was made. A: raster plots for visual and auditory trials aligned to the target and the saccade onset. B: PETH for visual and auditory trials aligned to the target and the saccade onset. PETH were obtained by averaging the number of action potentials within running bins of 10 ms aligned to the target onset or saccade onset [smoothed using a half-triangular filter (2/3, 1/3). The points were attributed to the time of the value receiving the 2/3 weight]. Colors indicate horizontal target locations. The colored tick marks in B indicate the average saccade offset for each target location.
Fig. 4.
Fig. 4.
Raster plot and perievent time histogram (PETH) of an example cell. This cell responded to the onset of visual and auditory targets and weakly during the saccade toward the visual targets. The response to auditory target onset was briefer, faster, and less spatially selective than the response to a visual target onset. The motor burst in the visual modality was weaker than the sensory response. A and B like in Fig. 3.
Fig. 5.
Fig. 5.
Raster plot and perievent time histogram (PETH) of an example cell. This cell was activated transiently by the onset of visual targets and more strongly by the saccades to them. In the auditory modality, the response to sound onset was much smaller, but the activity during auditory saccades was comparable with that displayed on visual saccades. A and B like in Fig. 3.
Fig. 6.
Fig. 6.
Proportions of responsive and spatially selective cells. A: responsiveness to visual and/or auditory targets was statistically assessed using a 2-tailed t-test comparing the activity in the sensory (left) and motor (right) periods with baseline (P < 0.05). B: spatial selectivity was assessed with an analysis of variance (ANOVA) for the sensory (left) and motor (right) periods. Details of these tests are also provided in Table 1. C: the proportions of significantly responsive neurons were generally higher when using the t-test than using the ANOVA.
Fig. 7.
Fig. 7.
Average population activity of all neurons (324) recorded in the 2 monkeys as a function of time and horizontal target location. A: average perievent time histogram (PETH; mean ± SE) across all cells recorded for visual (blue) and auditory (red) responses aligned to the target onset. Bin size = 10 ms, no smoothing. Only trials starting from the central fixation were included. B: same as A but with traces aligned to saccade onset. C and D: same as A and B but with normalized activity (for each cell, the normalization consisted in subtracting the average baseline activity and dividing by the maximum activity level for each cell; see materials and methods). E: normalized population activity (mean ± SE) for each target during the 500-ms sensory period (see materials and methods). Only correct trials are included. Same color convention and trials inclusions as A. Auditory data are displaced slightly along the x-axis for visualization purposes. F: same as E but for the activity during the motor period.
Fig. 8.
Fig. 8.
Example of Gaussian fits. The activity of 1 example cell is modeled as a Gaussian function of horizontal target locations (A) and horizontal saccade amplitude (B). From left to right, the activity was computed as firing rate in the sensory and motor windows for visual and auditory trials as indicated above the panels. R2 and the P value for the individual goodness of fit are reported.
Fig. 9.
Fig. 9.
Response variability and saccade variability. Mean ± standard error coefficients of determination of the Gaussian fits of sensory and motor neural activity vs. horizontal target location (target) and horizontal saccade amplitude (saccade). *Significant comparisons; P values are in the main text.

References

    1. Alvarado JC, Stanford TR, Rowland BA, Vaughan JW, Stein BE. Multisensory integration in the superior colliculus requires synergy among corticocollicular inputs. J Neurosci 29: 6580–6592, 2009. - PMC - PubMed
    1. Alvarado JC, Stanford TR, Vaughan JW, Stein BE. Cortex mediates multisensory but not unisensory integration in superior colliculus. J Neurosci 27: 12775–12786, 2007. - PMC - PubMed
    1. Bahill AT, Clark MR, Stark L. The main sequence, a tool for studying human eye movements. Math Biosci 24: 191–204, 1975.
    1. Britten KH, Newsome WT, Shadlen MN, Celebrini S, Movshon JA. A relationship between behavioral choice and the visual responses of neurons in macaque MT. Vis Neurosci 13: 87–100, 1996. - PubMed
    1. Brown JW, Hanes DP, Schall JD, Stuphorn V. Relation of frontal eye field activity to saccade initiation during a countermanding task. Exp Brain Res 190: 135–151, 2008. - PMC - PubMed

Publication types

LinkOut - more resources