. 2016 Mar 2;36(9):2646-62.
doi: 10.1523/JNEUROSCI.4000-15.2016.

Interneurons Differentially Contribute to Spontaneous Network Activity in the Developing Hippocampus Dependent on Their Embryonic Lineage

Affiliations

Interneurons Differentially Contribute to Spontaneous Network Activity in the Developing Hippocampus Dependent on Their Embryonic Lineage

Jason C Wester et al. J Neurosci. .

Abstract

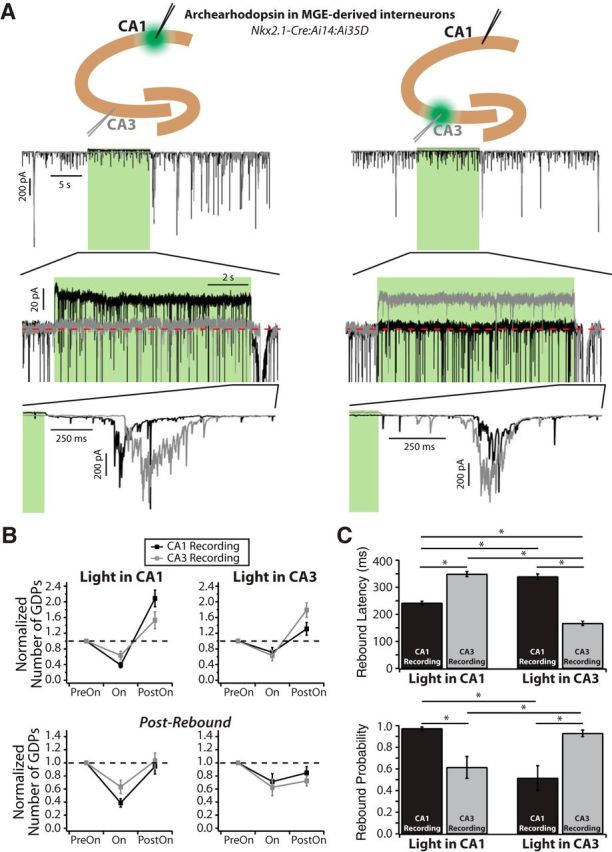
Spontaneously generated network activity is a hallmark of developing neural circuits, and plays an important role in the formation of synaptic connections. In the rodent hippocampus, this activity is observed in vitro as giant depolarizing potentials (GDPs) during the first postnatal week. Interneurons importantly contribute to GDPs, due to the depolarizing actions of GABA early in development. While they are highly diverse, cortical interneurons can be segregated into two distinct groups based on their embryonic lineage from either the medial or caudal ganglionic eminences (MGE and CGE). There is evidence suggesting CGE-derived interneurons are important for GDP generation; however, their contribution relative to those from the MGE has never been directly tested. Here, we optogenetically inhibited either MGE- or CGE-derived interneurons in a region-specific manner in mouse neonatal hippocampus in vitro. In CA1, where interneurons are the primary source of recurrent excitation, we found that those from the MGE strongly and preferentially contributed to GDP generation. Furthermore, in dual whole-cell patch recordings in neonatal CA1, MGE interneurons formed synaptic connections to and from neighboring pyramidal cells at a much higher rate than those from the CGE. These MGE interneurons were commonly perisomatic targeting, in contrast to those from the CGE, which were dendrite targeting. Finally, inhibiting MGE interneurons in CA1 suppressed GDPs in CA3 and vice versa; conversely, they could also trigger GDPs in CA1 that propagated to CA3 and vice versa. Our data demonstrate a key role for MGE-derived interneurons in both generating and coordinating GDPs across the hippocampus.

Significance statement: During nervous system development, immature circuits internally generate rhythmic patterns of electrical activity that promote the establishment of synaptic connections. Immature interneurons are excitatory rather than inhibitory and actively contribute to the generation of these spontaneous network events, referred to as giant depolarizing potentials (GDPs) in the hippocampus. Interneurons can be generally separated into two distinct groups based on their origin in the embryo from the medial or caudal ganglionic eminences (MGE and CGE). Here we show that MGE interneurons play a dominant role in generating GDPs compared with their CGE counterparts. They accomplish this due to their high synaptic connectivity within the local circuitry. Finally, they can control network activity across large regions of the developing hippocampus.

Keywords: giant depolarizing potential; hippocampus; interneurons.


Figures

Figure 1.
Figure 1.
Characterization of GDPs and region-specific optogenetic control of interneurons with archearhodpsin. A, Simultaneous whole-cell voltage-clamp recordings of interneurons in CA1 (black trace) and CA3 (gray trace) at postnatal day 6 (p6). Spontaneous GDPs (observed as large inward currents) co-occurred in both regions; however, the relative timing between events was variable, with some recorded first in CA3 (expanded, left) and others in CA1 (expanded, right). Holding potential = −70 mV; ECl− = −27 mV. B, Left, Breakdown of spontaneous GDPs recorded simultaneously in CA3 and CA1. GDPs were considered to be independent to a region (e.g., CA3) if no corresponding GPD occurred within 500 ms in the other region (e.g., CA1) (n = 14 slices; n = 149 CA3 GDPs, n = 150 CA1 GDPs). Right, When GDPs occurred synchronously in CA3 and CA1, the time difference between events was ∼100 ms regardless of which was recorded first. C, Simultaneous whole-cell patch recordings of MGE-derived interneurons in CA1 (black trace) and CA3 (gray trace) expressing Arch at p5. Diagrams (top) represent the locations of the recordings and focus of the light (green) to activate Arch. Light stimulus in CA1 (left) induced an outward current and membrane hyperpolarization in that region, with little to no effect in CA3. Conversely, light stimulus in CA3 (right) induced an outward current and membrane hyperpolarization in that region, with little to no effect in CA1. Voltage-clamp (top traces) holding potential = −70 mV; current-clamp recordings (bottom traces) biased to −70 mV with holding current. Currents and action potentials are clipped to highlight Arch-mediated currents and hyperpolarization, respectively. Green bar represents light stimulus. Dashed red line indicates baseline current and voltage. D, Left, Average Arch currents recorded simultaneously in CA3 and CA1 were dependent on the light stimulus location (n = 12 slices). *p < 0.001 (Tukey post hoc test). Right, Arch currents were evoked with similar efficacy in interneurons derived from the MGE and CGE and no current was evoked in PCs (n = 12 slices/cells for each condition). E, Chloride-mediated currents dominate GDPs in isolated CA1. Ei, Experimental configuration: CA1 and CA3 were separated by a cut; in CA1, two neighboring PCs were recorded simultaneously with ECl− = −27 mV (gray traces) or −67 mV (black traces) using two different intracellular solutions. Eii, PCs were voltage-clamped at −70 mV. Only small transient inward currents (red arrow) and depolarization are observed during GDPs when cells are held near ECl−. Black traces, ECl− = −67 mV. Gray traces, ECl− = −27 mV. Eiii, When voltage-clamped between ECl− and Eglutamate (holding potentials: −70, −50, −40, and −30 mV; black traces), outward GABAergic chloride currents dominate, but small inward glutamatergic currents are still observed (red arrows). In Slice 1 (left), inward currents are observed at GDP onset; however, this phenomenon was not observed consistently, as shown in Slice 2 (right). Black traces, ECl− = −67 mV. Gray traces, ECl− = −27 mV.
Figure 2.
Figure 2.
Arch-mediated inhibition of MGE-derived interneurons greatly suppresses spontaneous GDPs and generates rebound GDPs in CA1. A, Recording configuration with focus of yellow-green light stimulus in CA1 to inhibit MGE-derived interneurons. B, Example of simultaneous recordings in an MGE-derived interneuron (gray) and a neighboring pyramidal cell (PC) (black) with a 10 s light stimulus (green). Activation of the Arch-current greatly reduced the frequency of spontaneous GDPs in both cells, which returned once the light was turned off. Gray bar represents region expanded in C. C, A noninactivating outward current is induced for the duration of the light stimulus (10 s, green) in an Arch-expressing MGE-derived interneuron but not a neighboring PC. Dashed red line indicates baseline current. Gray bar represents region expanded in E. D, Second example slice demonstrating the effect Arch stimulation over multiple overlaid trials (n = 8) in a PC. Note triggered rebound GDPs immediately after the end of the light stimulus (red arrow). E, Turning off the light stimulus (green) reliably triggered a rebound GDP within ∼200 ms. In this example, a barrage of PSCs was observed in the PC immediately after the end of the light stimulus and preceding the rebound GDPs (inset). Currents recorded in the interneuron (gray) are glutamatergic only (ECl− = −67 mV), whereas those in the PC (black) are a mix of both GABA- and glutamate-mediated events (ECl− = −27 mV). Voltage-clamp holding potential = −70 mV for both cells. Ten overlaid trials are shown. F, Total number of GDPs (top) and normalized number of GDPs (bottom) during PreOn, On, and PostOn 10 s time bins (n = 13 slices). At right (PostRebound), the PostOn time bin is 3 s after the end of the light stimulus to exclude triggered rebound GDPs. Gray represents individual experiments. Black represents population average. Total number (top): *p < 0.01 (Tukey post hoc test). #p < 0.05 (Tukey post hoc test). Normalized data (bottom): *p < 0.001 (Student's t test). G, Average (top) and normalized (bottom) GDP charge transfer during the time bins described in F and during rebound GDPs. The light stimulus reduces GDP charge transfer during the On period in some slices (9 of 13) and increases during rebounds (9 of 13) but not consistently across the population. Black represents population mean from pooled data (top). Gray represents mean charge transfer from individual experiments.
Figure 3.
Figure 3.
Arch-mediated inhibition of CGE-derived interneurons only moderately suppresses spontaneous GDPs and rarely triggers rebound GDPs in CA1. A, Example recording in a PC with a 10 s light stimulus (green). Activation of the Arch current did little to suppress the frequency of spontaneous GDPs. Ten overlaid trials are shown. B, Expanded region from the slice in A, showing both the PC (black) and a neighboring interneuron (gray). Turning off the light (green) does not trigger rebound GDPs when Arch is expressed in CGE-derived interneurons. Red arrows indicate that individual PSCs, but not triggered GDPs, were observed ∼200 ms after the light was turned off in both the interneuron and PC. Red arrowheads indicate a GDP that occurs >500 ms after the light stimulus and is a spontaneous event. C, Second example recording from a PC demonstrating the modest effect of the Arch stimulus on GDP frequency (11 overlaid trials are shown). D, In the majority of slices (8 of 11), turning off the light (green) induced a brief increase in network excitability after >600 ms. Red arrow indicates temporally correlated GDPs that occurred across multiple trials (10 overlaid trials; same experiment from C). E, Total (top) and normalized (bottom) number of GDPs during the time bins described in Figure 2F (n = 11 slices). The light stimulus caused a slight reduction in the number of GDPs, which approached significance across the population in the normalized data (p = 0.05, Student's t test). Total number (top): *p < 0.001 (Tukey post hoc test). #p < 0.05 (Tukey post hoc test). Normalized data (bottom): *p < 0.01 (Student's t test). F, Average (top) and normalized (bottom) GDP charge transfer during the time bins described in E and rebound GDPs. The charge transfer during rebound GDPs was significantly greater than during the PreOn period in the raw data but not when normalized. No other differences were significant (n = 11 slices).
Figure 4.
Figure 4.
Inhibiting MGE-derived interneurons most strongly suppresses GDPs, likely due to their high rates of recurrent connectivity with local pyramidal cells. A, Comparison of the normalized number of GDPs when MGE-derived (black) or CGE-derived (red) interneurons are inhibited with Arch. GDPs were significantly more reduced when MGE-derived interneurons were inhibited. However, both exhibited a comparable increase in GDPs above baseline immediately following the light stimulus (left), which returned to control levels after 3 s (right, PostRebound). *p < 0.01 (Mann–Whitney U test). B, Left, Probability of observing a GDP within 500 ms of the end of the light stimulus. Right, Average latency of GDPs recorded within 500 ms of the end of the light stimulus. *p < 0.01 (Mann–Whitney U test). C, Synaptic connections were tested between interneurons and PCs in CA1 with dual whole-cell patch recordings. Shown are probabilities for finding interneuron-to-PC, PC-to interneuron, and reciprocal connections in both neonates and juveniles. Data for CGE-derived interneurons (red) follow the same order as for MGE-derived (represented in diagrams).
Figure 5.
Figure 5.
Neonatal MGE-derived interneurons are often perisomatic targeting, and their synaptic connections with PCs are mature in many respects. A, Top, Neurolucida tracing of an MGE-derived interneuron at p7. Red represents axon. Black represents soma and dendrites. The axon is largely confined to the stratum pyramidale, indicating that this cell is perisomatic targeting. S.O., Stratum oriens; S.P., stratum pyramidale; S.R., stratum radiatum. Bottom, Current pulses (160 and 240 pA) evoked firing responses that indicate an immature fast-spiking cell. Note delay to spike onset (top) and large after-hyperpolarization of the spike in the inset. B, Synaptic connections with a neighboring PC made to and from the same cell shown in A. Postsynaptic responses (gray) were recorded in voltage clamp with a holding potential of −70 mV; GABA(A) currents were inward due to a set ECl− of 0 mV in PCs. Left, Interneuron-to-PC postsynaptic responses evoked by a train of presynaptic spikes (25 at 50 Hz, top). Multiple overlaid trials are shown for the first and last spike of the train. Black traces represent presynaptic spike. Gray traces represent successful evoked vesicle release. Red traces represent release failure. The first spike evoked IPSCs with higher reliability and larger amplitudes than the last spike. Right, The PC-to-interneuron connection demonstrates similar synaptic properties, but note the faster decay time constant of the EPSC compared with IPSC at left. C, Neurolucida tracings of example neonatal (p5–p7) MGE-derived interneurons found to send and receive synaptic connections with neighboring PCs in paired whole-cell recordings. Ci, Interneurons found to provide a synaptic connection to a PC. Cii, A putative OLM cell that received input from a PC. Ciii, Interneurons that were reciprocally connected with a PC. In the majority of cases, the axon targets the stratum pyramidale, indicating perisomatic connections. Black represents cell body and dendrites. Red represents axon. D, Comparison of interneuron-to-PC synaptic connections between neonates (n = 8) and juveniles (n = 7) during trains of presynaptic spikes. All interneurons were classified as perisomatic targeting based on post hoc morphology. Top, Average proportion of failures as a function of spike number. Bottom, Average IPSC potency as a function of spike number. *p < 0.05 (Mann–Whitney U test). E, Comparison of PC-to-interneuron synaptic connections between neonates (n = 4) and juveniles (n = 5) during trains of presynaptic spikes. All neonatal interneurons were classified as perisomatic targeting; juvenile interneurons with depressing synaptic responses were pooled from perisomatic (n = 3) and dendrite targeting (n = 2). Top, Average proportion of failures as a function of spike number. Bottom, Average EPSC potency as a function of spike number. *p < 0.05 (Mann–Whitney U test).
Figure 6.
Figure 6.
CGE-derived interneurons demonstrate asynchronous transmitter release and are often dendrite targeting. A, Neurolucida reconstruction of a p7 CGE-derived interneuron that provided synaptic input to a neighboring PC in paired whole-cell recordings. Red represents axon. Black represents soma and dendrites. The axon is largely confined to the stratum radiatum, indicating that this cell is dendrite targeting. S.O., Stratum oriens; S.P., stratum pyramidale; S.R., stratum radiatum. B, A train of presynaptic spikes (black, 25 at 50 Hz) from the cell shown in A evoked IPSCs (gray) in a neighboring PC (single trial shown). Red represents release rate histograms from multiple overlaid trials (n = 7). Note the appearance of asynchronous vesicle release at the end of the spike train. Postsynaptic responses were recorded in voltage clamp with a holding potential of −70 mV; GABA(A) currents were inward due to a set ECl− of 0 mV in PCs. Release rate histogram units represent instantaneous rate of vesicle release (quanta ms−1). C, Expansion of the data from B for the first and last four spikes in the train. The first four spikes (left) evoke precisely time-locked IPSCs with concomitant synchronous vesicle release observable over multiple trials in the release rate histograms. In contrast, the last four spikes (right) evoke asynchronous vesicle release and IPSCs that are no longer time-locked to the spike. Blue box (S) represents the 5 ms time region used to calculate synchronous release. Orange box (AS) represents the 15 ms time region used to calculate asynchronous release. D, Synchronicity ratio (synchronous/asynchronous) as a function of spike number for the example synaptic connection in B, C. Calculated from the average release rate histogram (n = 7 trials shown in B, C). Dashed gray line indicates a linear fit to the data. Black dashed line at 1. E, Three additional examples of neonatal CGE-to-PC synaptic connections. Neurolucida tracings represent the presynaptic interneuron (axon in red). Ei, Eii, A single trial postsynaptic IPSC (gray) is shown for clarity, but synchronicity ratios were calculated from an average of 10 release rate histograms. Dashed gray line indicates a linear fit to the data. Black dashed line at 1. Eiii, The postsynaptic response is an average of 10 IPSCs and is shown in red. F, Examples of two PC-to-CGE synaptic connections. Neurolucida tracings represent the postsynaptic interneuron (axon in red). For each, a single trial of the full spike train (black) and postsynaptic response (gray) is shown at top. Expanded regions show multiple overlaid trials for the first and last spike in the train. Red traces represent failure to evoke an EPSC. G, Examples of three reconstructed interneurons for which no synaptic connections were found with neighboring PCs (axon in red). The axon largely avoids the stratum pyramidale, similar to the example synaptically connected cells in A–F.
Figure 7.
Figure 7.
Perisomatic targeting CGE-derived interneurons are commonly found in juvenile CA1 with high rates of connectivity to neighboring PCs. A, Left, Neurolucida trace of a p17 CGE-derived basket cell (axon in red). Current pulses indicated that this cell was non–fast-spiking. S.O., Stratum oriens; S.P., stratum pyramidale; S.R., stratum radiatum. Right, Synaptic connection from the cell at left to a neighboring PC. Presynaptic spikes (black) elicited IPSCs that became asynchronous near the end of the train. Expanded region represents transition to asynchronous release. B, Connection probabilities between juvenile CGE-derived interneurons and PCs in CA1. Interneurons were identified as perisomatic or dendrite targeting based on the morphology of recovered cells. Perisomatic targeting cells were common and had a high probability of CGE-to-PC connectivity. C, Same as B, but for juvenile MGE-derived interneurons.
Figure 8.
Figure 8.
Inhibiting MGE-derived interneurons in CA1 modulates GDPs in CA3 and vice versa. A, Simultaneous recordings were made in MGE-derived interneurons in CA1 and CA3 while light was focused on either region. Top, Diagrams represent the recording configuration and locations of the light stimuli. Example recordings in CA1 and CA3 with light focused in each region. Middle, Expanded region demonstrating that Arch currents could be evoked independently in CA1 or CA3 as a function of light stimulus location. Inward currents are clipped to highlight the Arch current. Bottom, Expanded region highlighting that the relative timing of rebound GDPs in CA1 and CA3 depends on the location of the light stimulus. B, Normalized GDP data comparing the effect of light in CA1 versus CA3. Left column, Data collected with the light focused on CA1. Right column, Data collected with the light focused on CA3. Bottom row, The PreOn time bin has been shifted by 3 s to excluded triggered rebound GDPs (PostRebound). C, Data comparing the probability of and latency to triggered GDPs in CA1 and CA3 as a function of light stimulus location. *p < 0.001 (Tukey post hoc test).

References

    1. Ali AB, Thomson AM. Facilitating pyramid to horizontal oriens-alveus interneurone inputs: dual intracellular recordings in slices of rat hippocampus. J Physiol. 1998;507:185–199. doi: 10.1111/j.1469-7793.1998.185bu.x. - DOI - PMC - PubMed
    1. Allène C, Cattani A, Ackman JB, Bonifazi P, Aniksztejn L, Ben-Ari Y, Cossart R. Sequential generation of two distinct synapse-driven network patterns in developing neocortex. J Neurosci. 2008;28:12851–12863. doi: 10.1523/JNEUROSCI.3733-08.2008. - DOI - PMC - PubMed
    1. Allène C, Picardo MA, Becq H, Miyoshi G, Fishell G, Cossart R. Dynamic changes in interneuron morphophysiological properties mark the maturation of hippocampal network activity. J Neurosci. 2012;32:6688–6698. doi: 10.1523/JNEUROSCI.0081-12.2012. - DOI - PMC - PubMed
    1. Aniksztejn L, Demarque M, Morozov Y, Ben-Ari Y, Represa A. Recurrent CA1 collateral axons in developing rat hippocampus. Brain Res. 2001;913:195–200. doi: 10.1016/S0006-8993(01)02817-7. - DOI - PubMed
    1. Banke TG, McBain CJ. GABAergic input onto CA3 hippocampal interneurons remains shunting throughout development. J Neurosci. 2006;26:11720–11725. doi: 10.1523/JNEUROSCI.2887-06.2006. - DOI - PMC - PubMed

Publication types

MeSH terms

LinkOut - more resources