. 2016 Mar 2;36(9):2827-42.
doi: 10.1523/JNEUROSCI.3575-15.2016.

Requirement for Microglia for the Maintenance of Synaptic Function and Integrity in the Mature Retina

Affiliations

Requirement for Microglia for the Maintenance of Synaptic Function and Integrity in the Mature Retina

Xu Wang et al. J Neurosci. .

Abstract

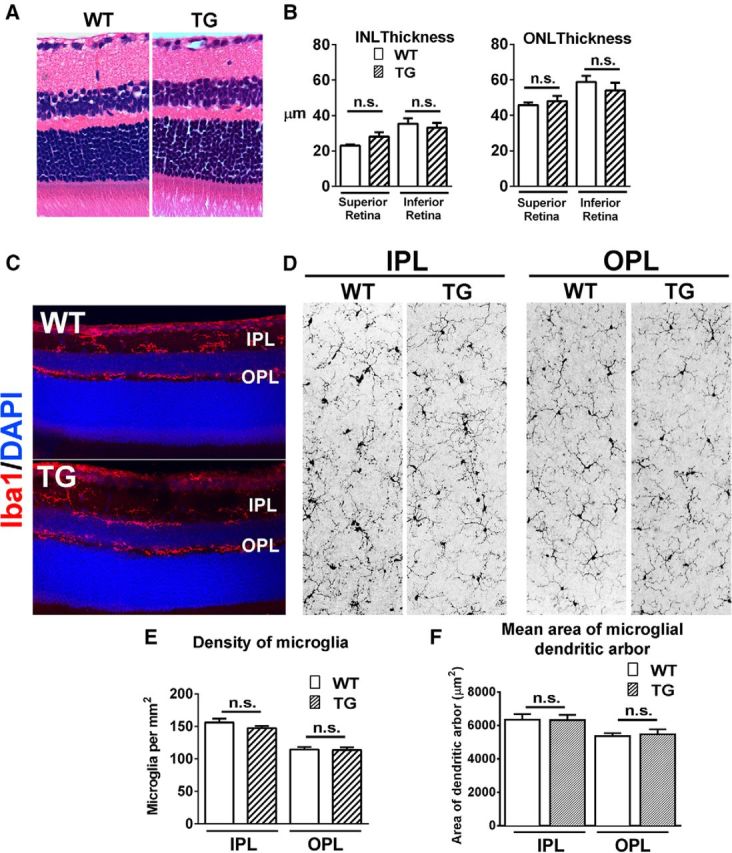
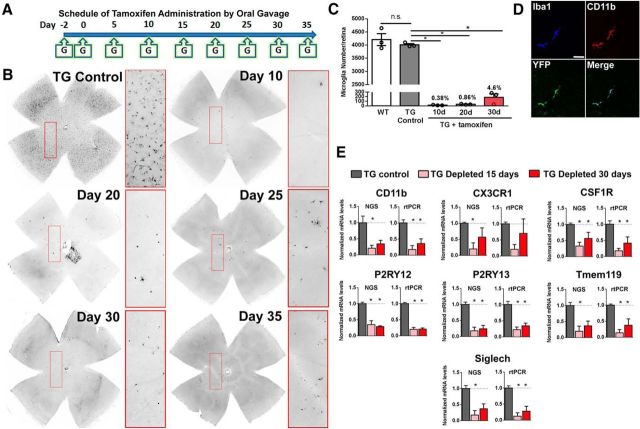
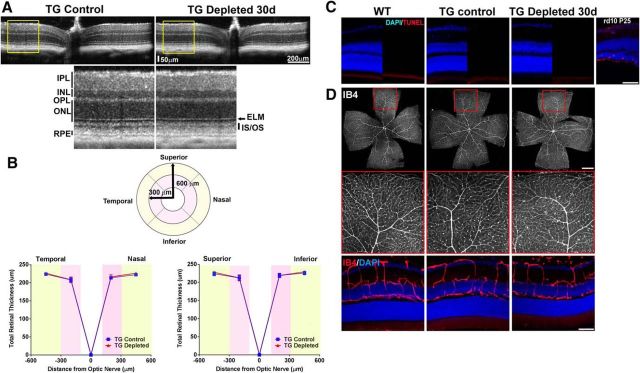
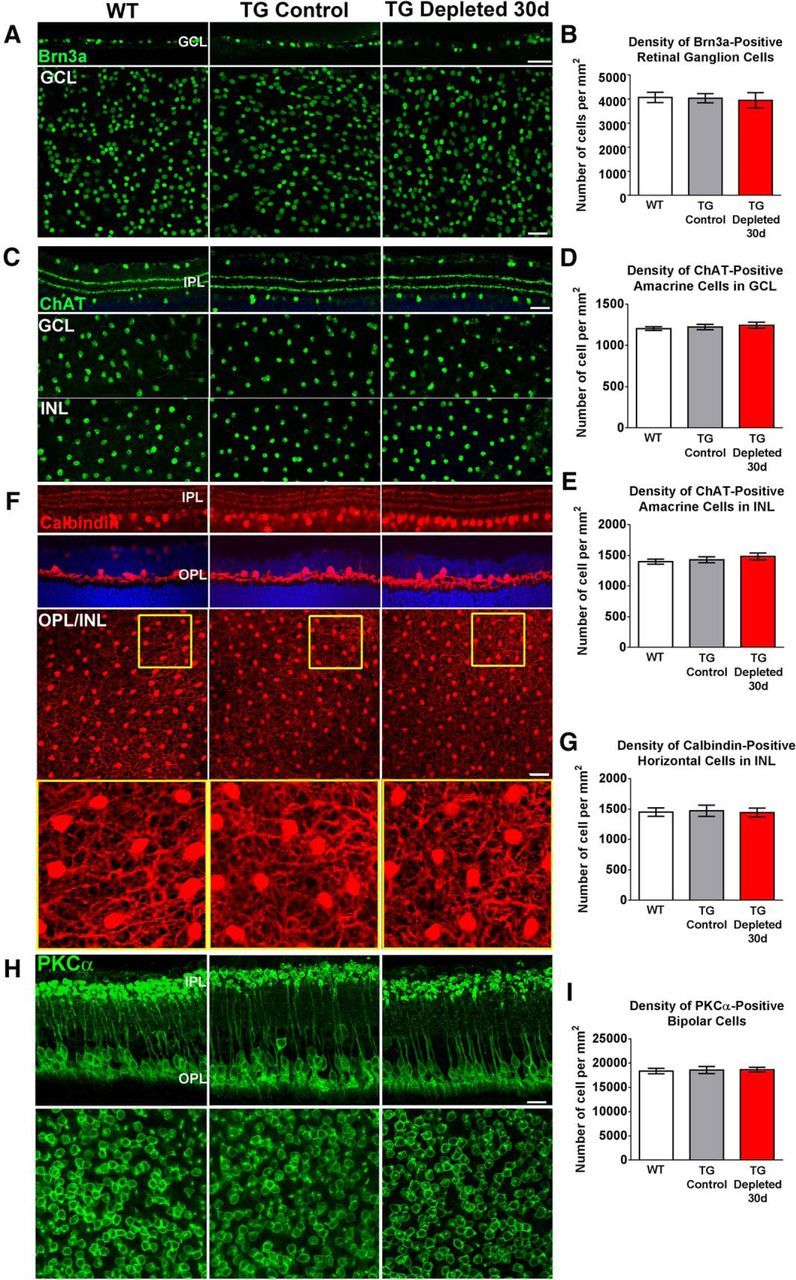
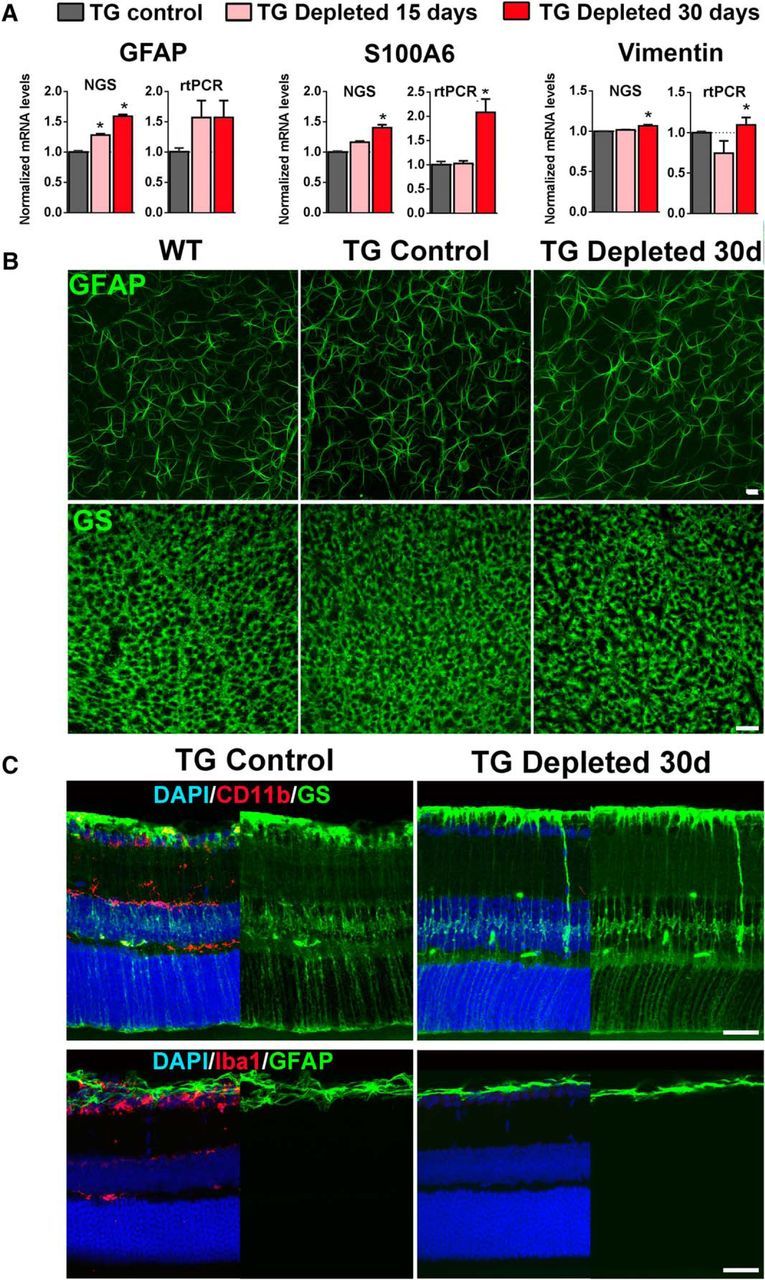
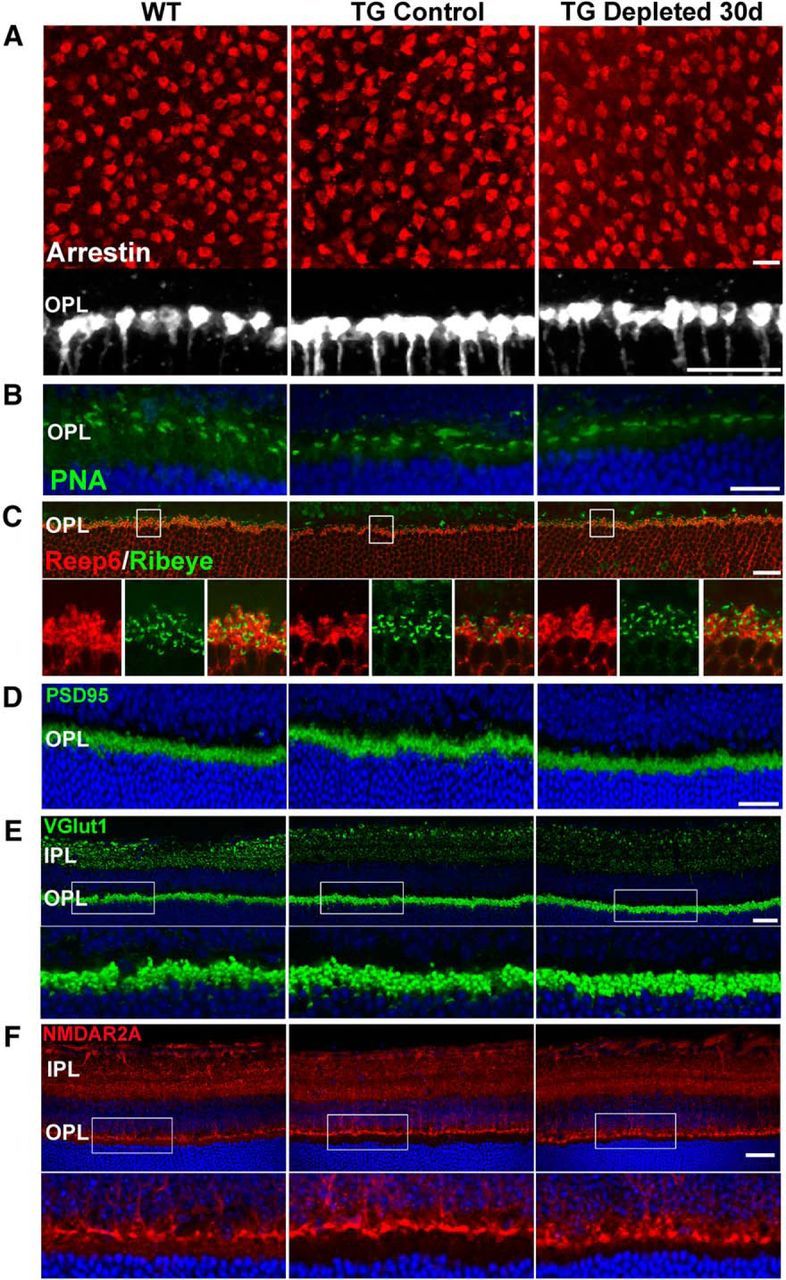
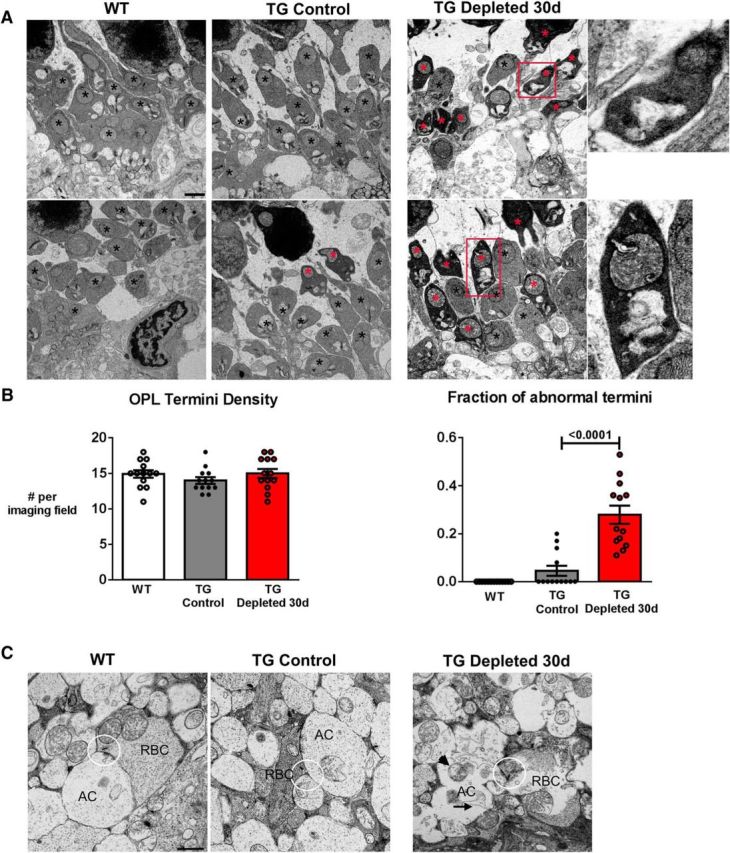
Microglia, the principal resident immune cell of the CNS, exert significant influence on neurons during development and in pathological situations. However, if and how microglia contribute to normal neuronal function in the mature uninjured CNS is not well understood. We used the model of the adult mouse retina, a part of the CNS amenable to structural and functional analysis, to investigate the constitutive role of microglia by depleting microglia from the retina in a sustained manner using genetic methods. We discovered that microglia are not acutely required for the maintenance of adult retinal architecture, the survival of retinal neurons, or the laminar organization of their dendritic and axonal compartments. However, sustained microglial depletion results in the degeneration of photoreceptor synapses in the outer plexiform layer, leading to a progressive functional deterioration in retinal light responses. Our results demonstrate that microglia are constitutively required for the maintenance of synaptic structure in the adult retina and for synaptic transmission underlying normal visual function. Our findings on constitutive microglial function are relevant in understanding microglial contributions to pathology and in the consideration of therapeutic interventions that reduce or perturb constitutive microglial function.

Significance statement: Microglia, the principal resident immune cell population in the CNS, has been implicated in diseases in the brain and retina. However, how they contribute to the everyday function of the CNS is unclear. Using the model of the adult mouse retina, we examined the constitutive role of microglia by depleting microglia from the retina. We found that in the absence of microglia, retinal neurons did not undergo overt cell death or become structurally disorganized in their processes. However, connections between neurons called synapses begin to break down, leading to a decreased ability of the retina to transmit light responses. Our results indicate that retinal microglia contribute constitutively to the maintenance of synapses underlying healthy vision.

Keywords: degeneration; electroretinogram; glia; microglia; retina; synapse.


Figures

Figure 1.
Figure 1.
Adult TG mice demonstrate normal retinal thickness and lamination and normal microglial morphology and distribution. H&E-stained paraffin sections of 2-month-old adult C57BL/6J WT and TG mice, demonstrate similar retinal structure and lamination (A), and have no significant differences in inner nuclear layer (INL) and outer nuclear layer (ONL) thicknesses (B). Microglia in the retina of animals of both genotypes demonstrated a similar laminar distribution of Iba1+ (red) microglia in the IPL and OPL (C). En face inspection of Iba1+ retinal microglia in flat-mounted retina demonstrates similar ramified morphologies in the IPL and OPL layers (D), with similar mean densities in the plexiform layers (E) and similar mean size of individual microglial dendritic arbors. Graphical data are represented as mean ± SEM; data from three female animals in each group in B and E, from four female animals in F. (n.s. indicates comparisons for which p > 0.05, unpaired t test with Welch's correction).
Figure 2.
Figure 2.
Induction of DTA expression in CX3CR1-expressing cells in TG mice results in complete and sustained depletion retinal microglia. A, TAM was administered orally to TG mice to induce CreER-mediated expression of DTA in microglia per the following schedule: two initial doses of TAM 1 d apart (500 mg/kg per oral dose) at Day −2 and Day 0, followed by an equal repeated dose every 5 d (Day 5, Day 10, etc) up to Day 35. B, Flat-mounted retinas from TAM-administered TG mice were immunostained for Iba1 to determine the presence and density of retinal microglia; insets show expanded views in the boxed areas. In control TG mice, which were administered corn oil without TAM (TG Control), retinal microglia were present throughout the retina in the normal distribution. In TAM-administered TG mice, Iba1+ microglia at Day 10 were absent in most retinal areas, with only isolated rare Iba1+ cells detected (inset). Near-complete depletion of retinal microglia was sustained by repeated TAM administration up to Day 35. C, Quantification of total number of retinal microglia indicated that although microglial numbers were similar between WT and TG Control animals, TAM-administered TG animals resulted in sustained and near-complete depletion (>95%) for up to 30 d (data are represented as mean ± SEM; n = 3 female 8-week-old animals at each group; *p < 0.05 on one-way ANOVA with Dunnett's multiple-comparisons test). D, Immunohistochemical localization of microglia performed with antibodies to CD11b (red),EYFP (green), and Iba1 (blue) confirmed microglial depletion across all retinal areas; the panels show a rare residual microglial cell that was typically immunopositive for all three markers. Scale bar, 40 μm. E, mRNA expression levels were assessed using NGS and separately verified by RT-PCR in independent replicates. Comparisons were made between TG mice gavaged with corn oil without TAM (TG Control), and animals depleted of microglia with continuous administration of TAM in corn oil for 15 and 30 d. Levels of microglia-expressed genes were significantly reduced in general, indicating microglial depletion. (Graphical data are represented as mean ± SEM; *indicates comparisons with control for which p < 0.05, one-way ANOVA, n = 3 male, 8-week-old animals per group).
Figure 3.
Figure 3.
Effect of retinal microglial depletion on retinal lamination, cell survival, and vascular structure. A, In vivo OCT assessment demonstrating horizontal linear spectral domain OCT retinal scans of control transgenic mice (TG Control) and transgenic mice following microglial depletion for 30 d (TG-depleted 30 d); insets show magnified view of retinal lamination and thickness. Overall retinal structure was preserved following sustained depletion, with clear definition of all retinal lamina at all retinal loci within the central 1.4 × 1.4 mm imaging field. INL, Inner nuclear layer; ONL, outer nuclear layer; ELM, external limiting membrane; IS/OS, junction between the inner and outer segment of the photoreceptors; RPE, retinal pigment epithelium complex. B, Mean retinal thickness in retinal areas as defined by a circular grid with concentric retinal areas centered on the optic nerve were computed. Mean retinal thickness in areas between 100 and 300 μm radial to the optic nerve (pink areas) and between 300 and 600 μm radial to the optic nerve (yellow areas) were similar between TG Control and TG Depleted, considering all four quadrants (superior, inferior, temporal, and nasal; data are represented as mean ± SEM; n = 12 eyes in 6 female TG Control animals, 16 eyes in 8 TG Depleted female animals; p = 0.18, two-way ANOVA). C, Comparison of DAPI-labeled retinal sections from adult (2- to 3-month-old) female WT C57BL6 mice, control TG mice (TG Control), and TG mice depleted of microglia for 30 d (TG Depleted 30 d) demonstrated no general atrophy of nuclear layers between groups. Retinal cell apoptosis was assessed in retinal sections using a TUNEL assay (red); TUNEL-positive cells were absent in all retinal layers in all experimental groups. Retina sections from a postnatal day (P)25 rd10 mouse retina containing apoptotic rod photoreceptors were used as a positive control. Scale bar, 50 μm. D, Labeling of retinal vasculature using isolectin-B4 (IB4) demonstrated no significant changes in TG Depleted retinas relative to WT and TG control retinas in terms of: (1) vascular patterning in retinal flat-mounts (top; insets show boxed areas at higher-magnification), and (2) laminar distribution of retinal vasculature in vibratome retinal sections (bottom). Scale bars: top, 1 mm; bottom, 50 μm.
Figure 4.
Figure 4.
Effect of retinal microglial depletion on density and morphology of retinal neurons: retinal ganglion cells, amacrine cells, horizontal cells, and bipolar cells. A, Brn3a-immunopositive retinal ganglion cells (RGCs) in TG-depleted retinas, relative to WT and TG controls, demonstrated: (1) similar laminar positions in the ganglion cell layer (GCL) in retinal sections (top), and (2) similar somatic densities in flat-mounted retina (bottom). Densities of Brn3a+ RGCs are quantified in B. C, ChAT-immunopositive cholinergic amacrine cells in TG-depleted retinas maintained: (1) normal sublamination in the ON and OFF sublamina of the IPL (top), and (2) similar somatic densities in the GCL and inner nuclear layer (INL) relative to WT and TG controls (bottom). Densities of ChAT+ cells in the GCL and INL are quantified in D and E, respectively. F, Calbindin-immunopositive amacrine cells in all three groups demonstrate preserved sublaminar dendritic stratification in the IPL (top). Calbindin-immunopositive horizontal cells in all three groups show dendritic processes that are confined to the OPL (middle) and have similar somatic densities and dendritic arborizations (bottom; insets show magnified views). Densities of calbindin+ horizontal cells are quantified in G. H, PKCα-immunopositive ON-rod bipolar cells in TG Depleted retinas show similar somatic, dendritic, and axonal morphologies structures relative to WT and nondepleted TG controls. Density of PKCα+ bipolar somata in the ONL (bottom) is quantified in I. Column heights indicate distribution means and error bars indicate SE; n = 12 imaging fields from four animals (2 male and 2 female animals, 8 weeks old) in each of the WT, TG, and TG Depleted 30 d groups. Pairwise comparisons of cell densities between groups for all cell types compared did not reveal significant differences (p > 0.05 for all comparisons, one-way ANOVA with Tukey's multiple-comparisons test). Scale bars, 30 μm.
Figure 5.
Figure 5.
Effect of retinal microglial depletion on photoreceptor structure. A, Photoreceptor rods, labeled with anti-Reep6 antibody, demonstrated similar numbers and organization across groups. B, Anti-PNA-labeling of cone outer matrix sheaths in the outer nuclear layer (ONL) demonstrated structural similarities in the cone outer segments in all three groups. C, The structures of cone outer segments, somata, and axons, as revealed by immunolabeling with cone arrestin, were also unchanged in TG depleted retinas relative to controls (top). Confocal imaging in a single horizontal plane in the ONL (dotted line) demonstrated similar distribution and density of cone somata (bottom). Density of arrestin+ cone soma is quantified in D. Column heights indicate distribution means and error bars indicate SE; n = 12 imaging fields from four animals (2 male and 2 female animals) in each of the WT, TG, and TG depleted 30 d groups. Pairwise comparisons between groups did not reveal significant differences (p > 0.05 for all comparisons, one-way ANOVA with Tukey's multiple-comparisons test). Scale bar, 20 μm.
Figure 6.
Figure 6.
Effect of retinal microglial depletion on Müller cells and retina astrocytes. A, mRNA expression levels were assessed using NGS and rtPCR. Comparisons were made between TG mice gavaged with corn oil without tamoxifen (TG Control), and animals depleted of microglia with continuous administration of TAM in corn oil for 15 and 30 d. Levels of Müller cell-expressed genes that are typically upregulated in the context of activation (GFAP, S100A6, vimentin) were increased with microglial depletion. (pairwise comparisons made with one-way ANOVA; *indicates comparisons relative to TG control for which p < 0.05, n = 3 male, 8-week-old animals per group). B, Immunolabeling of retinal astrocyte processes for GFAP and Müller cell end-feet processes for glutamine synthetase (GS) in the ganglion cell layer of retinal flat-mounts demonstrated a similar density and organization of processes in microglia-depleted retinas (TG Depleted) relative to controls. C, GS-immunopositive Müller cells, as viewed in retinal sections, have similar morphologies in TG-depleted retinas (with ablated CD11b immunostaining following microglial depletion) compared with TG Control (top). Müller cells also failed to upregulate GFAP expression in their cellular processes following microglial depletion in TG-depleted retinas (with ablated Iba1 immunostaining), similar to that in TG control retinas (bottom). Scale bars, 30 μm.
Figure 7.
Figure 7.
Effect of retinal microglial depletion on functional electroretinographic responses. ERG recordings were obtained from adult (2- to 3-month-old) female: (1) nondepleted TG mice (TG control; n = 17 animals), (2) mice depleted of microglia for 5 d (TG Depleted 5 d; n = 5 animals), and (3) mice depleted of microglia for 30 d (TG Depleted 30 d; n = 13 animals). A, Dark-adapted a-wave responses were nonsignificantly changed at 5 d (p = 0.12) but significantly decreased at 30 d (p < 0.0001). Dark-adapted b-wave responses were progressively decreased at both 5 and 30 d (p < 0.0001). B, Light-adapted responses: a-wave responses were unchanged at 5 d (p = 0.87) but decreased at 30 d (p < 0.0001); b-wave responses were progressively decreased at 5 d and further at 30 d (p < 0.0001). In both light- and dark-adapted responses, b–a wave amplitude ratios are progressively decreased with duration of depletion. C, ERG recordings were obtained from adult (2- to 3-month-old) C57BL6 WT mice that were either tested without TAM administration or tested followed 30 d of TAM administration (n = 6 female 8-week-old animals in each group). Comparison of dark-adapted a- and b-wave responses revealed no changes secondary to TAM administration. Comparison of light-adapted a-wave response showed no significant changes but slightly and significantly decreased b-wave responses after TAM administration (graphical data in B and C are represented as mean ± SEM; *indicates comparisons relative to baseline using multiple t tests, corrected for multiple comparisons using the Holm–Sidak method, for α < 0.05). D, Visual acuity capabilities of age-matched adult (2- to 3-month-old) TG versus TG-depleted 30 d mice were evaluated by automated assessment of optomotor responses (n = 4 female 8-week-old animals in each group). Sinusoidal gratings, rotating in a virtual cylinder at 12°/s, were presented at different spatial frequencies to each awake and unrestrained animal tested, and resulting optomotor responses were quantitated from the tracking of head movements as the ratio of the time during which head movement occurred in the same direction with stimulus movement to the time during which it occurred in the opposite direction (Tcorrect/Tincorrect). Data points indicate median ratios at each grating spatial frequency with the color areas indicating the upper and lower quartiles of the dataset. Measurements from functionally blind 6-month-old rd10 mice (yellow areas) served as a negative control. Under scotopic conditions (left), the response curve of TG Control mice (pink symbols) at lower frequencies matched that of TG-depleted mice (green symbols) closely, whereas at higher frequencies (>0.15 cycles/°), the response curve for TG Depleted 30 d mice was slightly and nonsignificantly lower than that of TG Control mice. Under photopic conditions (right), the response curve of the response curve for TG Depleted 30 d mice was slightly, and nonsignificantly lower, than that of TG Control mice. Estimations of visual threshold, defined as the spatial frequency corresponding to 25% of the maximum optomotor response, was similar between depleted and nondepleted animals, for both scotopic and photopic conditions (p > 0.05, t test; bottom).
Figure 8.
Figure 8.
Effect of retinal microglial depletion on synaptic organization in the plexiform layers as visualized by light microscopy. A, Visualization of cone pedicles in the OPL by arrestin immunolabeling demonstrated that cone pedicles were of similar horizontal density (as viewed in retina flat-mounts in top) and morphology (as viewed in retina sections in bottom) in WT, TG control, and TG-depleted groups. B, PNA-labeled cone pedicle active site areas also demonstrated preserved structures and distributions in all three groups. C, Ribeye-immunopositive photoreceptor ribbon synapses, in conjunction with Reep6-labeled rod spherules, were also similar in density and distribution in all three groups. D, Immunolocalization of the synaptic marker PSD-95 protein in rod spherules and cone pedicles showed a normal distribution and intensity in TG and TG-depleted retinas. E, Immunolocalization of VGLUT1, a protein located in synaptic vesicles in ribbon synapses of photoreceptors and bipolar cells of the OPL and IPL respectively, were unchanged in distribution with microglial depletion. F, Immunolocalization of the NMDA receptor subunit A (NMDAR2A) also demonstrates normal patterns of localization in the postsynaptic sites in the IPL and the OPL. Scale bars: A (top), CF, 20 μm; A (bottom), B, 10 μm.
Figure 9.
Figure 9.
Sustained depletion of retinal microglia is associated with synaptic degeneration and atrophy. A, Synaptic ultrastructure in the OPL as revealed by transmission electron microscopy demonstrated normal presynaptic termini structures (black *) in both WT and TG control retinas, but the frequent presence of irregularly shaped termini with electron-dense, osmiophilic cytoplasm with thickened and irregular ribbons in the TG-depleted retina (red *), indicative of synaptic degeneration; magnified view of degenerating synapses shown in insets. B, Quantitative analysis demonstrates that in microglia-depleted retinas, OPL termini density was similar to WT and nondepleted TG controls (left). However, analysis of the fraction of OPL termini with electron-dense cytoplasm (right) showed a general increase in the proportion of degenerating termini with electron-dense cytoplasm in microglia-depleted retina (data are represented as mean ± SEM; p values reported for one-way ANOVA with multiple comparisons, n = 3 female, 8-week-old animals per group and 13 imaging fields per condition). C, Synaptic ultrastructure in the IPL demonstrated altered distribution of synaptic vesicles surrounding the ribbons (highlighted in circles) of rod bipolar cells (RBCs). Postsynaptically, the dendrites of amacrine cells (ACs) showed increased vacuolation (arrow) and mitochondrial swelling (arrowhead). Scale bars, 1 μm.

References

    1. Baalman K, Marin MA, Ho TS, Godoy M, Cherian L, Robertson C, Rasband MN. Axon initial segment-associated microglia. J Neuroscience. 2015;35:2283–2292. doi: 10.1523/JNEUROSCI.3751-14.2015. - DOI - PMC - PubMed
    1. Blanks JC, Johnson LV. Selective lectin binding of the developing mouse retina. J Comp Neurol. 1983;221:31–41. doi: 10.1002/cne.902210103. - DOI - PubMed
    1. Bruttger J, Karram K, Wörtge S, Regen T, Marini F, Hoppmann N, Klein M, Blank T, Yona S, Wolf Y, Mack M, Pinteaux E, Müller W, Zipp F, Binder H, Bopp T, Prinz M, Jung S, Waisman A. Genetic cell ablation reveals clusters of local self-renewing microglia in the mammalian central nervous system. Immunity. 2015;43:92–106. doi: 10.1016/j.immuni.2015.06.012. - DOI - PubMed
    1. Caleo M, Restani L, Vannini E, Siskova Z, Al-Malki H, Morgan R, O'Connor V, Perry VH. The role of activity in synaptic degeneration in a protein misfolding disease, prion disease. PloS One. 2012;7:e41182. doi: 10.1371/journal.pone.0041182. - DOI - PMC - PubMed
    1. Cartier N, Lewis CA, Zhang R, Rossi FM. The role of microglia in human disease: therapeutic tool or target? Acta Neuropathologica. 2014;128:363–380. doi: 10.1007/s00401-014-1330-y. - DOI - PMC - PubMed

Publication types

MeSH terms

Substances