. 2016 Apr 14;90(9):4807-4826.
doi: 10.1128/JVI.03055-15. Print 2016 May.

Novel Role for Protein Inhibitor of Activated STAT 4 (PIAS4) in the Restriction of Herpes Simplex Virus 1 by the Cellular Intrinsic Antiviral Immune Response

Affiliations

Novel Role for Protein Inhibitor of Activated STAT 4 (PIAS4) in the Restriction of Herpes Simplex Virus 1 by the Cellular Intrinsic Antiviral Immune Response

Kristen L Conn et al. J Virol. .

Abstract

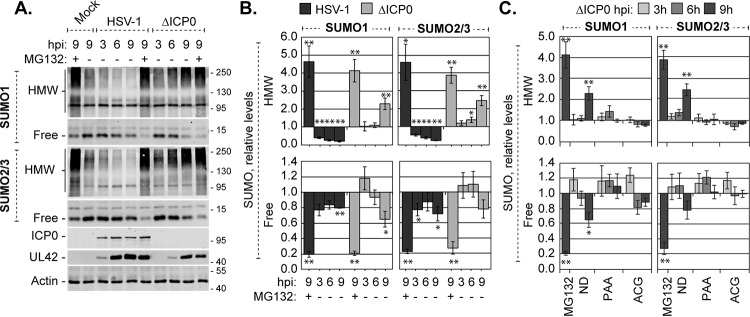
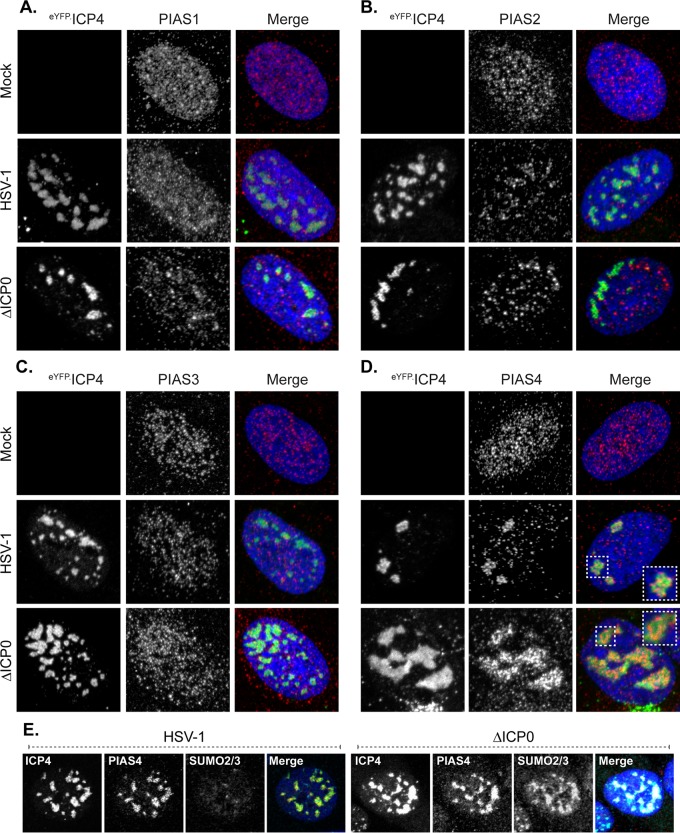
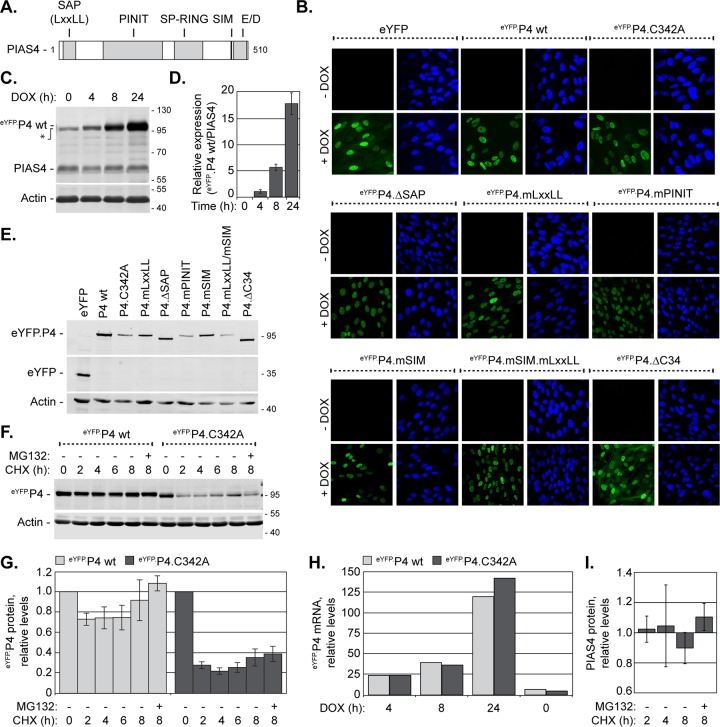
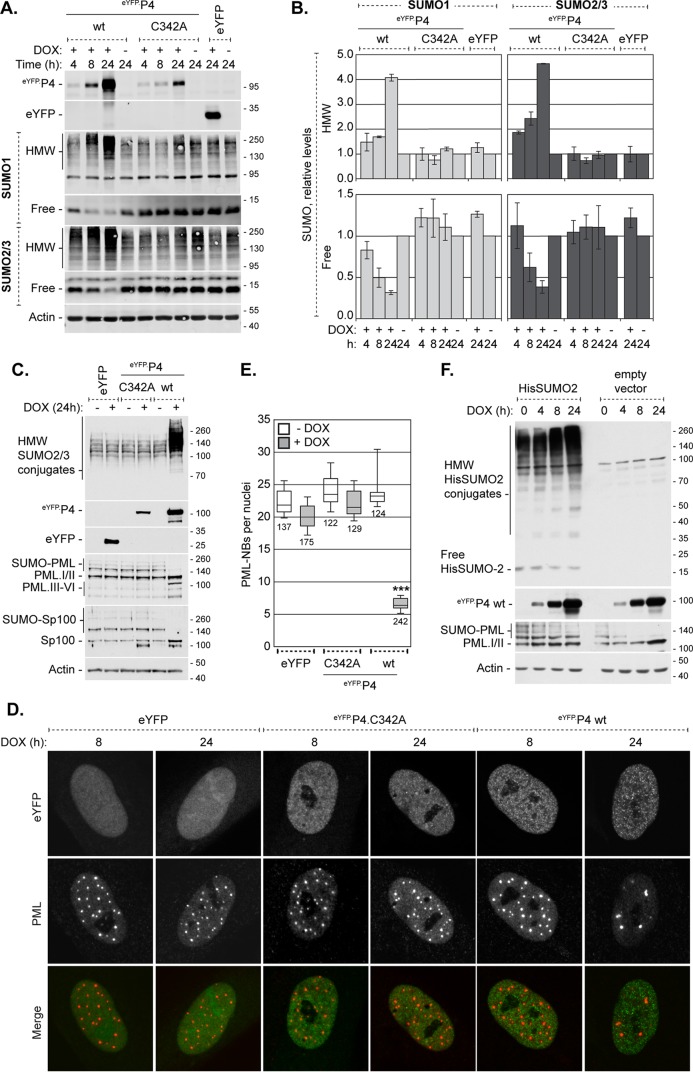
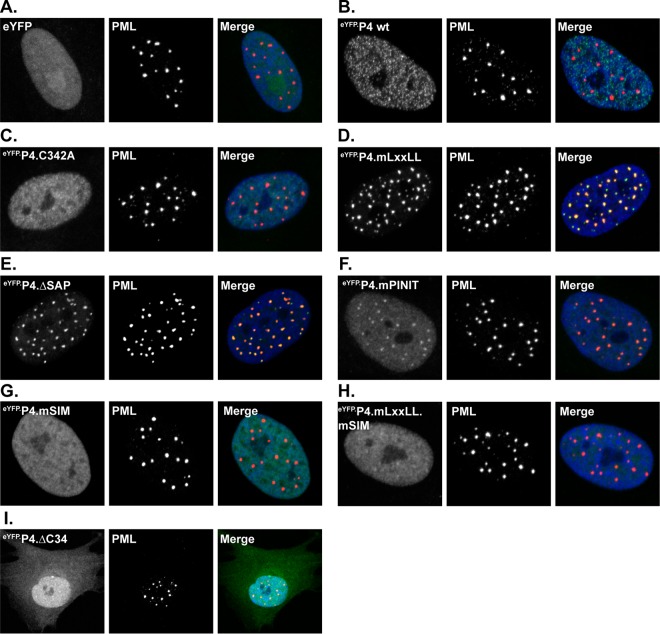
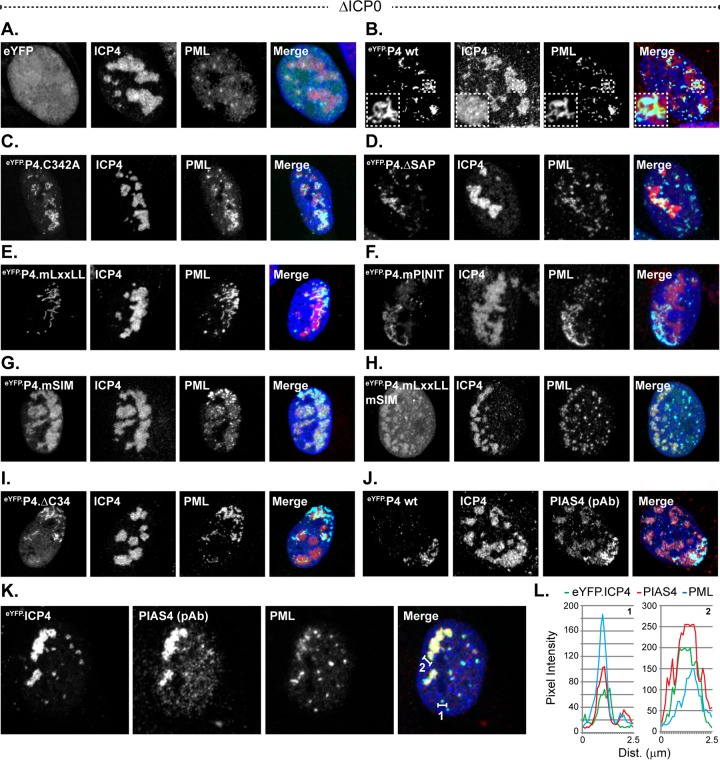
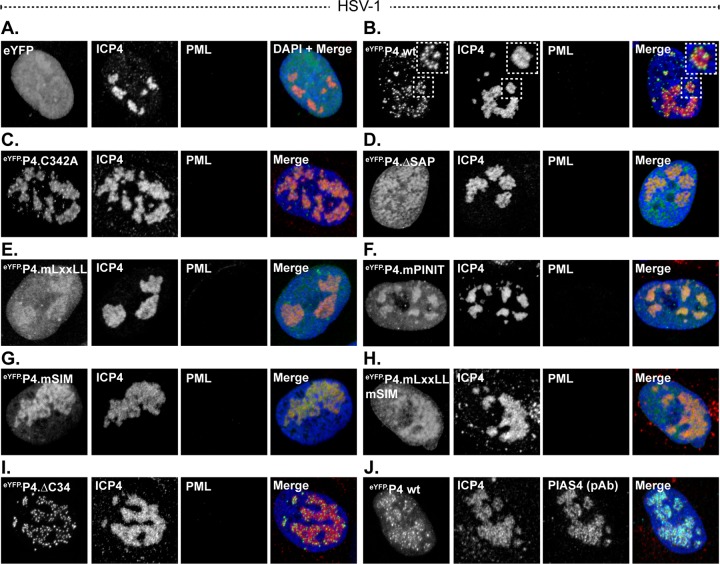
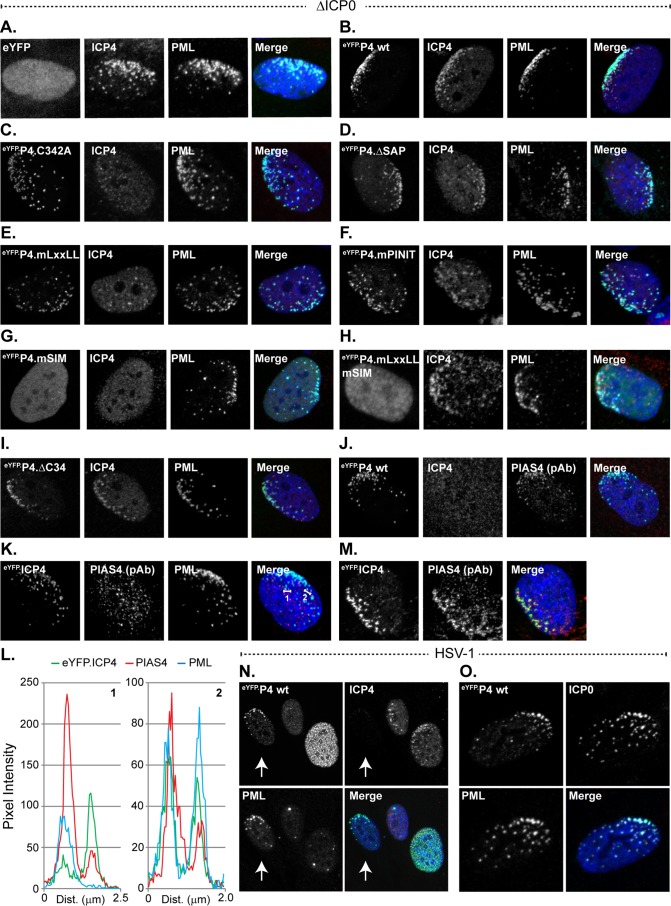
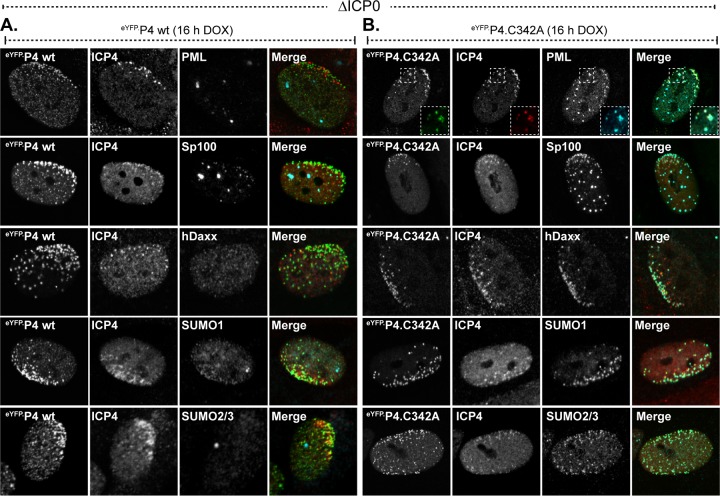
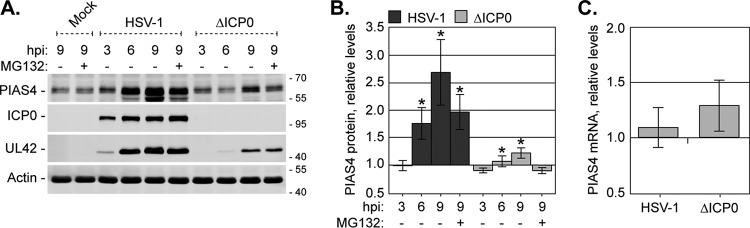
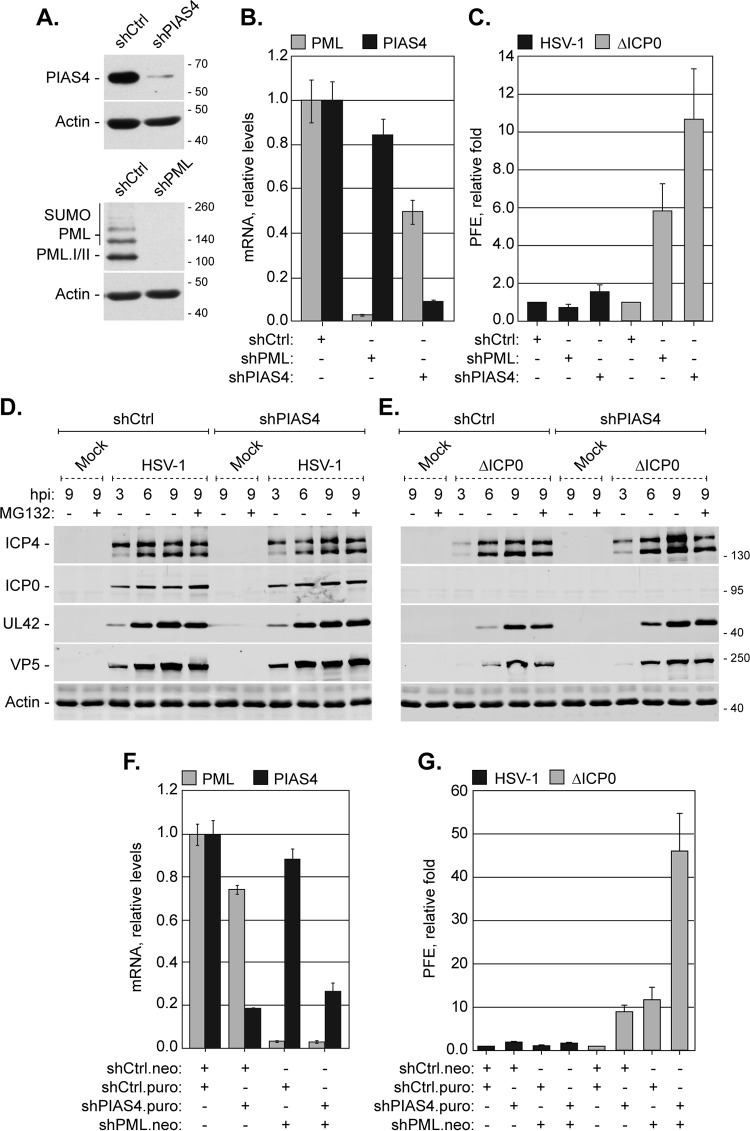
Small ubiquitin-like modifier (SUMO) is used by the intrinsic antiviral immune response to restrict viral pathogens, such as herpes simplex virus 1 (HSV-1). Despite characterization of the host factors that rely on SUMOylation to exert their antiviral effects, the enzymes that mediate these SUMOylation events remain to be defined. We show that unconjugated SUMO levels are largely maintained throughout infection regardless of the presence of ICP0, the HSV-1 SUMO-targeted ubiquitin ligase. Moreover, in the absence of ICP0, high-molecular-weight SUMO-conjugated proteins do not accumulate if HSV-1 DNA does not replicate. These data highlight the continued importance for SUMO signaling throughout infection. We show that the SUMO ligase protein inhibitor of activated STAT 4 (PIAS4) is upregulated during HSV-1 infection and localizes to nuclear domains that contain viral DNA. PIAS4 is recruited to sites associated with HSV-1 genome entry through SUMO interaction motif (SIM)-dependent mechanisms that are destabilized by ICP0. In contrast, PIAS4 accumulates in replication compartments through SIM-independent mechanisms irrespective of ICP0 expression. Depletion of PIAS4 enhances the replication of ICP0-null mutant HSV-1, which is susceptible to restriction by the intrinsic antiviral immune response. The mechanisms of PIAS4-mediated restriction are synergistic with the restriction mechanisms of a characterized intrinsic antiviral factor, promyelocytic leukemia protein, and are antagonized by ICP0. We provide the first evidence that PIAS4 is an intrinsic antiviral factor. This novel role for PIAS4 in intrinsic antiviral immunity contrasts with the known roles of PIAS proteins as suppressors of innate immunity.

Importance: Posttranslational modifications with small ubiquitin-like modifier (SUMO) proteins regulate multiple aspects of host immunity and viral replication. The protein inhibitor of activated STAT (PIAS) family of SUMO ligases is predominantly associated with the suppression of innate immune signaling. We now identify a unique and contrasting role for PIAS proteins as positive regulators of the intrinsic antiviral immune response to herpes simplex virus 1 (HSV-1) infection. We show that PIAS4 relocalizes to nuclear domains that contain viral DNA throughout infection. Depletion of PIAS4, either alone or in combination with the intrinsic antiviral factor promyelocytic leukemia protein, significantly impairs the intrinsic antiviral immune response to HSV-1 infection. Our data reveal a novel and dynamic role for PIAS4 in the cellular-mediated restriction of herpesviruses and establish a new functional role for the PIAS family of SUMO ligases in the intrinsic antiviral immune response to DNA virus infection.


Figures

FIG 1
FIG 1
HMW SUMO-conjugated proteins do not accumulate when HSV-1 DNA does not replicate. (A) Western blots show the levels of HMW-conjugated or free SUMO1 or -2/3 during wild-type or ICP0-null mutant HSV-1 infection. HFt cells infected with 10 PFU of wild-type or ICP0-null mutant (ΔICP0) HSV-1 per cell in the presence (+) or absence (−) of the proteasome inhibitor MG132 were harvested at 3, 6, or 9 h postinfection (hpi). Membranes were probed for SUMO1 or -2/3, the viral protein ICP0 or UL42 to monitor infection progression, or actin as a loading control. Molecular mass markers are indicated, in kilodaltons. (B) Bar graphs show the average relative levels of HMW-conjugated or free SUMO1 or -2/3 during wild-type or ICP0-null mutant HSV-1 infection. The intensities of SUMO1 or -2/3 protein bands were quantitated from Western blots as shown in panel A; quantitated levels were normalized to their respective loading controls and are expressed relative to the levels in mock-infected cells at 9 hpi (1.0). Means and standard error of the means (SEM) are shown (n ≥ 4). (C) Bar graphs show the average relative levels of HMW-conjugated or free SUMO1 or -2/3 in the presence of either of the DNA replication inhibitors PAA or ACG, MG132, or no drug (ND). Infections equivalent to those for panel A were performed in the presence or absence of the indicated drugs. The intensities of SUMO1 or -2/3 protein bands were quantitated from Western blots; quantitated values were normalized to their respective loading controls and are expressed relative to the levels in untreated mock-infected cells at 9 hpi. Means and SEM are shown (n ≥ 3). *, P < 0.05; **, P < 0.01 (Student's two-tailed t test).
FIG 2
FIG 2
PIAS4 accumulates in HSV-1 replication compartments. (A to D) Confocal images show the nuclear localization of PIAS1 (A), PIAS2 (B), PIAS3 (C), or PIAS4 (D) in HFt cells mock infected (mock) or infected with 0.002 PFU of wild-type HSV-1 or 2 PFU of ICP0-null mutant (ΔICP0) HSV-1 per cell for 16 h. Wild-type and mutant HSV-1 strains expressed eYFP-ICP4, the accumulation of which was used to visualize replication compartments within cells at the edge of developing plaques (6). PIAS proteins were visualized by indirect immunofluorescence (red). Insets (dashed boxes in panel D) highlight regions of PIAS4 localization within replication compartments. (E) Confocal images show the nuclear localization of PIAS4 and SUMO2/3 within wild-type or ICP0-null mutant HSV-1 replication compartments in cells infected as described above. ICP4 (green), PIAS4 (red), and SUMO2/3 (cyan) were visualized by indirect immunofluorescence. Nuclei were visualized by DAPI (blue).
FIG 3
FIG 3
HFt cells stably transduced with DOX-inducible eYFP.PIAS4 wild-type or mutant protein expression constructs. (A) The illustration depicts the conserved PIAS4 domains (gray boxes) mutated within eYFP.PIAS4 (eYFP.P4) (Table 1). (B) Confocal images show the nuclear expression of eYFP, eYFP.P4 wild-type (wt) or mutant proteins (as indicated) in transgenic HFt cells after 8 h of induction (+DOX) or not (−DOX). Nuclei were visualized by DAPI (blue). (C) Western blot shows the levels of eYFP.PIAS4 wild-type (eYFP.P4 wt) or endogenous PIAS4 (PIAS4) in transgenic HFt cells after different lengths of DOX induction, as indicated. Membranes were probed for PIAS4 or actin as a loading control. The asterisk indicates a PIAS4 polyclonal antibody cross-reacting band. (D) A bar graph shows the average level of eYFP.P4 wt relative to endogenous PIAS4 in transgenic cells after various lengths of DOX induction. The intensities of PIAS4 protein bands from Western blots as in panel C were quantitated and normalized to their respective loading controls. Normalized levels of eYFP.P4 wt are expressed relative to the normalized levels of endogenous PIAS4 at each time. Means and standard deviations (SD) are shown (n = 3). (E) Whole-cell lysates collected from transgenic HFt cells 8 h post-DOX induction were analyzed by Western blotting for the levels of eYFP and eYFP.PIAS4 wild-type or mutant protein (as indicated) expression. Membranes were probed for eYFP or actin as a loading control. (F) Western blot shows the levels of eYFP.PIAS4 wild-type or catalytically inactive mutant (C342A) proteins at different times after translational inhibition. Expression of eYFP.P4 wt or eYFP.P4.C342A was DOX induced for 4 h prior to the replacement of DOX with the translation inhibitor cycloheximide (CHX) in the presence (+) or absence (−) of MG132. Whole-cell lysates were harvested at 0, 2, 4, 6, or 8 h following CHX addition. Membranes were probed with eYFP or actin as a loading control. Molecular mass markers are indicated, in kilodaltons. (G) A bar graph shows the average relative levels of eYFP.PIAS4 wild-type or catalytically inactive mutant proteins following translation inhibition. The intensities of protein bands corresponding to eYFP.P4 quantitated from Western blots as in panel F were normalized to their respective loading controls and expressed relative to the normalized levels at 0 h of CHX treatment (1.0). Means and SEM are shown (n = 3). (H) A bar graph shows the average relative levels of PIAS4 mRNA in transgenic cells that express eYFP.P4 wild-type or catalytically inactive mutant proteins. Total RNA was isolated after 4, 8, or 24 h of DOX induction. The levels of PIAS4 mRNA were determined using the TaqMan system of quantitative RT-PCR. Values were normalized to GAPDH expression using the threshold cycle (ΔΔCT) method and are expressed relative to the normalized level of PIAS4 mRNA at 0 h of DOX induction (1). Values represent the averages from two independent experiments. (I) A bar graph shows the average relative level of endogenous PIAS4 following translation inhibition. HFt cells were treated with CHX in the presence (+) or absence (−) of MG132, and whole-cell lysates were collected at 2, 4, or 8 h after CHX addition. Intensities of the protein bands corresponding to PIAS4 were quantitated and normalized to their respective loading controls and are expressed relative to the normalized level of PIAS4 at 0 h of CHX treatment (1.0). Means and SEM are shown (n ≥ 3).
FIG 4
FIG 4
Overexpression of eYFP-PIAS4 disrupts SUMO pathway homeostasis. (A) Western blots show the levels of HMW-conjugated or free SUMO1 or -2/3 in transgenic HFt cells induced (+) to express eYFP or eYFP.PIAS4 wild-type (wt) or catalytically inactive mutant (C342A) proteins or not (−). Whole-cell lysates were collected at 4, 8, or 24 h postinduction. Membranes were probed for SUMO1 or -2/3, eYFP, or actin as a loading control. (B) Bar graphs show the average levels of HMW-conjugated or free SUMO1 or -2/3 in transgenic cells induced (+) or not (−) to express eYFP or eYFP.PIAS4 wild-type or catalytically inactive mutant proteins. The intensities of protein bands corresponding to SUMO1 or -2/3 quantitated from Western blots as in panel A were normalized to their respective loading control and expressed relative to the levels in uninduced cells (1.0). Means and SEM are shown (n = 2 [HMW] or n = 3 [free]). (C) Western blots show the SUMO modification of PML or Sp100 in transgenic cells induced (+) or not (−) to express eYFP or eYFP.PIAS4 wild-type or catalytically inactive mutant proteins for 24 h. Membranes were probed for SUMO2/3, eYFP, PML, Sp100, or actin as a loading control. (D) Confocal images show PML-NBs in transgenic cells induced to express eYFP or eYFP.PIAS4 wild-type or catalytically inactive mutant proteins. PML-NBs were identified by PML accumulation; PML was visualized by indirect immunofluorescence (red). (E) Box-and-whisker chart shows the number of PML-NBs per nuclei in transgenic cells induced (+DOX) for 24 h or not (−DOX) to express eYFP or eYFP.PIAS4 wild-type or catalytically inactive mutant proteins. Boxes, 25th to 75th percentile; black line, median number of PML-NBs per nucleus; whiskers, absolute range. The total number of cells analyzed per sample is indicated by each box from ≥10 fields of view per sample collected over two independent experiments. ***, P < 0.0001 (Mann-Whitney U test). (F) A Western blot shows the SUMO modification of PML in transgenic cells induced to express eYFP.P4 wt in the presence or absence of His-SUMO2. HFt cells stably transduced with eYFP.P4 expression vectors were transduced with a second lentiviral vector to constitutively express His-tagged SUMO2 or with an empty vector control. Expression of eYFP.P4 was induced for 0, 4, 8, or 24 h prior to the collection of whole-cell lysates. Membranes were probed for His, eYFP, PML, or actin as a loading control. Molecular mass markers are indicated, in kilodaltons.
FIG 5
FIG 5
PIAS4 relocalizes to PML-NBs in a SIM- or ligase-dependent manner in the absence of SAP- or LxxLL-mediated interactions. Confocal images show the localization of eYFP or eYFP.PIAS4 wild-type or mutant proteins with respect to PML-NBs after 6 to 8 h of DOX induction. PML-NBs were identified by PML accumulation; PML was visualized by indirect immunofluorescence (red). Nuclei were visualized by DAPI (blue).
FIG 6
FIG 6
PIAS4 can associate with PML in ICP0-null mutant HSV-1 replication compartments in a SIM-dependent manner. (A to I) Confocal images show the nuclear localization of eYFP or eYFP.PIAS4 wild-type or mutant proteins (as indicated) with respect to ICP0-null mutant (ΔICP0) HSV-1 replication compartments, identified by ICP4 accumulation, or PML. Transgenic HFt cells were infected with 1 PFU of ICP0-null mutant HSV-1 per cell for 16 h prior to DOX induction of eYFP or eYFP.PIAS4 wild-type or mutant protein expression for 6 to 8 h. Localization of PML (cyan) and ICP4 (red) was visualized by indirect immunofluorescence. The inset (dashed box in panel B) highlights a region within a replication compartment where eYFP.P4 wt and PML colocalize in string-like structures (69). (J) Validation of PIAS4 polyclonal antibody (pAb; cyan) detection of eYFP.P4 wt within ICP0-null mutant HSV-1 replication compartments (ICP4; red). (K) Confocal images show the association of endogenous PIAS4 (red) with PML (cyan) in ICP0-null mutant HSV-1 replication compartments. (L) Emission spectra depict the pixel intensity and colocalization between eYFP.ICP4, endogenous PIAS4, and PML within a focus or region of an ICP0-null mutant HSV-1 replication compartment indicated by the corresponding numbered lines in panel K. Nuclei were visualized by DAPI (blue).
FIG 7
FIG 7
The SAP domain or LxxLL motif enhances PIAS4 accumulation in wild-type HSV-1 replication compartments. (A to I) Confocal images show the nuclear localization of eYFP or eYFP.PIAS4 wild-type or mutant proteins (as indicated) with respect to wild-type HSV-1 replication compartments, identified by ICP4 accumulation. Transgenic HFt cells were infected with 0.002 PFU of wild-type HSV-1 per cell for 16 h prior to DOX induction of eYFP or eYFP.PIAS4 wild-type or mutant protein expression for 6 to 8 h. ICP4 (red) and PML (cyan) were visualized by indirect immunofluorescence. The inset (dashed box in panel B) highlights the punctate localization of eYFP.P4 wt within a replication compartment. (J) Validation of PIAS4 pAb (cyan) detection of eYFP.P4 wt within wild-type HSV-1 replication compartments (ICP4; red). Nuclei were visualized by DAPI stain (blue).
FIG 8
FIG 8
ICP0 disrupts PIAS4 SIM-dependent recruitment to nuclear domains associated with HSV-1 genome entry. (A to I) Confocal images show the nuclear localization of eYFP or eYFP.PIAS4 wild-type or mutant proteins (as indicated) with respect to infecting ICP0-null mutant (ΔICP0) HSV-1 genomes, visualized by the asymmetric nuclear edge localization of ICP4 or PML (6, 69). Transgenic HFt cells were infected with 1 PFU of ICP0-null mutant HSV-1 per cell for 16 h prior to DOX induction of eYFP or eYFP.PIAS4 wild-type or mutant protein expression for 6 to 8 h. ICP4 (red) and PML (cyan) were visualized by indirect immunofluorescence. (J) Validation of PIAS4 pAb (cyan) detection of eYFP.P4 wt at nuclear domains that contain infecting HSV-1 genomes. (K and M) Confocal images show the typical (K) or atypical (M) localization of endogenous PIAS4 (red) with respect to eYFP.ICP4 at a nuclear edge associated with ICP0-null mutant HSV-1 genome nuclear entry. (L) Emission spectra depict pixel intensity and colocalization between eYFP.ICP4 and PIAS4 in selected foci that correspond to the numbered lines in panel K. (N) Confocal images show the localization of eYFP.P4 wt with respect to PML or ICP4 in cells at the periphery of a developing wild-type HSV-1 plaque. Transgenic HFt cells were infected with 0.002 PFU of wild-type HSV-1 per cell for 16 h prior to induction of eYFP.P4 wt for 6 to 8 h. ICP4 (red) and PML (cyan) were visualized by indirect immunofluorescence. The arrow highlights the asymmetric redistribution of eYFP.P4 wt or PML to the nuclear edge prior to the detectable expression of ICP4. (O) Confocal images show the localization of eYFP.P4 wt with respect to ICP0 or PML prior to ICP0-mediated degradation of PML. Transgenic HFt cells were infected as for panel N. ICP0 (red) and PML (cyan) were visualized by indirect immunofluorescence. Nuclei were visualized by DAPI (blue).
FIG 9
FIG 9
Overexpression of eYFP.PIAS4 disrupts the recruitment of PML-NB antiviral proteins to domains that contain infecting HSV-1 genomes in an SP-RING-dependent manner. (A and B) Confocal images show the recruitment of constituent PML-NB antiviral proteins to nuclear domains associated with HSV-1 genome entry in transgenic cells that express eYFP.PIAS4 wild-type (wt; A) or catalytically inactive mutant (C342A; B) proteins. Transgenic HFt cells were induced with DOX for 16 h before they were infected with 1 PFU of ICP0-null mutant (ΔICP0) HSV-1 per cell for 24 h. The nuclear domains that contain infecting HSV-1 genomes were identified by nuclear edge localization of ICP4. PML, Sp100, Daxx, SUMO1, or SUMO2/3 (cyan) and ICP4 (red) were visualized by indirect immunofluorescence.
FIG 10
FIG 10
Endogenous PIAS4 expression increases during HSV-1 infection. (A) A Western blot shows PIAS4 levels during wild-type or ICP0-null mutant HSV-1 infection. HFt cells mock infected or infected with 10 PFU of wild-type or ICP0-null mutant (ΔICP0) HSV-1 per cell in the presence (+) or absence (−) of MG132 were harvested at 3, 6, or 9 hpi. Membranes were probed for PIAS4, either of the viral proteins ICP0 and UL42 to indicate infection progression, or actin as a loading control. Molecular mass markers are shown, in kilodaltons. (B) A bar graph shows the average levels of PIAS4 in wild-type or ICP0-null mutant HSV-1-infected cells. The intensities of PIAS4 protein bands quantitated from Western blots as in panel A were normalized to their respective loading controls and expressed relative to the normalized level in mock-infected cells at 9 hpi (1.0). Means and SEM are shown (n = 7). *, P < 0.05 (Student's two-tailed t test). (C) A bar graph depicts the average relative level of PIAS4 mRNA during wild-type or ICP0-null mutant HSV-1 infection. HFt cells were infected as described for panel A, and total RNA was isolated at 9 hpi. PIAS4 mRNA levels were determined using the TaqMan system of quantitative RT-PCR. Values normalized to GAPDH expression using the ΔΔCT method are expressed relative to mock-infected cells (1.0). Means and SEM are shown (n ≥ 3).
FIG 11
FIG 11
Endogenous PIAS4 contributes to the cellular restriction of ICP0-null mutant HSV-1. (A) Western blots show the levels of PIAS4 or PML in transgenic HFt cells that express short hairpin RNAs against PIAS4 (shPIAS4), PML (shPML), or a control sequence (shCtrl). Membranes were probed for PIAS4, PML, or actin as a loading control. (B) A bar graph shows the average relative levels of PIAS4 or PML mRNA in transgenic HFt cells that express shCtrl, shPIAS4, or shPML. PIAS4 or PML mRNA levels were determined using the TaqMan system of quantitative RT-PCR. Values normalized to 18S expression using the ΔΔCT method are expressed relative to cells that expressed shCtrl (1.0). Values represent means and SD from three independent rounds of RT using mRNA isolated from one representative experiment. (C) A bar graph shows the average relative plaque formation efficiency (PFE) of wild-type or ICP0-null mutant (ΔICP0) HSV-1 in transgenic cells that express shCtrl, shPIAS4, or shPML, as indicated. The PFE for each strain in cells that express shPIAS4 or shPML was normalized to the respective PFE in cells that express shCtrl (1). Means and SD are shown (n ≥ 3). (D and E) Western blots show the levels of viral protein expression during wild-type or ICP0-null mutant (ΔICP0) HSV-1 infection of transgenic HFt cells that express shCtrl or shPIAS4. Transgenic cells mock infected or infected with 10 PFU of wild-type (D) or ICP0-null mutant (E) HSV-1 per cell in the presence (+) or absence (−) of MG132 were harvested at 3, 6, or 9 hpi. Membranes were probed for ICP4, ICP0, UL42, or VP5 to monitor the progression of infection or actin as a loading control. Molecular mass markers are shown, in kilodaltons. (F) A bar graph shows the average relative levels of PML or PIAS4 mRNA in transgenic cells that express shCtrl, shPIAS4, or shPML alone or in combination, as indicated. Analysis was performed as for panel B. Neo, neomycin resistance; Puro, puromycin resistance. (G) A bar graph shows the average relative PFE of wild-type or ICP0-null mutant HSV-1 in transgenic HFt cells that express shCtrl, shPIAS4, or shPML alone or in combination, as indicated. PFE analysis was done as described for panel C. Means and SD are shown (n ≥ 3).

Similar articles

Cited by

References

    1. Geoffroy MC, Chelbi-Alix MK. 2011. Role of promyelocytic leukemia protein in host antiviral defense. J Interferon Cytokine Res 31:145–158. doi:10.1089/jir.2010.0111. - DOI - PubMed
    1. Blanco-Melo D, Venkatesh S, Bieniasz PD. 2012. Intrinsic cellular defenses against human immunodeficiency viruses. Immunity 37:399–411. doi:10.1016/j.immuni.2012.08.013. - DOI - PMC - PubMed
    1. Everett RD, Boutell C, Hale BG. 2013. Interplay between viruses and host sumoylation pathways. Nat Rev Microbiol 11:400–411. doi:10.1038/nrmicro3015. - DOI - PubMed
    1. Yan N, Chen ZJ. 2012. Intrinsic antiviral immunity. Nat Immunol 13:214–222. doi:10.1038/ni.2229. - DOI - PMC - PubMed
    1. Arvin A, Campadelli-Fiume G, Mocarski E, Moore PS, Roizman B, Whitley R, Yamanishi K. 2007. Human herpesviruses: biology, therapy, and immunoprophylaxis. Cambridge University Press, Cambridge, United Kingdom. - PubMed

Publication types

MeSH terms