

doi: 10.1002/2015WR017278.
Epub 2015 Jul 24.
Hydraulic fracturing water use variability in the United States and potential environmental implications
Affiliations
- PMID: 26937056
- PMCID: PMC4758395
- DOI: 10.1002/2015WR017278
Item in Clipboard
Hydraulic fracturing water use variability in the United States and potential environmental implications
Water Resour Res.
2015 Jul.
Abstract
A U.S. map of water volumes used to hydraulically fracture oil and gas wells, 2011-2014Hydraulic fracturing water volumes differ regionally across the U.S.Discussion of variation in water use and potential environmental implications.
Keywords: hydraulic fracturing; shale gas; unconventional oil and gas; water use; well stimulation.
Figures

Average of the data within 1st−99th percentile of water volumes used (injected) per well to hydraulically fracture oil and gas wells (horizontal, directional, and vertical) drilled from January 2011 to August 2014 in watersheds (8 digit Hydrologic Unit Codes, HUCs) with at least two wells reporting water use (n = 81,816 wells). Shale‐gas formations are numbered (not in any particular order): (1) Barnett (Bend Arch‐Ft. Worth Basin), (2) Eagle Ford (Gulf Coast Basins), (3) Woodford (Anadarko and Arkoma Basins), (4) Fayetteville (Arkoma Basin), (5) Haynesville‐Bossier (Gulf Coast Basins), (6) Tuscaloosa (Gulf Coast Basins), and (7) Marcellus and Utica (Appalachian Basin). Supporting information Table S1 contains data used to construct this figure.

The (a) median national annual water volumes used (injected) per well to hydraulically fracture wells drilled from January 2000 to August 2014 delineated as a function of drill‐hole direction (vertical, horizontal directional) and final status (oil or gas) (n = 263,859) and (b) number of hydraulically fractured wells drilled from January 2000 to August 2014 as a function of drill hole direction and final status (n = 371,607). Includes only well information gathered and reported by IHS, Inc. [IHS Energy, 2014] as of 28 August 2014. Note: 1 cubic meter (m3) is equal to 264.17 gallons. Supporting information Tables S2 and S3 contains data used to construct this figure.
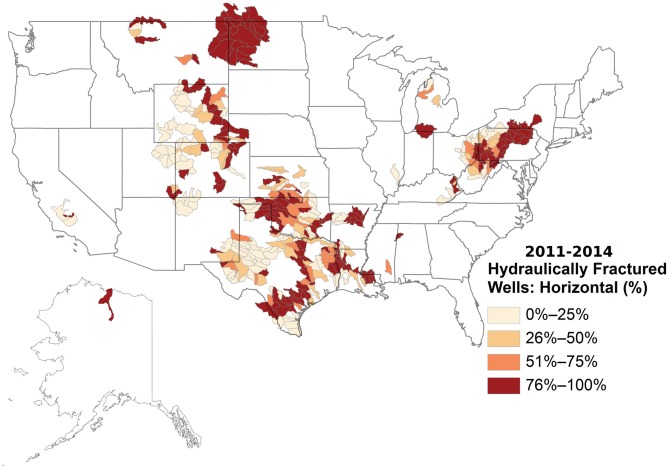
Percent of hydraulically fractured wells that were horizontally drilled from January 2011 to August 2014 in watersheds of the United States (n = 47,646). These horizontal wells represent about 47% of the total number of hydraulically fractured wells drilled during this period. Supporting information Table S4 contains data used to construct this figure.
Comment in
-
UK regulations: Could fracking creep under the radar?Nature. 2017 Aug 23;548(7668):393. doi: 10.1038/548393a. Nature. 2017. PMID: 28836601 No abstract available.
References
-
- Brittingham, M. C. , Maloney K. O., Farag A. M., Harper D. D., and Bowen Z. H. (2014), Ecological risks of shale oil and gas development to wildlife, aquatic resources and their habitats, Environ. Sci. Technol., 48(19), 11,034–11,047. - PubMed
-
- Clark, C. E. , Horner R. M., and Harto C. B. (2013), Life cycle water consumption for shale gas and conventional natural gas, Environ. Sci. Technol., 47(20), 11,829–11,836. - PubMed
-
- Elbel, J. , and Britt L. (2000), Fracture treatment design, in Reservoir Stimulation, edited by Economides M. J. and Nolte K. G., John Wiley, West Sussex, England.
-
- Gallegos, T. J. , and Varela B. A. (2015a), Trends in hydraulic fracturing distributions and treatment fluids, additives, proppants, and water volumes applied to wells drilled in the United States from 1947 through 2010—Data analysis and comparison to the literature, U.S. Geol. Surv. Sci. Invest. Rep. 2014–5131, 15 pp., U.S. Geol. Surv., Reston, Va. [Available at http://dx.doi.org/10.3133/sir20145131.] - DOI
LinkOut - more resources
Full Text Sources