. 2016 Feb 18;120(6):3428-3437.
doi: 10.1021/acs.jpcc.5b12387. Epub 2016 Jan 25.

Understanding Chemical versus Electrostatic Shifts in X-ray Photoelectron Spectra of Organic Self-Assembled Monolayers

Affiliations

Understanding Chemical versus Electrostatic Shifts in X-ray Photoelectron Spectra of Organic Self-Assembled Monolayers

Thomas C Taucher et al. J Phys Chem C Nanomater Interfaces. .

Abstract

The focus of the present article is on understanding the insight that X-ray photoelectron spectroscopy (XPS) measurements can provide when studying self-assembled monolayers. Comparing density functional theory calculations to experimental data on deliberately chosen model systems, we show that both the chemical environment and electrostatic effects arising from a superposition of molecular dipoles influence the measured core-level binding energies to a significant degree. The crucial role of the often overlooked electrostatic effects in polar self-assembled monolayers (SAMs) is unambiguously demonstrated by changing the dipole density through varying the SAM coverage. As a consequence of this effect, care has to be taken when extracting chemical information from the XP spectra of ordered organic adsorbate layers. Our results, furthermore, imply that XPS is a powerful tool for probing local variations in the electrostatic energy in nanoscopic systems, especially in SAMs.


Conflict of interest statement

The authors declare no competing financial interest.

Figures
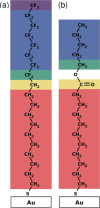
Figure 1
Figure 1
Chemical structures of (a) 12,12,13,13,14,14,15,15,16,16,17,17,18,18,19,19,19-heptadecafluorononadecane-1-thiolate (F8H11SH) and pentyl-11-sulfanylundecanoate (C10EC5) bonded to a Au(111) surface. The different background colors refer to C atoms with chemically clearly distinct environments (see Results and Discussion section).
Figure 2
Figure 2
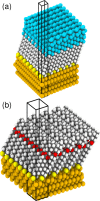
Pictures of the Au(111)/SAM interface for F8H11SH (a) and C10EC5 (b). The surface unit cell is indicated by the black parallelepiped, showing the applied periodic boundary conditions used in the simulations as well as the vacuum gap to decouple the periodic replicas in the z-direction (for details see main text).
Figure 3
Figure 3
DFT-calculated (screened) C 1s core-level energies relative to the Fermi energy for each carbon atom in a full coverage F8H11SH SAM (left panel). The right panel shows the XP spectrum calculated from the individual C 1s energies of the SAM (black). Additionally, the measured HRXP spectrum of a full coverage F8H11SH SAM on Au(111) is shown (light blue). The measurements were performed with an incident photon energy of 580 eV. Five Gaussian peaks are fitted to the measured spectrum; the assignment of these peaks is discussed in the main text. While the core-level energies in the left panel are reported as calculated, the simulated spectrum has been stretched by a factor of 1.15 and subsequently shifted by 20.1 eV (binding energy = [εC1s,screenedEF] × 1.15 + 20.1 eV). As a consequence of that the left and right scales do not cover the same range of values. The experimental spectrum is reprinted with permission from ref (51).
Figure 4
Figure 4
DFT-calculated (screened) C 1s core-level energies relative to the Fermi energy for each carbon atom in a full coverage C10EC5 SAM (left panel). The reported C 1s energies and z-positions are averaged over the four molecules in the unit cell. The impact of this averaging is negligible, with typical (maximum) variations on the order of 0.01 eV (0.1 eV). The right side of the figure shows the XP spectrum calculated from the individual C 1s energies of the same SAM (black). Additionally, the measured HRXP spectrum of a full coverage C10EC5 SAM on Au(111) is shown (light blue). The measurements were performed with an incident photon energy of 580 eV. Four Gaussian peaks are fitted to the measured spectrum; the assignment of the obtained peaks is discussed in the main text. While the core-level energies in the left panel are reported as calculated, the simulated spectrum has been stretched by a factor of 1.15 and subsequently shifted by 20.1 eV (binding energy = [εC1s,screenedEF] × 1.15 + 20.1 eV). As a consequence of that, the left and right scales do not cover the same range of values. The experimental spectrum is reprinted with permission from ref (32).
Figure 5
Figure 5
Schematic illustration of the energy level alignment in the C10EC5 SAM. The core and valence levels of the bottom segment (1) and top segment (2) of the molecules are separated by an ordered two-dimensional array of dipoles. The associated shift in energy results in two different measured electron kinetic energies at the detector (Ekin1 and Ekin2). The green arrows symbolize the XPS measurement process with the incident photon energy hν. EF denotes the Fermi energy, which for zero bias is the same at the sample and detector sides of the setup in contrast to the vacuum energy Evac. The work function of the clean gold substrate is modified by the applied SAM to the resulting value Φ. For the sake of clarity, we assume an infinitely extended sample and detector; i.e., no distinction between the vacuum level directly above the sample and at a distance much larger than the sample dimensions is made, as this would not affect the differences in the kinetic energies of the photoelectrons.
Figure 6
Figure 6
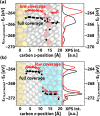
Calculated C 1s core-level energies of (a) C10EC5 and (b) F8H11SH in the full coverage SAMs (black) compared to the low-coverage situation (red). The molecular geometries are kept the same at both coverages (for further details see section 2). The right plot shows the XP spectra calculated from the individual 1s orbital energies of all carbons in the unit cell plotted without shifting and stretching of the original data, as we do not compare to experimental spectra here.
Figure 7
Figure 7
Calculated electron electrostatic energy for the full coverage C10EC5 SAM (molecular footprint of 22.3 Å2) shown on the left and the low coverage C10EC5 SAM (molecular footprint of 712.8 Å2) shown on the right; the potential is plotted in the plane containing the (essentially parallel) long molecular axes of two (of the four) neighboring molecules in the unit cell. The electrostatic energy is given with respect to the Fermi level of each system.

References

    1. Nuzzo R. G.; Allara D. L. Adsorption of Bifunctional Organic Disulfides on Gold Surfaces. J. Am. Chem. Soc. 1983, 105, 4481–4483. 10.1021/ja00351a063. - DOI
    1. Ulman A.An Introduction to Ultrathin Organic Films: From Langmuir-Blodgett to Self-Assembly; Academic Press: Boston, 1991.
    1. Love J. C.; Estroff L. A.; Kriebel J. K.; Nuzzo R. G.; Whitesides G. M. Self-Assembled Monolayers of Thiolates on Metals as a Form of Nanotechnology. Chem. Rev. 2005, 105, 1103–1170. 10.1021/cr0300789. - DOI - PubMed
    1. Feng X. J.; Jiang L. Design and Creation of Superwetting/Antiwetting Surfaces. Adv. Mater. 2006, 18, 3063–3078. 10.1002/adma.200501961. - DOI
    1. Gras S. L.; Mahmud T.; Rosengarten G.; Mitchell A.; Kalantar-zadeh K. Intelligent Control of Surface Hydrophobicity. ChemPhysChem 2007, 8, 2036–2050. 10.1002/cphc.200700222. - DOI - PubMed

LinkOut - more resources