. 2016 Mar 3;11(3):e0150936.
doi: 10.1371/journal.pone.0150936. eCollection 2016.

CHIR99021 enhances Klf4 Expression through β-Catenin Signaling and miR-7a Regulation in J1 Mouse Embryonic Stem Cells

Affiliations

CHIR99021 enhances Klf4 Expression through β-Catenin Signaling and miR-7a Regulation in J1 Mouse Embryonic Stem Cells

Zhiying Ai et al. PLoS One. .

Abstract

Understanding the mechanisms that regulate pluripotency of embryonic stem cells (ESCs) is important to ensure their safe clinical use. CHIR99021 (CHIR)-induced activation of Wnt/β-catenin signaling promotes self-renewal in mouse ESCs (mESCs). β-catenin functions individually or cooperates with transcription factors to activate stemness factors such as c-Myc, Esrrb, Pou5f1, and Nanog. However the relationship between the core pluripotent factor, Kruppel-like factor 4 (also known as GKLF or EZF) and Wnt/β-catenin signaling, remains ambiguous in J1 mESCs. DNA microarray analysis revealed that CHIR-treatment promoted pluripotency-maintaining transcription factors and repressed germ layer specification markers. CHIR also promoted genes related to the development of extracellular regions and the plasma membrane to maintain pluripotency of J1 mESCs. Among the CHIR-regulated genes, Klf4 has not been reported previously. We identified a novel cis element in the Klf4 gene that was activated by β-catenin in J1 mESCs. We determined that β-catenin interacted with this cis element, identifying Klf4 as a β-catenin target gene in this context. Moreover, several microRNAs that targeted the 3'-UTR of Klf4 mRNA were identified, with miR-7a being down-regulated by CHIR in a β-catenin-independent manner in J1 mESCs. These data collectively suggest that CHIR enhances Klf4 expression by repressing miR-7a expression or canonical Wnt pathway activation.


Conflict of interest statement

Competing Interests: The authors have declared that no competing interests exist.

Figures

Fig 1
Fig 1. CHIR99021 combined with LIF maintains J1 mESC pluripotency under feeder-free conditions.
(A): CHIR regulates pluripotent marker in J1 mESCs. J1 mESCs were treated with the indicated concentration of CHIR for 24 h. qPCR validation of Oct4, Nanog, Klf4, Tfcp2l1 and Axin2 using the comparative Ct method. Data are presented as the mean ± SD of three independent experiments (*p < 0.05; **p < 0.01). Gapdh was used to normalize template levels. (B): Western blot analysis of Oct4 and Nanog in J1 mESCs in the presence of 1,000 U/ml LIF and with or without 3 μM CHIR for 24 h. (C): Immunofluorescence staining of pluripotent markers. J1 mESCs were treated with or without 3 μM CHIR for 24 h, and pluripotent markers Oct4, Klf4, Nanog and Cdx2 were analyzed by immunofluorescence staining. Nuclei were stained with DAPI. Scale bars represent 50 μm. (D): Quantification of Oct4, Klf4, Nanog and Cdx2 signal intensities in DMSO- and CHIR-treated J1 mESCs by ImageJ software. Labeling intensity was expressed relative to that of the DMSO-treated mESCs (set as 1). The experiments were replicated 3 times. In each replication, n = 100–150 per group. *p < 0.05. (E): CHIR promoted compact colony morphology of J1 mESCs. J1 mESCs were treated with 3 μM CHIR or DMSO for 24 h, and cell morphology was detected under phase contrast microscopy. Scale bars represent 50 μm.
Fig 2
Fig 2. GO classification of differentially expressed genes.
(A): GO classification of the biological processes (BP). The GO term (FDR < 0.05) comparison of differently expressed genes (fold change > 2, p < 0.05) identified by gene expression microarray. Data are presented as a histogram of the relevant BP identified and shown as the−log p-value. (B): GO classification of the molecular function (MF) and cellular component (CC). GO classification of the MF and CC genes (fold change > 2, p < 0.05) using DAVID. Data are presented in a histogram of the relevant identified CC and MF, shown as the −logp-value.
Fig 3
Fig 3. CHIR influences Klf4 expression in ESCs.
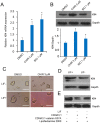
(A): CHIR promotes Klf4 mRNA expression. J1 mESCs were cultured in LIF-containing medium with or without 3 μM CHIR for 24 h, and Klf4 expression level was analyzed by RT-qPCR using the comparative Ct method. Gapdh was used to normalize template levels. Data are presented as the mean ± SD of three independent experiments (*p < 0.05; **p < 0.01). Small molecule BIO (1 μM) was used as a control. (B): CHIR promotes Klf4 expression. Representative western blot analysis of Klf4 in J1 mESCs in the presence of 1,000 U/ml LIF, with or without 3 μM CHIR. Small molecule BIO (1 μM) was used as control. Cell lysates were extracted and analyzed by western blot, the experiments were repeated for three times. The graph presents Klf4 levels normalized to corresponding Gapdh levels, error bar indicates standard deviation (*p < 0.05). (C): CHIR partly rescued the colony morphology changes without LIF. J1 mESCs were treated with 3 μM CHIR or DMSO with or without LIF for 24 h, cell morphology was detected under phase contrast microscopy. Scale bars represent 50 μm. (D): The expression of Klf4 is downregulated without LIF. Western blot analysis of Klf4 in J1 mESCs in the presence or absence of 1,000 U/ml LIF for 24 h. (E): β-catenin elevates Klf4 expression in the absence of LIF. J1 mESCs were transfected with β-catenin expression vector pCDNA3.1-β-catenin s37a and the negative control pCDNA3.1 in the presence or absence of LIF. At 48 h of incubation, Klf4 expression level was analyzed by western blot. Gapdh was used to normalize template levels.
Fig 4
Fig 4. CHIR influences Klf4 expression in F9 EC cells.
(A): CHIR promotes Klf4 mRNA expression. F9 EC cells were treated with CHIR at a final concentration of 3, 5, 10, 15 and 20 μM respectively for 24 h, and Klf4 expression level was analyzed by RT-qPCR using the comparative Ct method. Gapdh was used to normalize template levels. Data are presented as the mean ± SD of three independent experiments (*p < 0.05; **p < 0.01). (B): CHIR promotes Klf4 expression. Representative western blot analysis of Klf4 in F9 EC cells after treatment with or without different indicated concentrations of CHIR for 48 h. Cell lysates were extracted and analyzed by western blot. Relative expression levels were compared with Gapdh, the experiments were repeated for three times. (C): Quantification of Klf4 in CHIR-treated J1 mESCs. The graph presents Klf4 levels normalized to corresponding Gapdh levels. Labeling intensity was expressed relative to that of the DMSO-treated mESCs (set as 1), error bar indicates standard deviation (*p < 0.05; **p < 0.01).
Fig 5
Fig 5. CHIR regulates Klf4 expression by canonical Wnt pathway activation.
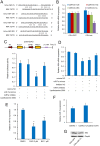
(A): TopFlash and FopFlash assay after CHIR treatment. J1 mESCs were transfected with pSuperTOPFlash reporter plasmids or the pTA-luc control plasmid. At 5 h after transfection, fresh medium was added and 3 μM CHIR or an equal volume of DMSO was added to the transfected cells. 24 h after transfection, luciferase activity was detected using the dual-luciferase reporter assay. (B): TopFlash and FopFlash assay after overexpression of β-catenin. pCMV-Myc or pCMV-Myc-β-catenin was co-transfected with pSuperTOPFlash reporter plasmids or pTA-luc control plasmid into J1 mESCs, followed by 24 h of incubation. Luciferase activity is expressed relative to that of pTA-luc. Data are presented as the mean ± SD of three independent experiments. (C): CHIR treatment or β-catenin overexpression promotes nuclear β-catenin expression. J1 mESCs were treated with 3 μM CHIR or equal volume of DMSO (upper panel), or transfected with pCDNA3.1-β-catenin s37a / pCDNA3.1 control plasmid (down panel) for 48 h, The nucleus protein were extracted and the expression of β-catenin was analyzed by western blot. Relative expression levels were compared with PCNA. (D): β-catenin knockdown. Cells were transfected with siRNA-β-catenin or NC for 48 h, and RT-qPCR (upper panel) or western blot (lower panel) was used to detect the knockdown efficiency of β-catenin. (E): Knockdown of β-catenin represses Klf4 expression. J1 mESCs were transfected with siRNA-β-catenin or siRNA-NC. At 5 h after transfection, fresh medium was added and 3 μM CHIR or an equal volume of DMSO was added to the transfected cells, followed by 48 h of incubation. Klf4 expression was validated by qPCR. Gapdh was used to normalize template levels. (F): A novel cis element in the Klf4 gene was activated by β-catenin. The cis-element (WT) and its mutational type (Mut) are shown in the upper panel. A schematic representation of the promoter structure of Klf4 is shown in the lower panel. Control plasmid pGL4.10 was co-transfected with pGL-Klf4 (−1124/+240) or pGL-Klf4 (−1081/+240) promoter reporter plasmid into J1 mESCs. At 5 h after transfection, fresh medium was changed and 3 μM CHIR or an equal volume of DMSO was added to the transfected cells, followed by 24 h of incubation. Luciferase activity is expressed relative to that of pGL4.10. Data are presented as the mean ± SD of three independent experiments. (G): Chromatin immunoprecipitation assay for the detection of cis-element in Klf4 gene. ChIP was performed using anti-β-catenin antibody and anti-IgG as a control antibody to detect enriched fragments. Data are presented as the mean ± SD of three independent experiments. (*p < 0.05; **p < 0.01).
Fig 6
Fig 6. Klf4 is directly targeted by miR-7a.
(A): Schematic of miRNA binding sites in the Klf4 gene. Presentation of miR-7a, miR-125, miR-152, and miR-363 target sites in the 3′-UTR of Klf4. The lines represent sequence alignment of predicted miRNA binding sites on Klf4 3′-UTR. (B): miRNAs regulate Klf4 expression. J1 mESCs were transfected with pCDH-CMV-pre-miRNA-EF1-coGFP or pCDH-CMV-MCS-EF1-coGFP control plasmid. After 24 h of incubation, Klf4 expression level was analyzed by RT-qPCR. Gapdh was used to normalize template levels. (C): miR-7a mimics regulate Klf4 expression in a post-transcriptional regulation manner. Schematic representation of the 3′-UTR reporter constructs in the upper panel. Abbreviations TK, hluc+, SV40 and hRluc represent HSV-TK promoter, firefly luciferase gene, SV40 early enhancer/promoter, and Renilla luciferase gene, respectively. In the lower panel, psiCHECK2-Klf4-3′UTR or psiCHECK2 control plasmids were co-transfected with mimics NC or miR-7a mimics/inhibitor into 293FT cells. At 36 h after incubation, luciferase activity was expressed relative to that of psiCHECK2. (D): miR-7a mimics regulates Klf4 expression. J1 mESCs were transfected with mimics NC or miR-7a mimics/inhibitor. At 36 h of incubation, Klf4 expression level was analyzed by RT-qPCR. Gapdh was used to normalize template levels. (E): CHIR and BIO inhibit miR-7a expression. J1 mESCs were cultured in LIF-containing medium with or without CHIR/BIO for 24 h, and miR-7a expression level was analyzed by RT-qPCR. U6 was used to normalize template levels. Data are presented as the mean ± SD of three independent experiments (*p < 0.05; **p < 0.01). (F): β-catenin does not influence miR-7a expression. J1 mESCs were transfected with β-catenin expression vector pCDNA3.1-β-catenin s37a and the negative control pCDNA3.1. At 48 h of incubation, miR-7a expression level was analyzed by RT-qPCR. Gapdh was used to normalize template levels. Data are presented as the mean ± SD of three independent experiments. (G): miR-7a represses Klf4 expression. J1 mESCs were transfected with miR-7a expression vector pCDH-mir-7a and the negative control pCDH-GFP. At 48 h of incubation, Klf4 expression level was analyzed by western blot. Gapdh was used to normalize template levels.

Similar articles

Cited by

References

    1. Smith AG. Embryo-derived stem cells: of mice and men. Annual review of cell and developmental biology. 2001;17:435–62. 10.1146/annurev.cellbio.17.1.435 . - DOI - PubMed
    1. Evans MJ, Kaufman MH. Establishment in culture of pluripotential cells from mouse embryos. Nature. 1981;292(5819):154–6. . - PubMed
    1. Ying QL, Nichols J, Chambers I, Smith A. BMP induction of Id proteins suppresses differentiation and sustains embryonic stem cell self-renewal in collaboration with STAT3. Cell. 2003;115(3):281–92. 10.1016/S0092-8674(03)00847-X. WOS:000186415000008. - DOI - PubMed
    1. Ying QL, Wray J, Nichols J, Batlle-Morera L, Doble B, Woodgett J, et al. The ground state of embryonic stem cell self-renewal. Nature. 2008;453(7194):519–23. 10.1038/nature06968 . - DOI - PMC - PubMed
    1. Bain J, Plater L, Elliott M, Shpiro N, Hastie CJ, McLauchlan H, et al. The selectivity of protein kinase inhibitors: a further update. The Biochemical journal. 2007;408(3):297–315. 10.1042/BJ20070797 - DOI - PMC - PubMed

Publication types

MeSH terms

Substances