. 2016 Mar 3;11(3):e0150550.
doi: 10.1371/journal.pone.0150550. eCollection 2016.

Identifying Likely Transmission Pathways within a 10-Year Community Outbreak of Tuberculosis by High-Depth Whole Genome Sequencing

Affiliations

Identifying Likely Transmission Pathways within a 10-Year Community Outbreak of Tuberculosis by High-Depth Whole Genome Sequencing

Alexander C Outhred et al. PLoS One. .

Abstract

Background: Improved tuberculosis control and the need to contain the spread of drug-resistant strains provide a strong rationale for exploring tuberculosis transmission dynamics at the population level. Whole-genome sequencing provides optimal strain resolution, facilitating detailed mapping of potential transmission pathways.

Methods: We sequenced 22 isolates from a Mycobacterium tuberculosis cluster in New South Wales, Australia, identified during routine 24-locus mycobacterial interspersed repetitive unit typing. Following high-depth paired-end sequencing using the Illumina HiSeq 2000 platform, two independent pipelines were employed for analysis, both employing read mapping onto reference genomes as well as de novo assembly, to control biases in variant detection. In addition to single-nucleotide polymorphisms, the analyses also sought to identify insertions, deletions and structural variants.

Results: Isolates were highly similar, with a distance of 13 variants between the most distant members of the cluster. The most sensitive analysis classified the 22 isolates into 18 groups. Four of the isolates did not appear to share a recent common ancestor with the largest clade; another four isolates had an uncertain ancestral relationship with the largest clade.

Conclusion: Whole genome sequencing, with analysis of single-nucleotide polymorphisms, insertions, deletions, structural variants and subpopulations, enabled the highest possible level of discrimination between cluster members, clarifying likely transmission pathways and exposing the complexity of strain origin. The analysis provides a basis for targeted public health intervention and enhanced classification of future isolates linked to the cluster.


Conflict of interest statement

Competing Interests: The authors have declared that no competing interests exist.

Figures

Fig 1
Fig 1. Matrix of M. tuberculosis variants associated with the outbreak.
Locations of all SNPs and indels found in the 22 isolates are shown in the colour-coded matrix. Deletions, or the absence of an insertion, are indicated with a single dash (-). Genome locations of variants are given for the reference strain H37Rv. Colour-coding of variants is based on differences from H37Rv, with all variants appearing in that isolate coded the same colour. This colour is then maintained when these variants appear in subsequent isolates, to help visualise patterns of SNP accumulation.
Fig 2
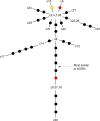
Fig 2. Unrooted maximum parsimony tree of variants.
The tree depicts the relative genetic distances between cluster isolates, estimated from maximum parsimony analyses performed on concatenated variants. Isolates that were genetically indistinguishable based on variant analyses are grouped together. Branch lengths are relative to the number of variants separating each isolate; individual SNPs, insertions, and deletions are represented by black, yellow, and red dots, respectively.
Fig 3
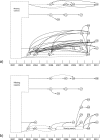
Fig 3. Transmission pathways derived from unrooted maximum parsimony tree.
Each circle (or node) represents a sequenced isolate. Nodes are positioned according to the year the original specimen was collected. Dashed lines connect nodes that are indistinguishable based on variant analyses. Solid lines indicate at least one observed variant between two nodes. Putative transmission events are indicated by arrows based on: (a) variant analyses and assumptions of no homoplasy and no introductions after 2003; and (b) variant analyses, no homoplasy, no introductions after 2003 and further epidemiological assumptions. The further epidemiological assumptions applied are (i) chronological transmission; (ii) transmission could not occur between cases that were diagnosed within 6 months of each other; and (iii) secondary cases arose within three years of exposure to a possible source case. The application of these assumptions indicated that at least two unidentified cases would have been required to sustain cluster transmission (“Missing Case(s)” boxes). However if, for example, the insertion found in the c15 library had arisen after transmission, then even with these assumptions no missing cases would be required later than 2003.
Fig 4
Fig 4. Low Frequency Variant Detection.
LoFreq was used to detect SNPs present at frequencies ≥ 10%. The top row indicates the SNP position in the reference genome H37Rv, the second row shows the nucleotide present in H37Rv, and the third row shows the variant nucleotide identified by LoFreq. The matrix indicates the frequencies of the SNPs detected in the isolates shown.
Fig 5
Fig 5. Bayesian inference tree from multiple sequence alignment of de novo-assembled cluster genomes and reference genomes.
A multiple sequence alignment of the H37Rv genome with repetitive elements censored (NC_000962.RRE), eight other lineage 4 reference genomes and the de novo assembled cluster libraries was used to generate Bayesian inference trees using BEAST. A consensus tree using relaxed clocks and the coalescent skyline population model is shown, with branch labels showing the probability of those subclades appearing in the sampled trees; substitutions per site appear on the y-axis. Subclades that appeared in less than half of the sampled trees are not shown. The SNPs that determine the characteristics of this tree are a subset of the variants shown in Fig 1.

References

    1. World Health Organization. Global tuberculosis report 2014 [Internet]. Geneva, Switzerland: World Health Organization; 2014. Available: http://www.who.int/tb/publications/global_report/en/.
    1. Marais BJ, Mlambo CK, Rastogi N, Zozio T, Duse AG, Victor TC, et al. Epidemic Spread of Multidrug-Resistant Tuberculosis in Johannesburg, South Africa. J Clin Microbiol. 2013;51: 1818–1825. 10.1128/JCM.00200-13 - DOI - PMC - PubMed
    1. Wilson DJ. Insights from Genomics into Bacterial Pathogen Populations. PLoS Pathog. 2012;8: e1002874 10.1371/journal.ppat.1002874 - DOI - PMC - PubMed
    1. Gardy JL, Johnston JC, Ho Sui SJ, Cook VJ, Shah L, Brodkin E, et al. Whole-genome sequencing and social-network analysis of a tuberculosis outbreak. New Engl J Med. 2011;364: 730–739. 10.1056/NEJMoa1003176 - DOI - PubMed
    1. Kato-Maeda M, Ho C, Passarelli B, Banaei N, Grinsdale J, Flores L, et al. Use of Whole Genome Sequencing to Determine the Microevolution of Mycobacterium tuberculosis during an Outbreak. PLoS ONE. 2013;8: e58235 10.1371/journal.pone.0058235 - DOI - PMC - PubMed