N-Hydroxyphthalimide exhibits antitumor activity by suppressing mTOR signaling pathway in BT-20 and LoVo cells
- PMID: 26940018
- PMCID: PMC4778274
- DOI: 10.1186/s13046-016-0315-1
N-Hydroxyphthalimide exhibits antitumor activity by suppressing mTOR signaling pathway in BT-20 and LoVo cells
Abstract
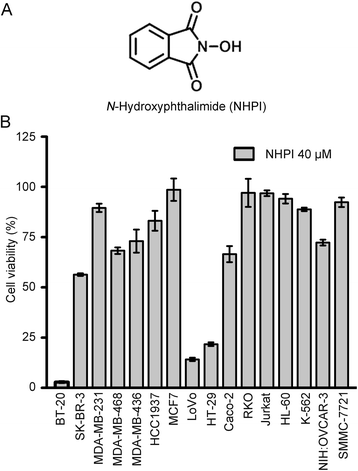
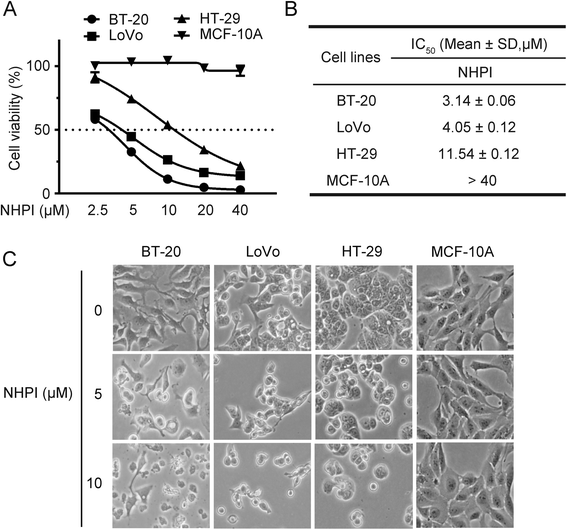
Background: N-Hydroxyphthalimide (NHPI), an important chemical raw material, was found to have potent and selective anti-proliferative effect on human breast carcinoma BT-20 cells, human colon adenocarcinoma LoVo and HT-29 cells during our screening for anticancer compounds. The purpose of this study is to assess the antitumor efficacy of NHPI in vitro and in vivo and to explore the underlying antitumor mechanism.
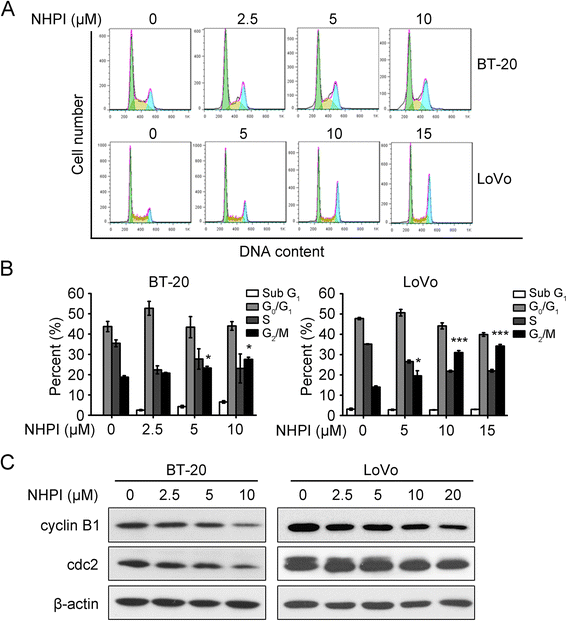
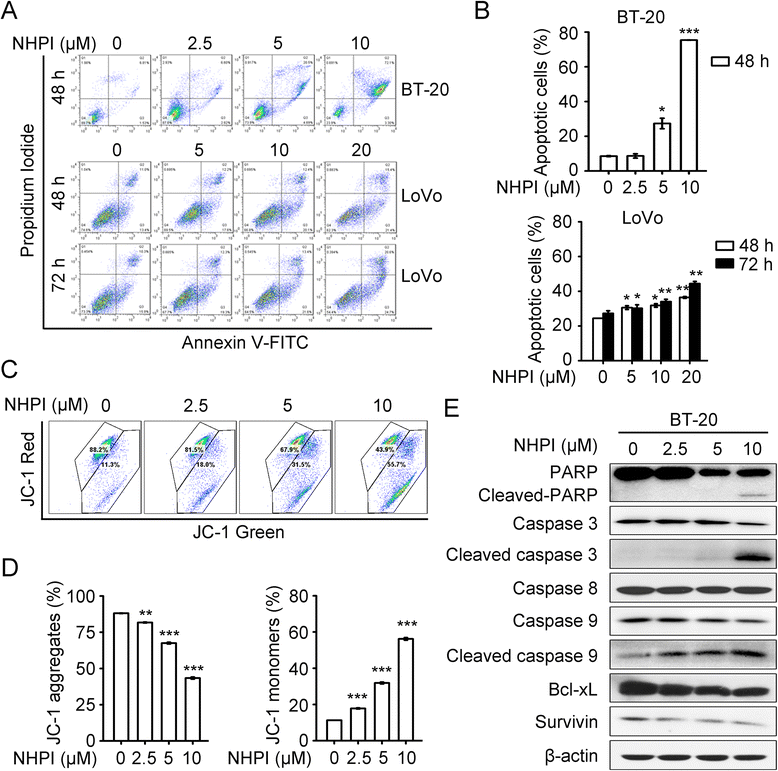
Methods: Cell cytotoxicity of NHPI was evaluated using MTS assay and cell morphological analysis. After NHPI treatment, cell cycle, apoptosis and mitochondrial membrane potential were analyzed using flow cytometer. The subcellular localization of eukaryotic initiation factor 4E (eIF4E) was analyzed by immunofluorescence assay. The antitumor efficacy of NHPI in vivo was tested in BT-20 xenografts. The underlying antitumor mechanisms of NHPI in vitro and in vivo were investigated with western blot analysis in NHPI-treated cancer cells and tumor tissues. Statistical significance was determined using Student's t-test.
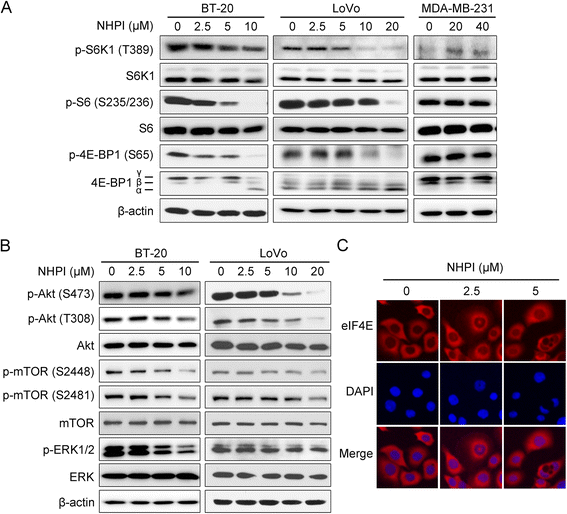
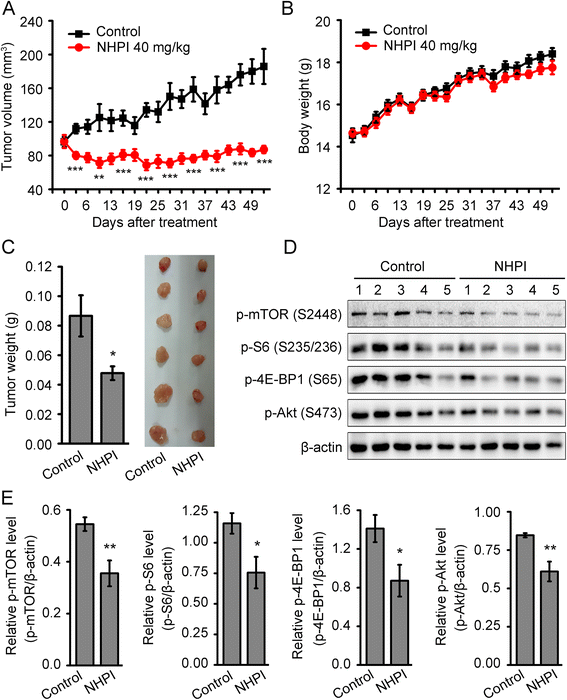
Results: In vitro, NHPI selectively inhibited the proliferation and induced G2/M phase arrest in BT-20 and LoVo cells, which was attributed to the inhibition of cyclin B1 and cdc2 expressions. Furthermore, NHPI induced apoptosis via mitochondrial pathway. Of note, NHPI effectively inhibited mammalian target of rapamycin (mTOR) complex 1 (mTORC1) and mTOR complex 2 (mTORC2) signaling, and overcame the feedback activation of Akt and extracellular signal-regulated kinase (ERK) caused by mTORC1 inhibition in BT-20 and LoVo cells. In vivo, NHPI inhibited tumor growth and suppressed mTORC1 and mTORC2 signaling in BT-20 xenografts with no obvious toxicity.
Conclusions: We found for the first time that NHPI displayed antitumor activity which is associated with the inhibition of mTOR signaling pathway. Our findings suggest that NHPI may be developed as a promising candidate for cancer therapeutics by targeting mTOR signaling pathway and as such warrants further exploration.
Figures
Similar articles
-
CGP57380 enhances efficacy of RAD001 in non-small cell lung cancer through abrogating mTOR inhibition-induced phosphorylation of eIF4E and activating mitochondrial apoptotic pathway.Oncotarget. 2016 May 10;7(19):27787-801. doi: 10.18632/oncotarget.8497. Oncotarget. 2016. PMID: 27050281 Free PMC article.
-
Identification of two novel inhibitors of mTOR signaling pathway based on high content screening.Cancer Chemother Pharmacol. 2013 Oct;72(4):799-808. doi: 10.1007/s00280-013-2255-1. Epub 2013 Aug 10. Cancer Chemother Pharmacol. 2013. PMID: 23934262
-
High prevalence of mTOR complex activity can be targeted using Torin2 in papillary thyroid carcinoma.Carcinogenesis. 2014 Jul;35(7):1564-72. doi: 10.1093/carcin/bgu051. Epub 2014 Feb 28. Carcinogenesis. 2014. PMID: 24583924
-
Disrupting the mTOR signaling network as a potential strategy for the enhancement of cancer radiotherapy.Curr Cancer Drug Targets. 2012 Oct;12(8):899-924. doi: 10.2174/156800912803251243. Curr Cancer Drug Targets. 2012. PMID: 22831276 Review.
-
Translational Landscape of mTOR Signaling in Integrating Cues Between Cancer and Tumor Microenvironment.Adv Exp Med Biol. 2020;1223:69-80. doi: 10.1007/978-3-030-35582-1_4. Adv Exp Med Biol. 2020. PMID: 32030685 Review.
Cited by
-
Seleno-short-chain chitosan induces apoptosis in human breast cancer cells through mitochondrial apoptosis pathway in vitro.Cell Cycle. 2018;17(13):1579-1590. doi: 10.1080/15384101.2018.1464845. Epub 2018 Aug 2. Cell Cycle. 2018. PMID: 29895197 Free PMC article.
-
Entrapment of N-Hydroxyphthalimide Carbon Dots in Different Topical Gel Formulations: New Composites with Anticancer Activity.Pharmaceutics. 2019 Jul 1;11(7):303. doi: 10.3390/pharmaceutics11070303. Pharmaceutics. 2019. PMID: 31266139 Free PMC article.
-
Autophagy inhibition enhances the inhibitory effects of ursolic acid on lung cancer cells.Int J Mol Med. 2020 Nov;46(5):1816-1826. doi: 10.3892/ijmm.2020.4714. Epub 2020 Aug 28. Int J Mol Med. 2020. PMID: 32901853 Free PMC article.
-
The role of trace N-Oxyl compounds as redox mediator in enhancing antiviral ribavirin elimination in UV/Chlorine process.Appl Catal B. 2022 Nov 15;317:121709. doi: 10.1016/j.apcatb.2022.121709. Epub 2022 Jul 5. Appl Catal B. 2022. PMID: 35812172 Free PMC article.
-
Thiazole, Isatin and Phthalimide Derivatives Tested in vivo against Cancer Models: A Literature Review of the Last Six Years.Curr Med Chem. 2024;31(20):2991-3032. doi: 10.2174/0929867330666230426154055. Curr Med Chem. 2024. PMID: 37170994 Review.
References
-
- Watanabe R, Wei L, Huang J. mTOR signaling, function, novel inhibitors, and therapeutic targets. J Nucl Med. 2011;52:497–500. - PubMed
Publication types
MeSH terms
Substances
LinkOut - more resources
Full Text Sources
Other Literature Sources
Molecular Biology Databases
Miscellaneous

