. 2016 Mar 4:7:10778.
doi: 10.1038/ncomms10778.

Two-colour live-cell nanoscale imaging of intracellular targets

Affiliations

Two-colour live-cell nanoscale imaging of intracellular targets

Francesca Bottanelli et al. Nat Commun. .

Abstract

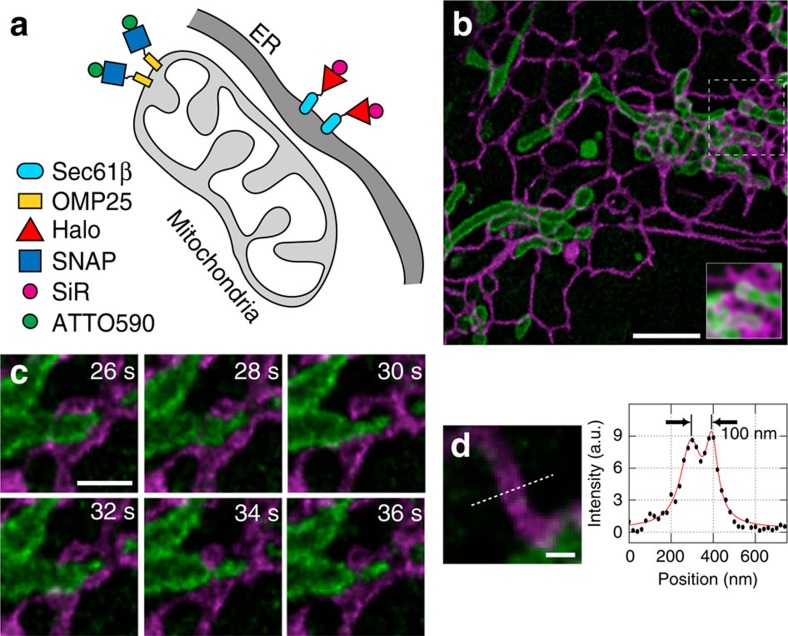
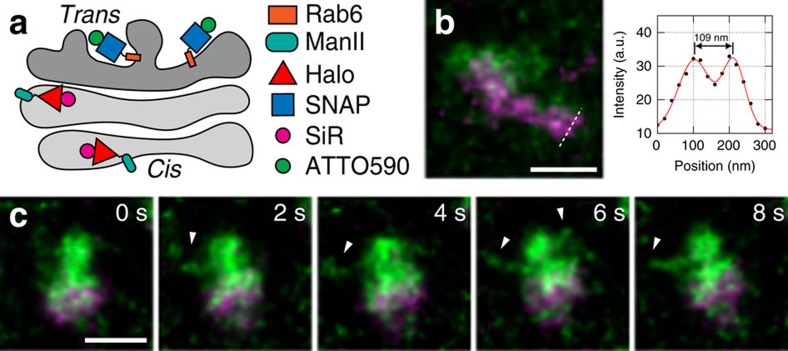
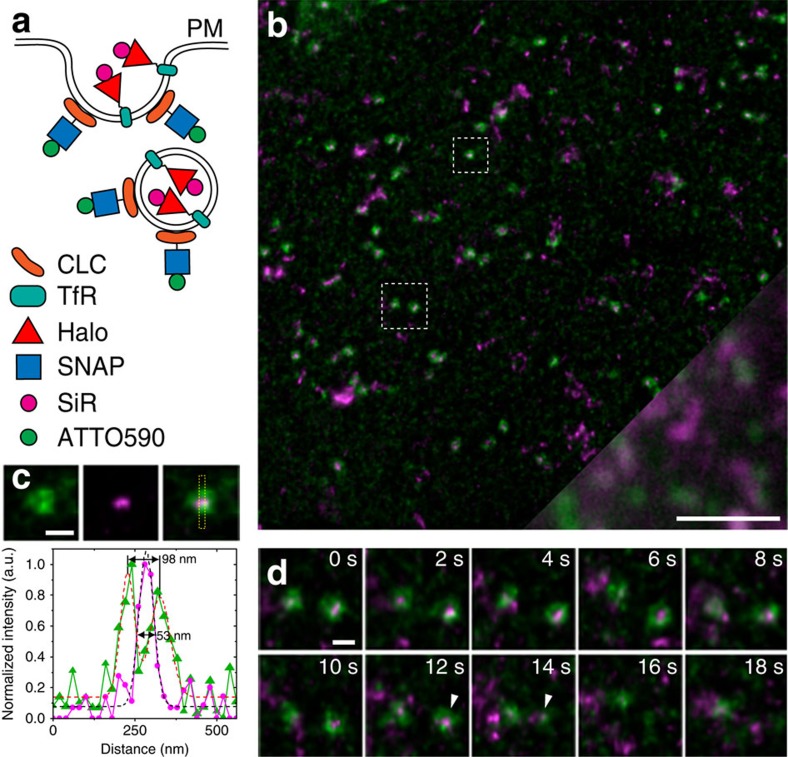
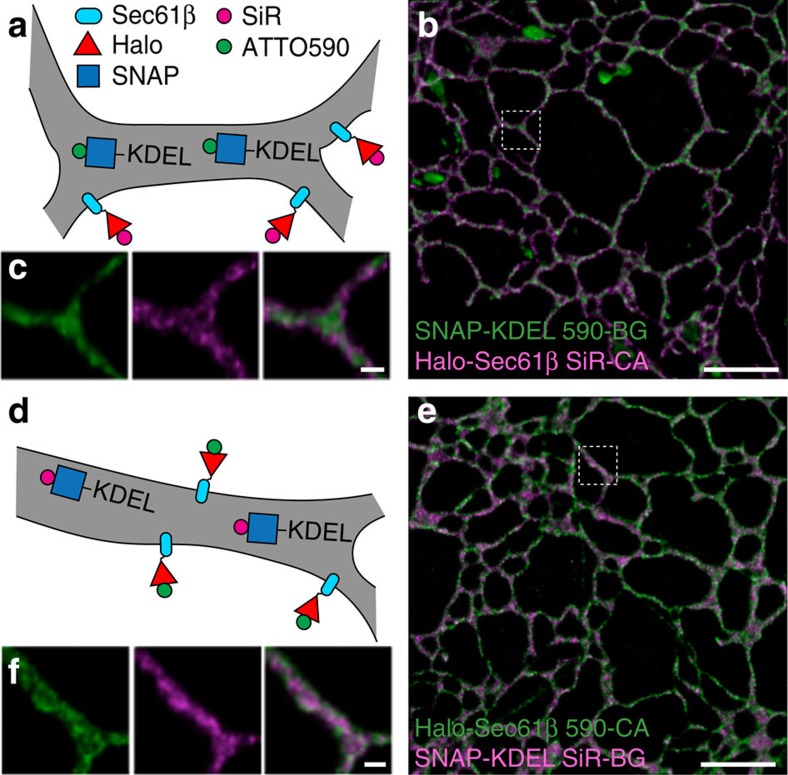
Stimulated emission depletion (STED) nanoscopy allows observations of subcellular dynamics at the nanoscale. Applications have, however, been severely limited by the lack of a versatile STED-compatible two-colour labelling strategy for intracellular targets in living cells. Here we demonstrate a universal labelling method based on the organic, membrane-permeable dyes SiR and ATTO590 as Halo and SNAP substrates. SiR and ATTO590 constitute the first suitable dye pair for two-colour STED imaging in living cells below 50 nm resolution. We show applications with mitochondria, endoplasmic reticulum, plasma membrane and Golgi-localized proteins, and demonstrate continuous acquisition for up to 3 min at 2-s time resolution.


Conflict of interest statement

J.B. discloses financial interest in Bruker Corp. and Hamamatsu Photonics. The remaining authors declare no competing financial interests.

Figures

Figure 1
Figure 1. STED nanoscopy of dynamic interactions between ER and mitochondria.
(a) Strategy for labelling ER (Halo-Sec61β with SiR-CA, magenta) and mitochondria (SNAP-OMP25 with 590-BG, green). (b) The first frame from a live-cell STED image sequence of a correspondingly labelled COS-7 cell. For comparison between STED and confocal imaging, the inset shows a Gaussian-blurred (full-width at half-maximum=250 nm) version of the raw image data in the boxed region. (c) Region of interest showing a dynamic interaction between the ER and a mitochondrion. (d) A line profile through an ER tubule demonstrates that the lumen of the ∼100-nm-wide tubule can be distinguished from its membrane. Scale bars, b=2 μm; c=500 nm; d=200 nm. Images were derived from the same image sequence. Imaging was performed at 37 °C. All images were corrected for bleaching and deconvolved, while the line profile represents raw image data.
Figure 2
Figure 2. Golgi protein dynamics imaged by live-cell STED nanoscopy.
(a) Strategy for labelling cis/medial-Golgi (ManII-Halo with SiR-CA, magenta) and trans-Golgi (SNAP-Rab6 with 590-BG, green). (b) A line profile through a correspondingly labelled Golgi ministack in a nocodazole-treated HeLa cell shows two distinct structures within the cis/medial-Golgi (potentially, separate cisternae). (c) Image sequence showing transient tubular structures on a Golgi ministack as indicated by white arrowheads. Scale bars, 500 nm. Imaging was performed at 37 °C. All images were corrected for bleaching and deconvolved, while the line profile represents raw image data.
Figure 3
Figure 3. STED nanoscopy imaging of CCPs at the plasma membrane (PM).
(a) Strategy for labelling CCPs (SNAP-CLC with 590-BG, green) and the endocytic cargo transferrin receptor (TfR-FM4-Halo with SiR-CA, magenta). (b) First frame from a live STED image sequence of COS-7 cells. The bottom right corner shows the comparison between STED and an equivalent field of view imaged in confocal mode. (c) Magnified region of interest (small box in b) with line profile as indicated by yellow box. (d) Region of interest (large box in b) showing a putative clathrin-mediated endocytic event (indicated by arrowheads). Scale bars, b=2 μm; c,d=200 nm. Imaging was performed at 22 °C. All images were corrected for bleaching and deconvolved, while the line profile represents raw image data.
Figure 4
Figure 4. Two-colour STED nanoscopy of the ER.
(a,d) Strategy for labelling ER membrane (Halo-Sec61β) and ER lumen (SNAP-KDEL). COS-7 cells expressing the above mentioned fusion proteins were then labelled with 590-BG and SiR-CA (ac) and 590-CA and SiR-BG (df). (c,f) Magnified regions of interest (indicated by white boxes) from b and e, respectively. Scale bars, b,e=2 μm; c,f=200 nm. Imaging was performed at 22 °C. All images were deconvolved and corrected for bleaching.

References

    1. Hell S. W. & Wichmann J. Breaking the diffraction resolution limit by stimulated emission: stimulated-emission-depletion fluorescence microscopy. Opt. Lett. 19, 780–782 (1994). - PubMed
    1. Eggeling C., Willig K. I., Sahl S. J. & Hell S. W. Lens-based fluorescence nanoscopy. Q. Rev. Biophys. 48, 178–243 (2015). - PubMed
    1. Tonnesen J., Nadrigny F., Willig K. I., Wedlich-Soldner R. & Nagerl U. V. Two-color STED microscopy of living synapses using a single laser-beam pair. Biophys. J. 101, 2545–2552 (2011). - PMC - PubMed
    1. Bethge P., Chereau R., Avignone E., Marsicano G. & Nagerl U. V. Two-photon excitation STED microscopy in two colors in acute brain slices. Biophys. J. 104, 778–785 (2013). - PMC - PubMed
    1. Gottfert F. et al.. Coaligned dual-channel STED nanoscopy and molecular diffusion analysis at 20 nm resolution. Biophys. J. 105, L1–L3 (2013). - PMC - PubMed

Publication types