. 2016 Mar 4:6:22592.
doi: 10.1038/srep22592.

Intra-epidemic evolutionary dynamics of a Dengue virus type 1 population reveal mutant spectra that correlate with disease transmission

Affiliations

Intra-epidemic evolutionary dynamics of a Dengue virus type 1 population reveal mutant spectra that correlate with disease transmission

Hapuarachchige Chanditha Hapuarachchi et al. Sci Rep. .

Abstract

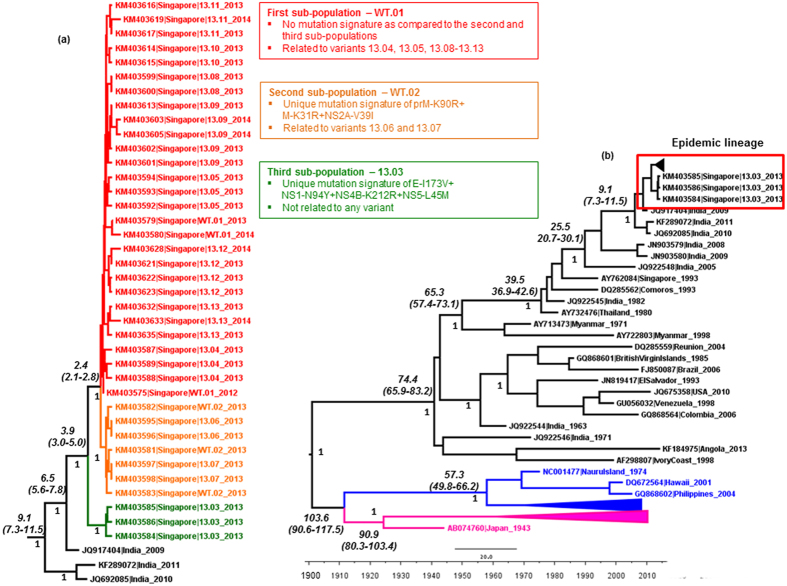
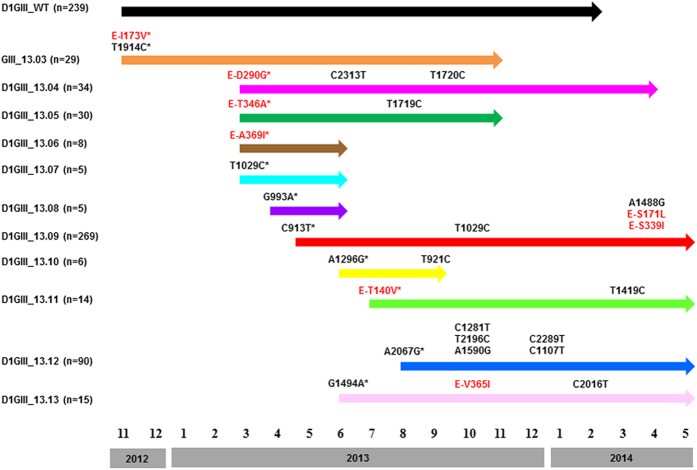
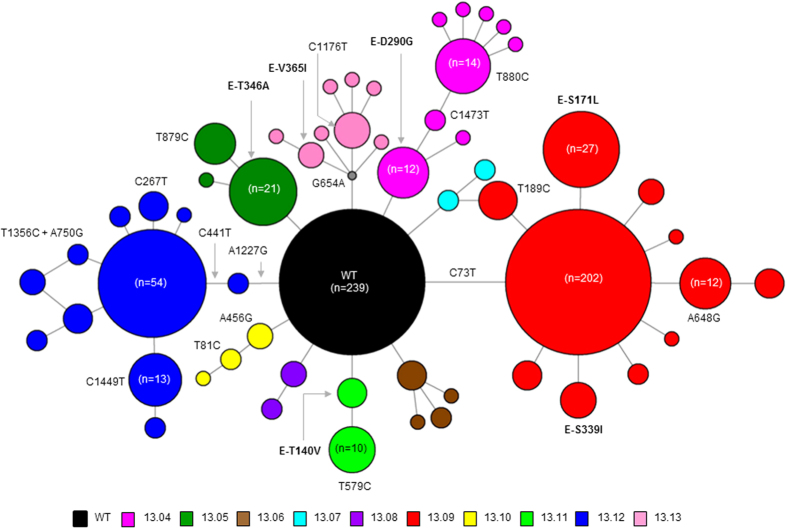
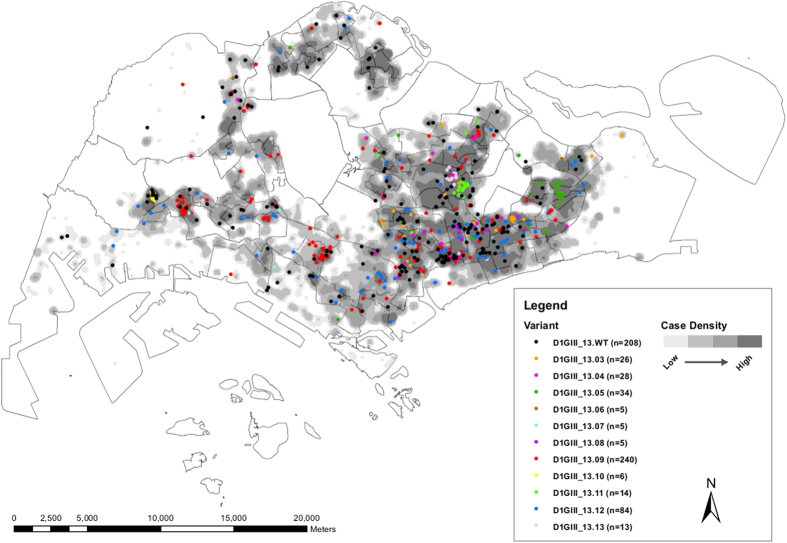
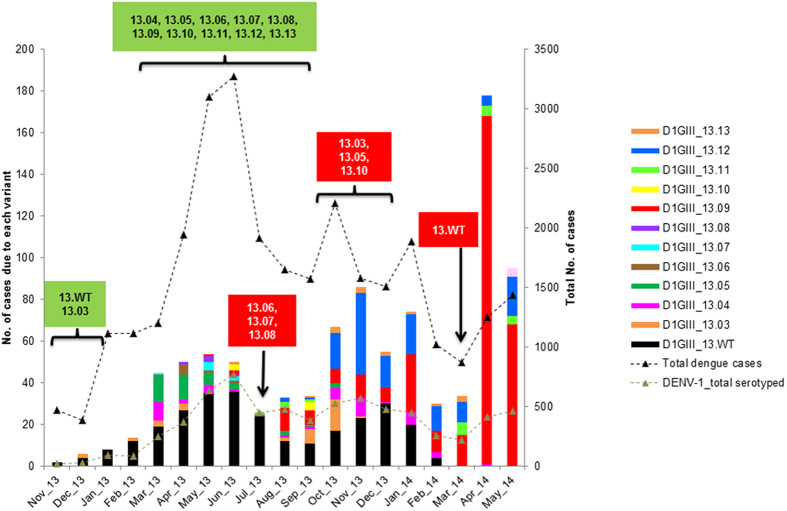
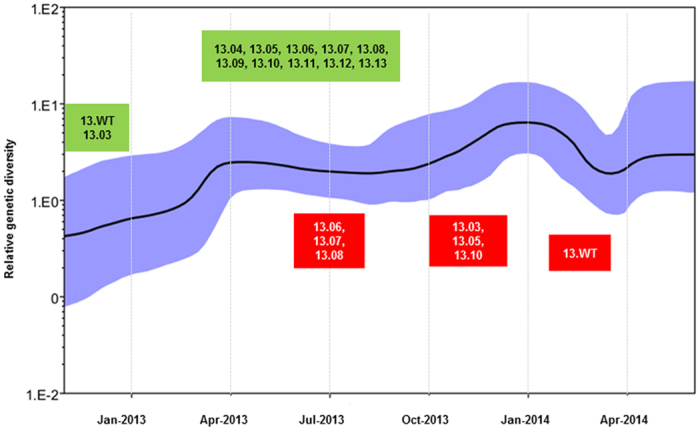
Dengue virus (DENV) is currently the most prevalent mosquito-borne viral pathogen. DENVs naturally exist as highly heterogeneous populations. Even though the descriptions on DENV diversity are plentiful, only a few studies have narrated the dynamics of intra-epidemic virus diversity at a fine scale. Such accounts are important to decipher the reciprocal relationship between viral evolutionary dynamics and disease transmission that shape dengue epidemiology. In the current study, we present a micro-scale genetic analysis of a monophyletic lineage of DENV-1 genotype III (epidemic lineage) detected from November 2012 to May 2014. The lineage was involved in an unprecedented dengue epidemic in Singapore during 2013-2014. Our findings showed that the epidemic lineage was an ensemble of mutants (variants) originated from an initial mixed viral population. The composition of mutant spectrum was dynamic and positively correlated with case load. The close interaction between viral evolution and transmission intensity indicated that tracking genetic diversity through time is potentially a useful tool to infer DENV transmission dynamics and thereby, to assess the epidemic risk in a disease control perspective. Moreover, such information is salient to understand the viral basis of clinical outcome and immune response variations that is imperative to effective vaccine design.


Figures

Figure 1
Figure 1. Phylogenetic and tMRCA analysis of the epidemic lineage and DENV-1 genotypes.
The maximum clade credibility tree was constructed using the Bayesian Markov Chain Monte Carlo (MCMC) method implemented in the BEAST package v1.7.4. The analysis included 38 complete polyprotein sequences generated during this study and 44 sequences retrieved from GenBank database. Only a subset of complete poplyprotein sequences representative of each variant was included in the phylogeny to make the tree concise. (a). The analysis of epidemic lineage. The first and second sub-populations of wild-type isolates ancestral to variants 13.04–13.13 are indicated with taxa name WT.01 and WT.02 respectively. The figure demonstrates the genetic relatedness of each variant to the first (red), second (orange) and third (green) sub-populations. (b). Phylogeny and tMRCA analysis of DENV genotypes. Genotypes I, II and III are shown in purple, blue and black respectively. The epidemic lineage is shown in the red box. Numbers shown on branches are posterior probability values (non-italics) of major nodes and tMRCA values in years (italics). The 95% HPD values are shown within brackets. All sequences are named with accession number, country of origin and year of isolation. In addition, the taxon names of study isolates include the variant identity.
Figure 2
Figure 2. Envelope (E) gene mutation map of DENV-1 genotype III epidemic strains/variants.
The analysis included 744 complete E gene sequences generated from November 2012 to end of May 2014. The figure illustrates temporal pattern of emergence, maintenance and extinction of each variant during the study period. Arrows indicate the transmission period of each variant. A timeline is given below the figure with numbers 1–12 to represent January to December in respective years. Substitutions shown are the E gene based signature mutations of each variant. Initial substitutions were named as founder (primary) substitutions and have been shown with an asterisk. Those that appeared later in respective variants were named as non-founder (secondary) substitutions (without an asterisk) in the text. Those shown in red are “fixed” non-synonymous substitutions. Remaining residues are “fixed” synonymous substitutions. Positions of all amino acid substitutions are shown at the E gene level, whereas the synonymous substitutions are numbered from the beginning of the structural polyprotein. D1GIII = DENV-1 genotype III, n = number of sequences belonging to each variant, WT = wild type isolates.
Figure 3
Figure 3. Envelope (E) gene based median-joining network of epidemic variants.
The network was drawn in Network version 4.6.1.2 using 715 complete E gene sequences of DENV-1 genotype III strains generated during the epidemic. Only wild type isolates and variants 13.04–13.13, but not variant 13.03, were included in the analysis as all variants except 13.03 were shown to be originated from wild type isolates in-situ. All variants were colour-coded as shown in the legend. Circles represent either individual isolates or clusters. The diameter of each circle is proportional to the number of isolates within each circle. The length of lines linking circles is not proportional to the mutational distance between them. Grey node represents a hypothetical ancestral strain or a strain present in the population but not sampled.
Figure 4
Figure 4. Geospatial distribution of variants of the epidemic lineage.
The coordinates of reported locations available on 668 genotyped strains of epidemic lineage detected from November 2012 to end of May 2014 were mapped using the ArcGIS 10.1 ArcMap software (http://www.esri.com/software/arcgis/arcgis10/; ESRI, CA, USA). Each variant is colour-coded as shown in the figure legend. Shaded areas represent the distribution of dengue cases in a density gradient as indicated in the legend. Case density was calculated using the Kernel Density Tool in ArcGIS 10.1 ArcMap software (ESRI, CA, USA). Density values were classified into four classes, namely below 25th (low in lightest tone), 26th–50th, 51st–75th and more than 75th (high in darkest tone) quantiles, using the quantile classification method. n = number of cases per variant used in the analysis.
Figure 5
Figure 5. Crystal structures of E, M, NS3 and NS5 proteins showing substituted positions.
(a) X-ray crystal structure (PDB: 3J2P) showing three domains of the E and M proteins. ED1 in red, EDII in yellow and EDIII in blue ribbons, E transmembrane in cyan. Substituted positions 140, 158, 171, 173, 290, 339, 346, 365, 369 in the E protein are colored in green. Positions 31 and 47 from the M protein (in orange ribbon) are colored in red and cyan, respectively. (b) NS3 protein (PDB: 2JLV) in complex with ssRNA (highlighted in magenta) and 5′-adenylyl-β, γ-imidodiphosphate (AMP-PNP). Positions 202, 261 and 325 are highlighted in red. (c) The NS5 protein (PDB: 4C11) RNA-dependent RNA polymerase (RdRP) domain. The RdRP palm is in gray, fingers in magenta, thumb in blue, and the priming loop is in yellow. Substituted positions 270, 634, 871 are highlighted in red.
Figure 6
Figure 6. Correlation between viral diversity and disease transmission.
The figure shows the comparison of temporal fluctuation between the number of variants and total number of cases on a monthly basis. The analysis included respective data collected from November 2012 to May 2014.
Figure 7
Figure 7. Temporal variation of virus diversity and emergence/disappearance of variants.
Bayesian skyline plot was generated in the BEAST package v1.7.4 using a TN93+I+G substitution model together with an uncorrelated log-normal relaxed molecular clock and a Bayesian skyline coalescent model. One hundred million generations of MCMC chains were run with sampling at every 10,000 generations. The black line illustrates the fluctuations in median genetic diversity over time and the shaded area represents 95% highest posterior density (HPD) values. Green and red boxes indicate the time of emergence and extinction of variants included within each box respectively. D1GIII = DENV-1 genotype III; n = number of sequences per each variant used in the analysis; WT = wild type.

Similar articles

Cited by

References

    1. Bhatt S. et al. The global distribution and burden of dengue. Nature 496, 504–7 (2013). - PMC - PubMed
    1. Gubler D. J. Dengue and dengue hemorrhagic fever. Clin Microbiol Rev 11, 480–496 (1998). - PMC - PubMed
    1. Simmons C. P., Farrar J. J., Nguyen v. V. & Wills B. Dengue. N Engl J Med 366, 1423–32 (2012). - PubMed
    1. Steinhauer D. A., Domingo E. & Holland J. J. Lack of evidence for proofreading mechanisms associated with an RNA virus polymerase. Gene 122, 281–8 (1992). - PubMed
    1. Behura S. K. & Severson D. W. Nucleotide substitutions in dengue virus serotypes from Asian and American countries: insights into intracodon recombination and purifying selection. BMC Microbiol 13, 37 (2013). - PMC - PubMed

Publication types