. 2016 Mar 25;351(6280):1454-1458.
doi: 10.1126/science.aad9024. Epub 2016 Mar 3.

Activation of proto-oncogenes by disruption of chromosome neighborhoods

Affiliations

Activation of proto-oncogenes by disruption of chromosome neighborhoods

Denes Hnisz et al. Science. .

Abstract

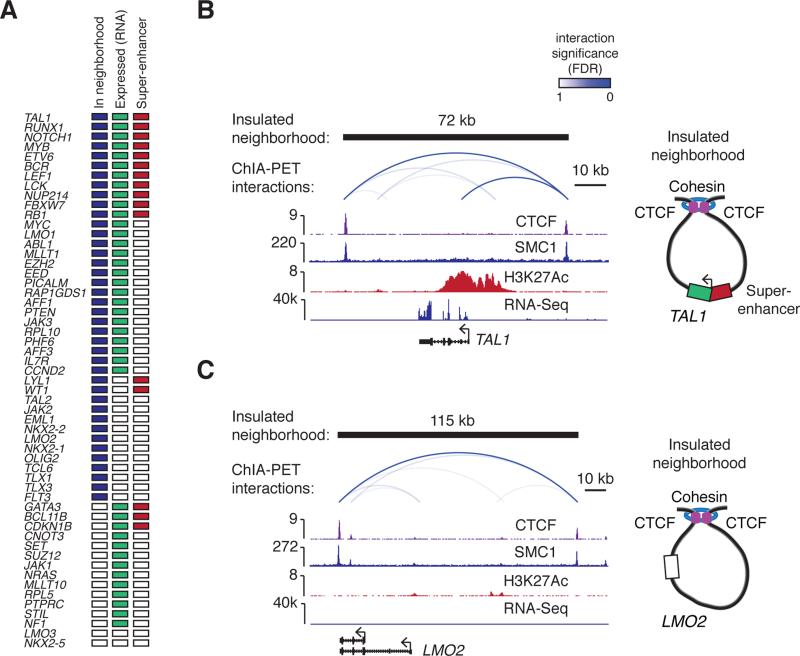
Oncogenes are activated through well-known chromosomal alterations such as gene fusion, translocation, and focal amplification. In light of recent evidence that the control of key genes depends on chromosome structures called insulated neighborhoods, we investigated whether proto-oncogenes occur within these structures and whether oncogene activation can occur via disruption of insulated neighborhood boundaries in cancer cells. We mapped insulated neighborhoods in T cell acute lymphoblastic leukemia (T-ALL) and found that tumor cell genomes contain recurrent microdeletions that eliminate the boundary sites of insulated neighborhoods containing prominent T-ALL proto-oncogenes. Perturbation of such boundaries in nonmalignant cells was sufficient to activate proto-oncogenes. Mutations affecting chromosome neighborhood boundaries were found in many types of cancer. Thus, oncogene activation can occur via genetic alterations that disrupt insulated neighborhoods in malignant cells.


Figures

Fig. 1
Fig. 1. 3D regulatory landscape of the T-ALL genome
(A) Mechanisms activating proto-oncogenes. (B) Hi-C interaction map and TADs defined in hESC (H1), and cohesin ChIA-PET interactions (intensity of blue arc represents interaction significance), CTCF and H3K27Ac ChIP-Seq profiles and peaks, and RNA-Seq in Jurkat cells at the CD3D locus. ChIP-Seq peaks are denoted as bars above ChIP-Seq profiles. (C) ChIA-PET interactions at the RUNX1 locus displayed above the ChIP-Seq profiles of CTCF, cohesin (SMC1) and H3K27Ac.
Fig. 2
Fig. 2. Active oncogenes and silent proto-oncogenes occur in insulated neighborhoods
(A) T-ALL Pathogenesis Genes. Colored boxes indicate whether a gene is located within a neighborhood, expressed and associated with a super-enhancer. (B) Insulated neighborhood at the active TAL1 locus. The cohesin ChIA-PET interactions are displayed above the ChIP-Seq profiles of CTCF, cohesin (SMC1) H3K27Ac, and RNA-Seq track. A model of the insulated neighborhood is shown on the right. (C) Insulated neighborhood at the silent LMO2 locus.
Fig. 3
Fig. 3. Disruption of insulated neighborhood boundaries is linked to proto-oncogene activation
(A) Cohesin ChIA-PET interactions, CTCF and cohesin (SMC1) binding profiles at the TAL1 locus in Jurkat cells. Patient deletions described in (22) are shown as bars below the gene models. The deletion on the bottom indicates the minimally deleted region identified in (26). (B) ChIP-Seq profiles of CTCF, H3K27Ac, p300 and CBP, and RNA-Seq at the TAL1 locus in HEK-293T cells. The region deleted using a CRISPR/Cas9-based approach is highlighted in a grey box. (C) qRT-PCR analysis of TAL1 expression in wild type HEK-293T cells (wt), and in cells where the neighborhood boundary highlighted on (B) was deleted. (D) Model of the neighborhood and perturbation at the TAL1 locus. (E) 5C contact matrices in wild type HEK-293T cells and TAL1 neighborhood boundary – deleted cells. The position of the region removed in the mutant cells is highlighted with an arrow. (F) Distance adjusted z-score difference (5C) maps at the TAL1 locus (ΔCTCF - wild type HEK-293T). Note the increase in the 5C signal adjacent to the deleted region. CTCF and H3K27Ac binding profiles in wt cells are displayed for orientation. (G) Cohesin ChIA-PET interactions, CTCF and cohesin (SMC1) binding profiles at the LMO2 locus. Patient deletions described in (22) are shown as bars below the gene models. (H) ChIP-Seq binding profile of CTCF and H3K27Ac, p300 and CBP, and RNA-Seq at the LMO2 locus in HEK-293T cells. The region deleted by a CRISPR/Cas9-based approach is highlighted in a grey box. (I) qRT-PCR analysis of LMO2 expression in wild type HEK-293T cells (wt), and in cells where the neighborhood boundary highlighted on (H) was deleted. (J) Model of the neighborhood and perturbation at the LMO2 locus (K) 5C contact matrices in wild type HEK-293T cells and LMO2 neighborhood boundary – deleted cells. The position of the region removed in the mutant cells is highlighted with an arrow. (L) Distance adjusted z-score difference (5C) maps at the LMO2 locus (ΔCTCF - wild type HEK-293T). Note the increase in the 5C signal adjacent to the deleted region. CTCF and H3K27Ac binding profiles in wt cells are displayed for orientation. On (C) and (I) data from n=3 independent biological replicates are displayed as mean + SD; P<0.01 between wt and boundary-deleted cells (two-tailed t-test).
Fig. 4
Fig. 4. Somatic mutations of neighborhood boundaries occur in many cancers
(A) “Constitutive neighborhood” at the NOTCH1 locus. CTCF ChIP-Seq and cohesin ChIA-PET interactions in Jurkat (T-ALL), GM12878 (lymphoblastoid) and K562 (CML) cells are displayed. (B) Frequency of somatic mutations in the ICGC database at CTCF sites that form constitutive neighborhood boundaries (left), and CTCF sites that do not form neighborhood boundaries (right). (C-D) Somatic mutations in (C) esophageal adenocarcinoma (ESAD-UK) and (D) hepatocellular carcinoma (LIRI-JP) at constitutive neighborhood boundary CTCF sites. (E-F) Genes in constitutive neighborhoods whose boundary is recurrently mutated in (E) esophageal adenocarcinoma and in (F) hepatocellular carcinoma. The bars depict the number of mutations in the neighborhood boundary site. Proto-oncogenes annotated in the Cancer Gene Census are highlighted in red. (G-H) Mutations in the boundary sites of the neighborhood containing (G) the LMO1 proto-oncogene in esophageal adenocarcinoma, and (H) the FGFR1 proto-oncogene in hepatocellular carcinoma. The enrichment of mutations at the constitutive neighborhood boundary sites (+/−5bp of the motif) displayed on (B-D) compared to regions flanking the binding sites has a P-value <10−4 (permutation test).

Comment in

  • CANCER. The oncogene makes its escape.
    Wala J, Beroukhim R. Wala J, et al. Science. 2016 Mar 25;351(6280):1398-9. doi: 10.1126/science.aaf5542. Science. 2016. PMID: 27013717 Free PMC article. No abstract available.

References

    1. Vogelstein B, Kinzler KW. Cancer genes and the pathways they control. Nature medicine. 2004 Aug;10:789. - PubMed
    1. Vogelstein B, et al. Cancer genome landscapes. Science. 2013 Mar 29;339:1546. - PMC - PubMed
    1. Garraway LA, Lander ES. Lessons from the cancer genome. Cell. 2013 Mar 28;153:17. - PubMed
    1. Croce CM. Oncogenes and cancer. The New England journal of medicine. 2008 Jan 31;358:502. - PubMed
    1. Kagey MH, et al. Mediator and cohesin connect gene expression and chromatin architecture. Nature. 2010 Sep 23;467:430. - PMC - PubMed

Publication types

Associated data