. 2016 Mar 8;67(9):1074-1086.
doi: 10.1016/j.jacc.2015.12.035.

Evidence for Mechanisms Underlying the Functional Benefits of a Myocardial Matrix Hydrogel for Post-MI Treatment

Affiliations

Evidence for Mechanisms Underlying the Functional Benefits of a Myocardial Matrix Hydrogel for Post-MI Treatment

Jean W Wassenaar et al. J Am Coll Cardiol. .

Abstract

Background: There is increasing need for better therapies to prevent the development of heart failure after myocardial infarction (MI). An injectable hydrogel derived from decellularized porcine ventricular myocardium has been shown to halt the post-infarction progression of negative left ventricular remodeling and decline in cardiac function in both small and large animal models.

Objectives: This study sought to elucidate the tissue-level mechanisms underlying the therapeutic benefits of myocardial matrix injection.

Methods: Myocardial matrix or saline was injected into infarcted myocardium 1 week after ischemia-reperfusion in Sprague-Dawley rats. Cardiac function was evaluated by magnetic resonance imaging and hemodynamic measurements at 5 weeks after injection. Whole transcriptome microarrays were performed on RNA isolated from the infarct at 3 days and 1 week after injection. Quantitative polymerase chain reaction and histologic quantification confirmed expression of key genes and their activation in altered pathways.

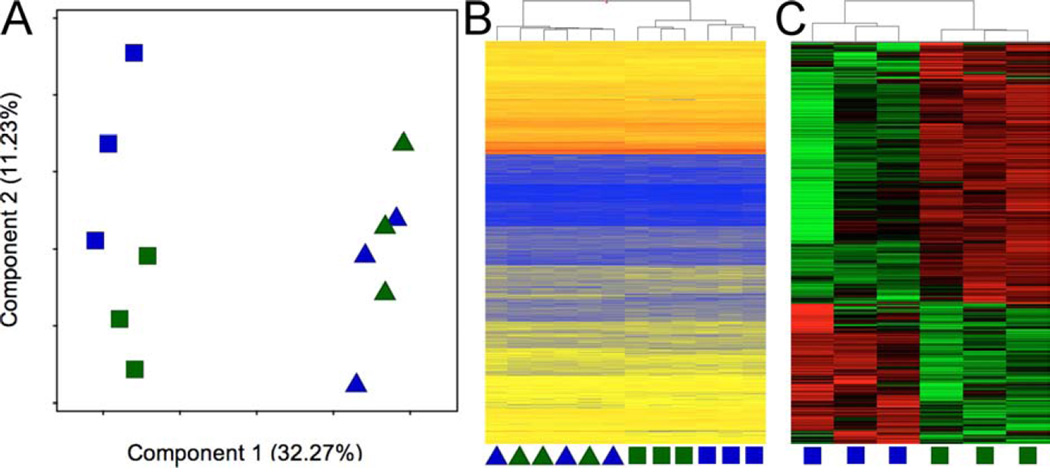
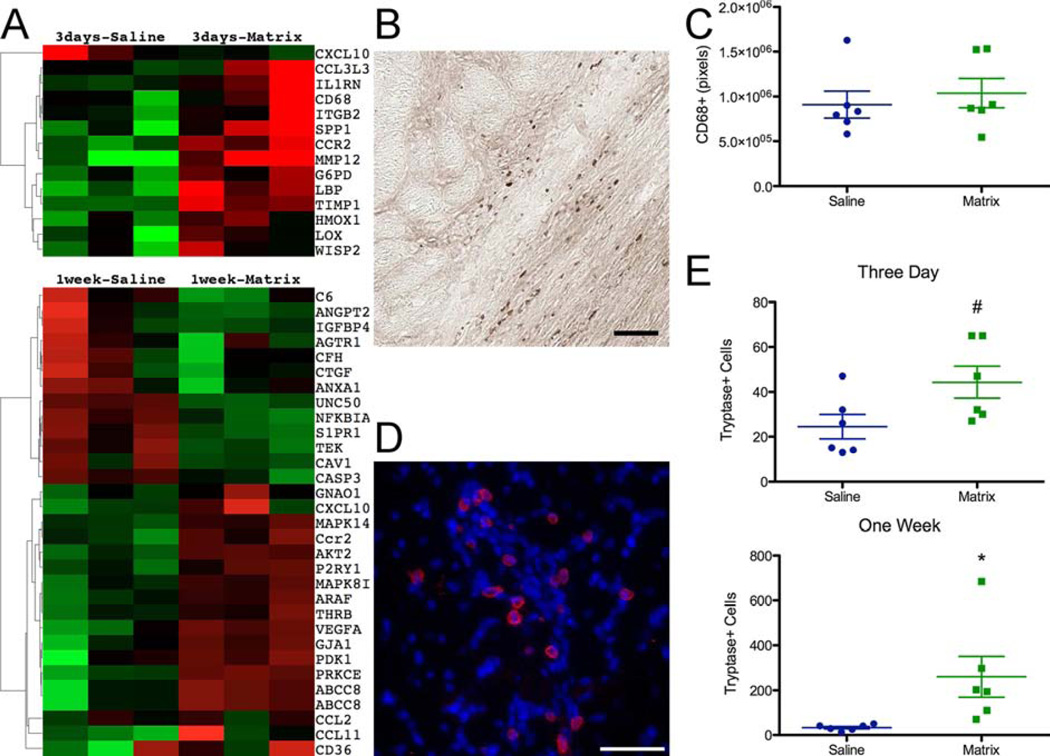
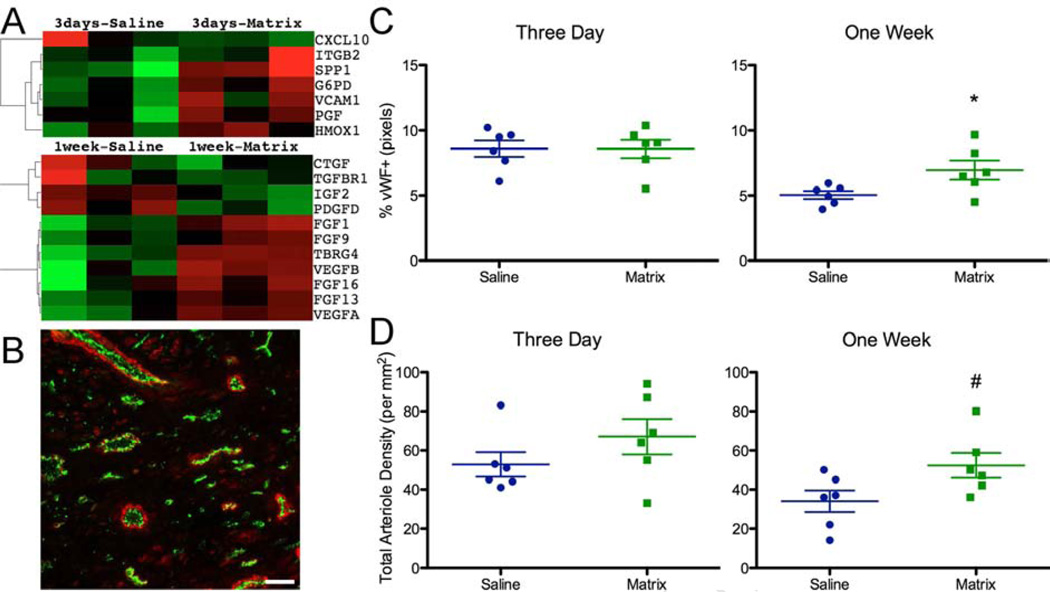
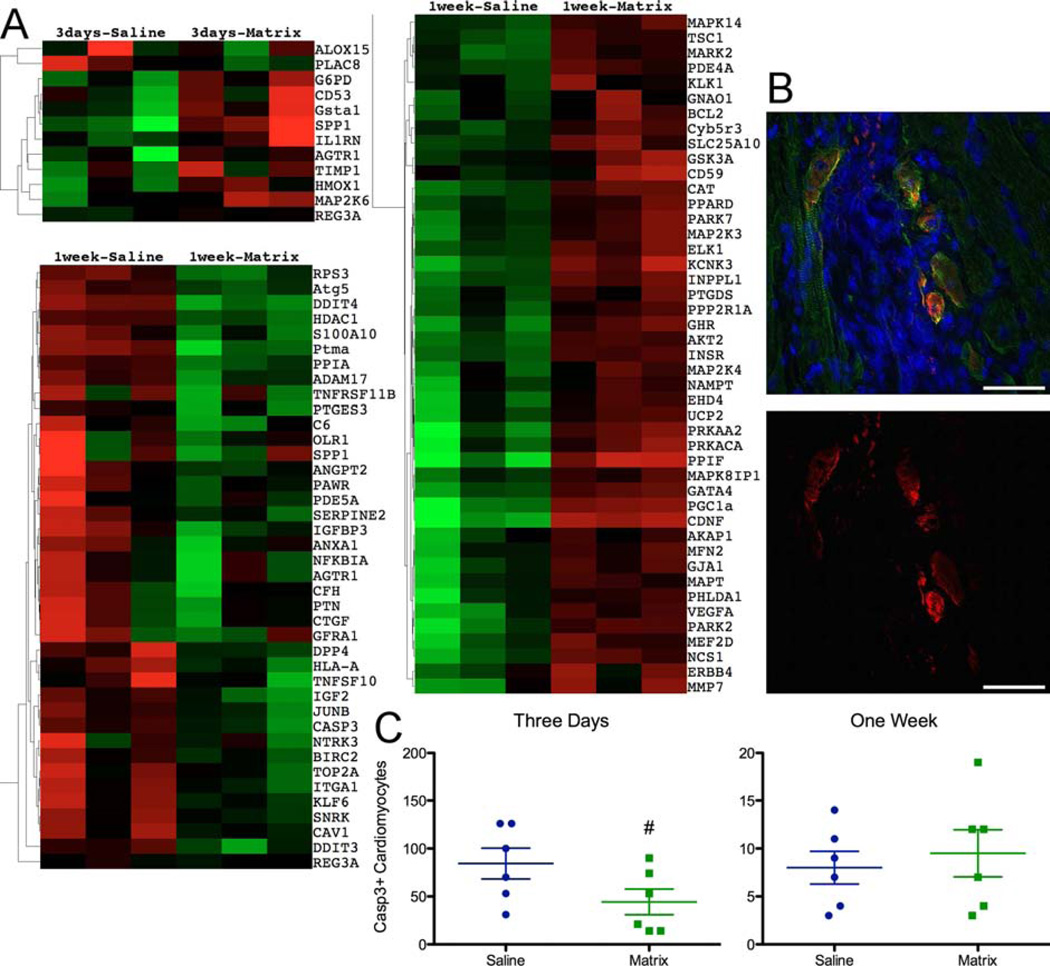
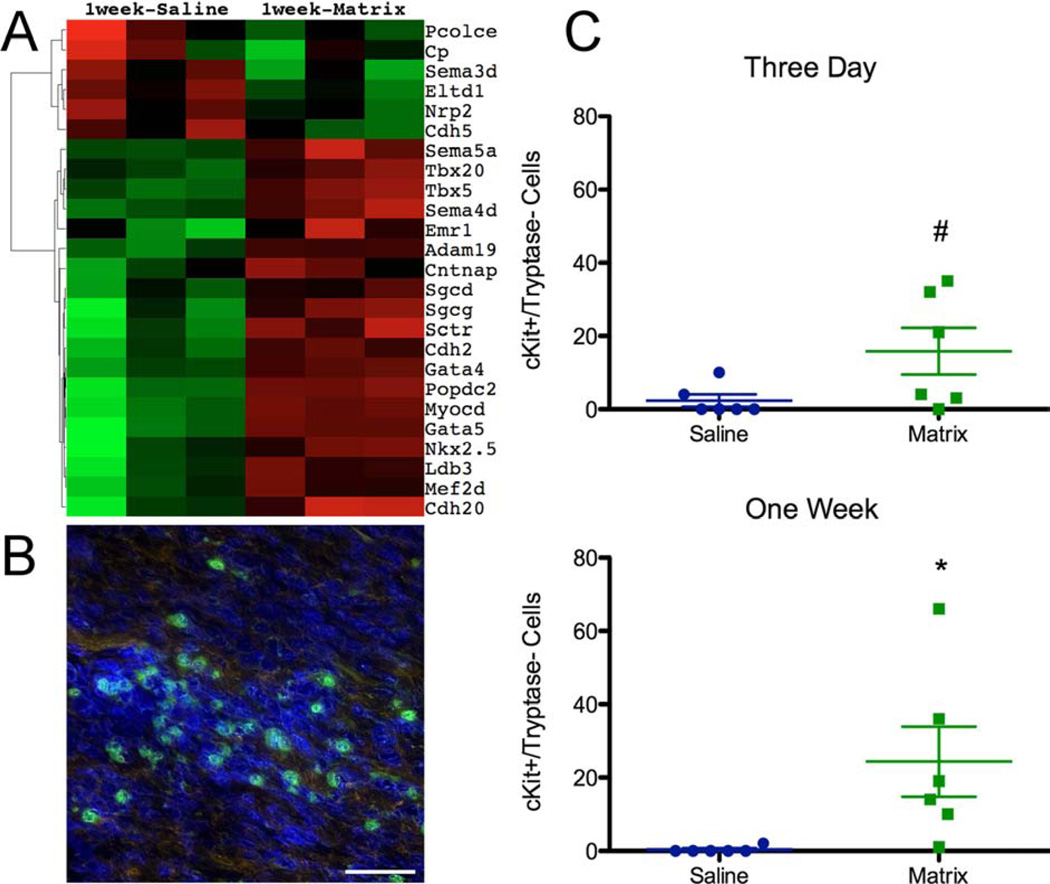
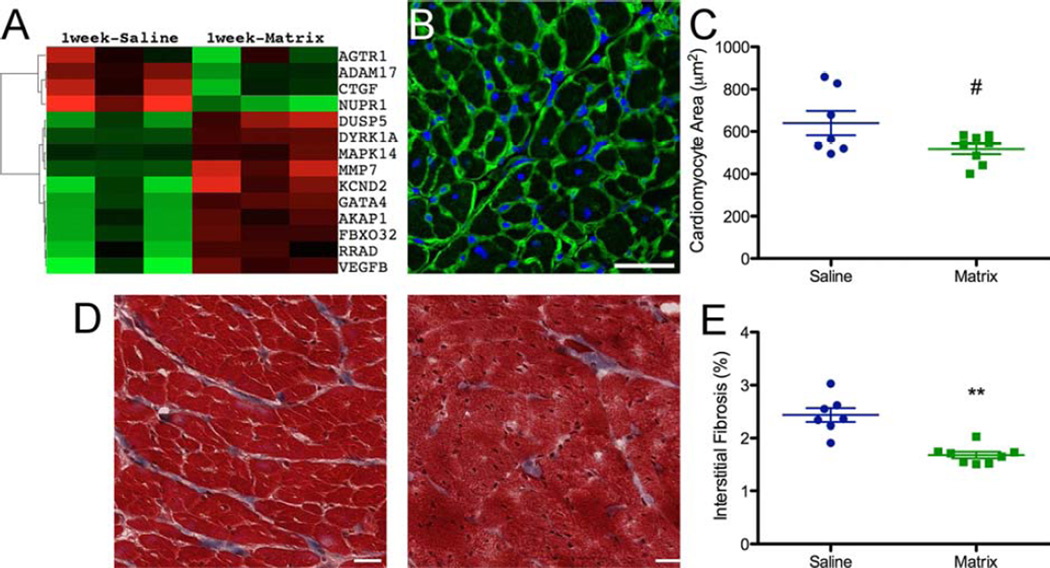
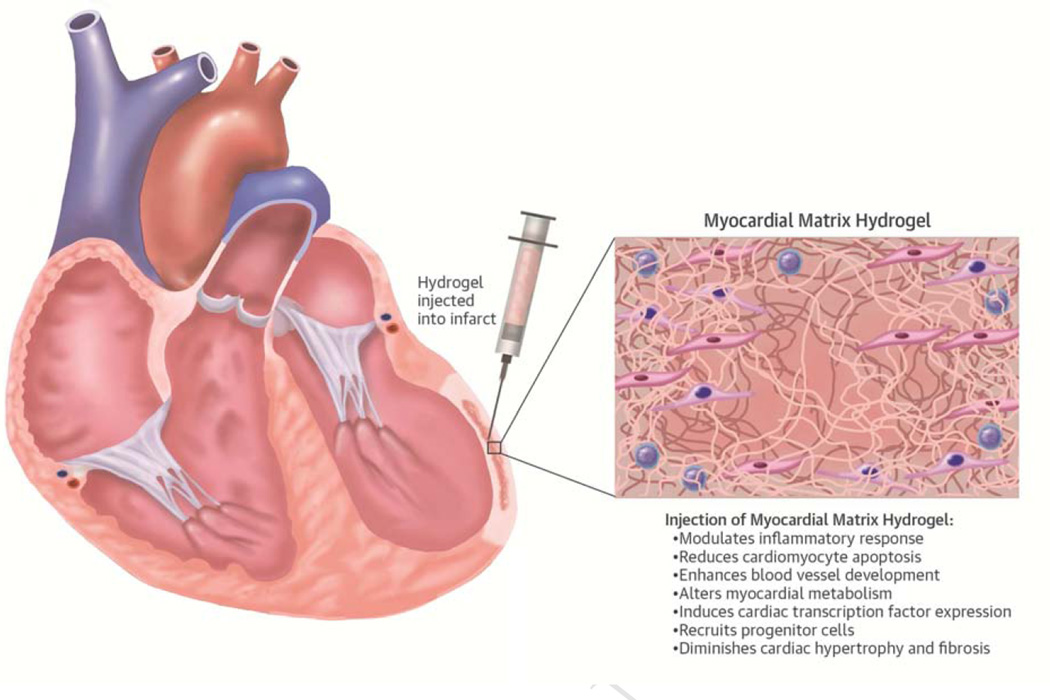
Results: Principal component analysis of the transcriptomes showed that samples collected from myocardial matrix-injected infarcts are distinct and cluster separately from saline-injected control subjects. Pathway analysis indicated that these differences are due to changes in several tissue processes that may contribute to improved cardiac healing after MI. Matrix-injected infarcted myocardium exhibits an altered inflammatory response, reduced cardiomyocyte apoptosis, enhanced infarct neovascularization, diminished cardiac hypertrophy and fibrosis, altered metabolic enzyme expression, increased cardiac transcription factor expression, and progenitor cell recruitment, along with improvements in global cardiac function and hemodynamics.

Conclusions: These results indicate that the myocardial matrix alters several key pathways after MI creating a pro-regenerative environment, further demonstrating its promise as a potential post-MI therapy.

Keywords: biomaterial; extracellular matrix; heart failure; infarction; microarray.


Figures

FIGURE 1
FIGURE 1. CMR and Hemodynamics Analysis
(A) Cardiac magnetic resonance imaging (CMR) was performed to compare percent changes in ejection fraction (EF), end-systolic volume (ESV), and end-diastolic volume (EDV) from 6 days post-myocardial infarction (MI) (1 day prior to injection) to 6 weeks post-MI (5 weeks postinjection) at study termination. (B) Left ventricular end-diastolic pressure (LVEDP), LV peak systolic pressure (LVPSP), myocardial relaxation (−dP/dtmax), and myocardial contractility (+dP/dtmax) were assessed by catheterization prior to euthanasia. *p < 0.05; **p < 0.01.
FIGURE 2
FIGURE 2. Transcriptomes Cluster Separately at 1 Week Post-injection
Principal component analysis (A) and hierarchical clustering (B) of infarct transcriptomes of all samples indicated that global gene expression after myocardial matrix injection is distinct from control saline injection by 1 week. (C) Hierarchical clustering of the 2,144 genes differentially expressed at 1 week post-injection. RNA from 2 infarcts were combined for analysis on 1 microarray chip to reduce biological variability (n = 3 arrays per group, per time point). Blue = saline; green = matrix; triangles = 3 days; squares = 1 week.
FIGURE 3
FIGURE 3. Inflammatory Response
(A) Expression of genes (red = upregulated; green =downregulated) involved in inflammation at 3 days and 1 week. (B) CD68+ staining for macrophages, visualized by 3,3' diaminobenzidine (brown) in a myocardial matrix-injected infarct 3 days post-injection. (C) Quantification of CD68 staining in the infarct wall from 3 slides at 3 days post-injection. (D) Tryptase+ (red) cells in myocardial matrix injected heart at 1 week post-injection; nuclei are stained blue with Hoescht 33342. (E) Quantification of all tryptase+ mast cells in the infarct wall from 3 slides at 3 days and 1 week post-injection. Scale bar = 50 µm; #p = 0.052, *p < 0.05.
FIGURE 4
FIGURE 4. Blood Vessel Formation
(A) Expression of vessel development genes at 3 days, and growth factors at 1 week. (B) Representative images of vessel staining with endothelial cells labeled by von Willebrand Factor (vWF; green) and smooth muscle cells labeled with α-smooth muscle actin (red). Endothelial cells (C) and arteriole density (D) are quantified within the infarct. Scale bar = 50 µm; #p < 0.1; *p < 0.05.
FIGURE 5
FIGURE 5. Apoptosis
(A) Expression of genes involved in apoptosis at 3 days and 1 week. (B) Examples of positive cleaved-Caspase3-expression (red) in α-actinin+ cardiomyocytes (green); nuclei are stained blue with Hoescht 33342 (merged image [top] and red-channel only [bottom]). (C) Quantification of all cleaved-Caspase3 expressing cardiomyocytes within the border zone of 3 slides. Scale bar = 50 µm; #p = 0.085.
FIGURE 6
FIGURE 6. Myocardial Metabolic Gene Expression
(A) Expression of metabolic genes at 1 week. (B) Example of peroxisome proliferator-activated receptor gamma coactivator 1-alpha (PGC-1α) expression (red) in α-actinin+ cardiomyocytes (green) adjacent to the infarct; nuclei are stained blue with Hoescht 33342 (merged image [top] and red-channel only [bottom]). Thick arrows point to positive PGC-1α stained cardiomyocyte nuclei and thin arrows point to negative nuclei. (C) Quantification of PGC-1 α + nuclei expression percentage. > 200 cardiomyocytes were quantified per heart. Scale bar = 50 µm; **p < 0.01.
FIGURE 7
FIGURE 7. Cardiac Development
(A) Expression of genes involved in heart development. (B) Example of cKit+(green)/tryptase-(red) cells with Hoescht-labeled nuclei (blue) in the myocardial matrix-injected infarct after 1 week. (C) Quantification of cKit+/tryptase-cells throughout border zone of 3 slides at 3 days and 1 week post-injection. Scale bar = 50 µm; #p = 0.067, *p < 0.05.
FIGURE 8
FIGURE 8. Hypertrophic Remodeling
(A) Expression of genes involved in hypertrophic response. (B) Representative image of the remote myocardium stained with laminin antibody (green) to outline cardiomyocytes and Hoescht 33342 to visualize nuclei (blue). (C) Quantification of cardiomyocyte cross-sectional area, averaged ≥300 cells per heart. (D) Representative Masson’s Trichrome staining of interstitial fibrosis (left = saline; right = matrix). (E) Quantification of interstitial fibrosis from 5 slides per heart. Scale bar = 50 µm; #p = 0.061; **p < 0.01.
CENTRAL ILLUSTRATION
CENTRAL ILLUSTRATION. Effects of Myocardial Matrix Hydrogel Post-MI: Mechanisms Underlying the Functional Benefits
Injection of myocardial matrix 1 week post-myocardial infarction (MI) into the infarcted area induced various tissue level changes that reduced negative left ventricular remodeling and improved hemodynamics. Altering these key pathways created a pro-regenerative environment, potentially preventing or slowing development of heart failure.

Comment in

Similar articles

Cited by

References

    1. Leri A, Kajstura J, Anversa P. Role of Cardiac Stem Cells in Cardiac Pathophysiology: A Paradigm Shift in Human Myocardial Biology. Circ Res. 2011;109:941–961. - PMC - PubMed
    1. Xin M, Olson EN, Bassel-Duby R. Mending broken hearts: cardiac development as a basis for adult heart regeneration and repair. Nat Rev Mol Cell Biol. 2013;14:529–541. - PMC - PubMed
    1. Wang ZV, Li DL, Hill JA. Heart Failure and Loss of Metabolic Control. J Cardiovasc Pharm. 2014;63:302–313. - PMC - PubMed
    1. Delewi R, Andriessen A, Tijssen JGP, Zijlstra F, Piek JJ, Hirsch A. Impact of intracoronary cell therapy on left ventricular function in the setting of acute myocardial infarction: a meta-analysis of randomised controlled clinical trials. Heart. 2013;99:225–232. - PubMed
    1. Rane AA, Christman KL. Biomaterials for the treatment of myocardial infarction a 5-year update. J Am Coll Cardiol. 2011;58:2615–2629. - PubMed

Publication types

MeSH terms

Substances