. 2016 Mar 4:6:22532.
doi: 10.1038/srep22532.

Atlantic SSTs control regime shifts in forest fire activity of Northern Scandinavia

Affiliations

Atlantic SSTs control regime shifts in forest fire activity of Northern Scandinavia

Igor Drobyshev et al. Sci Rep. .

Abstract

Understanding the drivers of the boreal forest fire activity is challenging due to the complexity of the interactions driving fire regimes. We analyzed drivers of forest fire activity in Northern Scandinavia (above 60 N) by combining modern and proxy data over the Holocene. The results suggest that the cold climate in northern Scandinavia was generally characterized by dry conditions favourable to periods of regionally increased fire activity. We propose that the cold conditions over the northern North Atlantic, associated with low SSTs, expansion of sea ice cover, and the southward shift in the position of the subpolar gyre, redirect southward the precipitation over Scandinavia, associated with the westerlies. This dynamics strengthens high pressure systems over Scandinavia and results in increased regional fire activity. Our study reveals a previously undocumented teleconnection between large scale climate and ocean dynamics over the North Atlantic and regional boreal forest fire activity in Northern Scandinavia. Consistency of the pattern observed annually through millennium scales suggests that a strong link between Atlantic SST and fire activity on multiple temporal scales over the entire Holocene is relevant for understanding future fire activity across the European boreal zone.


Figures
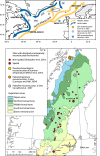
Figure 1
Figure 1. Map of the main current pathways in the northern North Atlantic and location of sites providing proxy data.
LC Labrador current, WGC Western Greenland Current, EGC Eastern Greenland Current, IC Irminger Current, EIC Eastern Icelandic Current. The grey polygon of the upper panel refers to the map area of the lower panel.
Figure 2
Figure 2. Correlation between annually burned forest area in Northern Sweden (north of 60° N) and monthly distribution of SSTs in the northern North Atlantic prior to and during the fire season.
The area with the higher correlation (40–50°N, 50–40°W) is indicated by a square on all maps. Coefficients significant at p < 0.1 are marked by colour. Colour scale refers to the values of correlation coefficient. See Fig. SI 1C for the maps of significance levels.
Figure 3
Figure 3. Teleconnection between the northern North Atlantic and fire weather in Scandinavia.
(A) Correlation between annually burned area in northern Sweden and sea ice concentration (NSIDC dataset) around Newfoundland for February through April for the period 1996–2014. (B) Correlation between average April-May SST of the northern North Atlantic for the period 1870–2010 and self-calibrated PDSI for the area of northern Sweden (a region limited by 60–64 °N and 4–14 °E) for July,August. The area limited by 40–50°N and 50–40°W is indicated by a square. Note that lower PDSI values mean increased drought conditions. (C) Correlation between self-calibrated average July,August PDSI for the area of northern Fennoscandia and average April,May SST for area limited by 40 to 50°N and 50 to 40°W. In all graphs coefficients significant at p < 0.1 are marked by colour. Colour scale refers to the values of the correlation coefficients. The field significance and the fraction of the map with significant correlations (p < 0.05), are shown for each map. See Fig. SI 1D for the maps of significance levels.
Figure 4
Figure 4. Superposed epoch analysis of monthly 500 mb pressure fields (NCER/NCAR dataset) for the five largest fire years in northern Sweden over period from December to August of the current fire season for 1948–1975 and 1996–2014.
Areas with deviations significant at p < 0.10 are marked with colour . See Fig. SI 4C for the maps of significance levels.
Figure 5
Figure 5. Dynamics of reconstructed fire activity and May–August temperature (running 11-year mean) in northern Scandinavia since 1300 AD.
Thick horizontal lines represent periods of similar mean conditions identified through regime shift detection method based on sequential t-tests on original (unsmoothed) data points. Arrows indicate large fire years established through a contingency analysis on the network of sites with reconstructed fire histories (Fig. 1). Fire activity at sites Bjurholm and Tiveden is presented as cumulative annual area burned over a moving 100 year frame with a 10 year shift. Yellow bars indicate periods with increased fire activity.
Figure 6
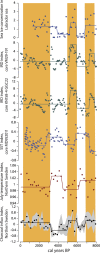
Figure 6. Holocene-long dynamics of fire activity and environmental proxies.
Charcoal-based proxy of fire activity and chironomid-based temperature reconstruction represented conditions over northern Sweden. Sea-surface conditions are illustrated from SST reconstruction on the Vøring Plateau, Norwegian Sea core MD952011, IRD occurrences in the northwest (core KN158-4GGC22) and northeast (core VM29-191) North Atlantic, and sea ice cover estimates from the Labrador Sea core HU84-030-021. See Table SI 1 for exact site locations. Charcoal reconstruction is an average of three lake sediment chronologies and chironomid reconstruction is an average of two reconstructions. Thick horizontal lines represent periods of similar mean conditions identified through regime shift detection method based on sequential t-tests. 95% confidence envelop is shown for fire chronology. Yellow bars indicate periods with increased fire activity.

Similar articles

Cited by

References

    1. Bond-Lamberty B., Peckham S. D., Ahl D. E. & Gower S. T. Fire as the dominant driver of central Canadian boreal forest carbon balance. Nature (London) 450, 89–92, doi: 10.1038/nature06272 (2007). - DOI - PubMed
    1. Bowman D. M. et al. Forest fire management, climate change, and the risk of catastrophic carbon losses. Front. Ecol. Environ. 11, 66–68, doi: 10.1890/13.WB.005 (2013). - DOI
    1. Amiro B. D. et al. Fire weather index system components for large fires in the Canadian boreal forest. Int. J. Wildland Fire 13, 391–400, doi: 10.1071/WF03066 (2004). - DOI
    1. de Groot W. J. et al. A comparison of Canadian and Russian boreal forest fire regimes. Forest Ecol. Manag. 294, 23–34, doi: 10.1016/j.foreco.2012.07.033 (2013). - DOI
    1. van der Werf G. et al. Global fire emissions and the contribution of deforestation, savanna, forest, agricultural, and peat fires (1997–2009). Atmos. Chem. Phys. 10, 11707–11735, doi: 10.5194/acp-10-11707-2010 (2010). - DOI

Publication types

LinkOut - more resources