Review
. 2016 Jun;116(6):1091-116.
doi: 10.1007/s00421-016-3346-6. Epub 2016 Mar 3.

Rate of force development: physiological and methodological considerations

Affiliations
Review

Rate of force development: physiological and methodological considerations

Nicola A Maffiuletti et al. Eur J Appl Physiol. 2016 Jun.

Abstract

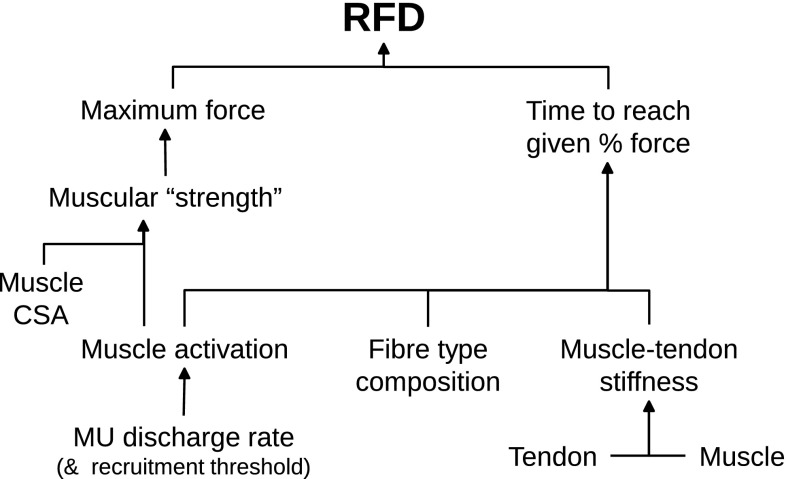
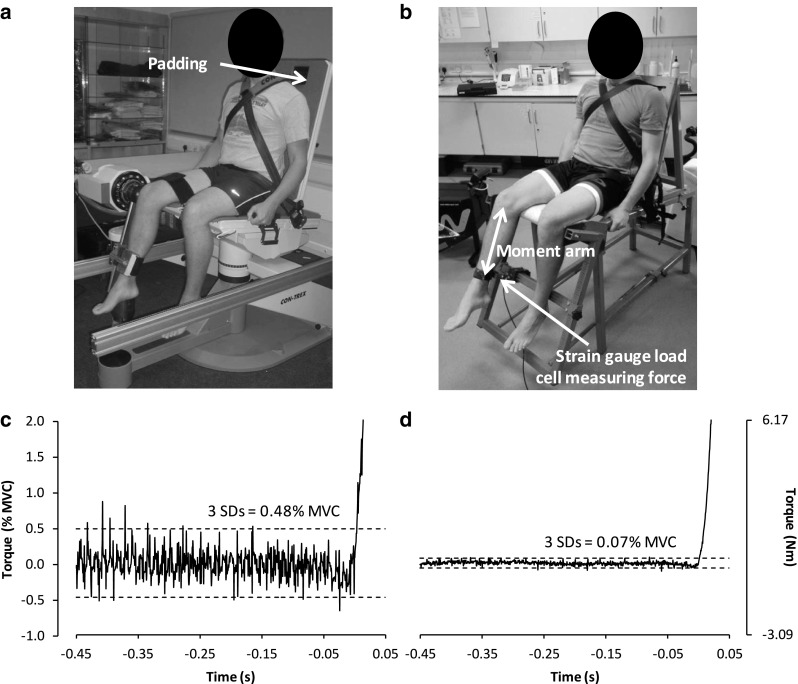
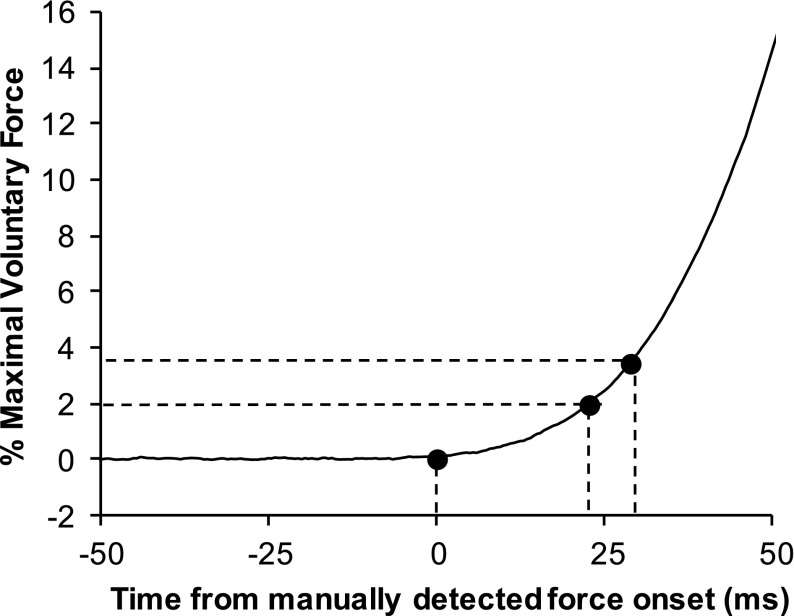
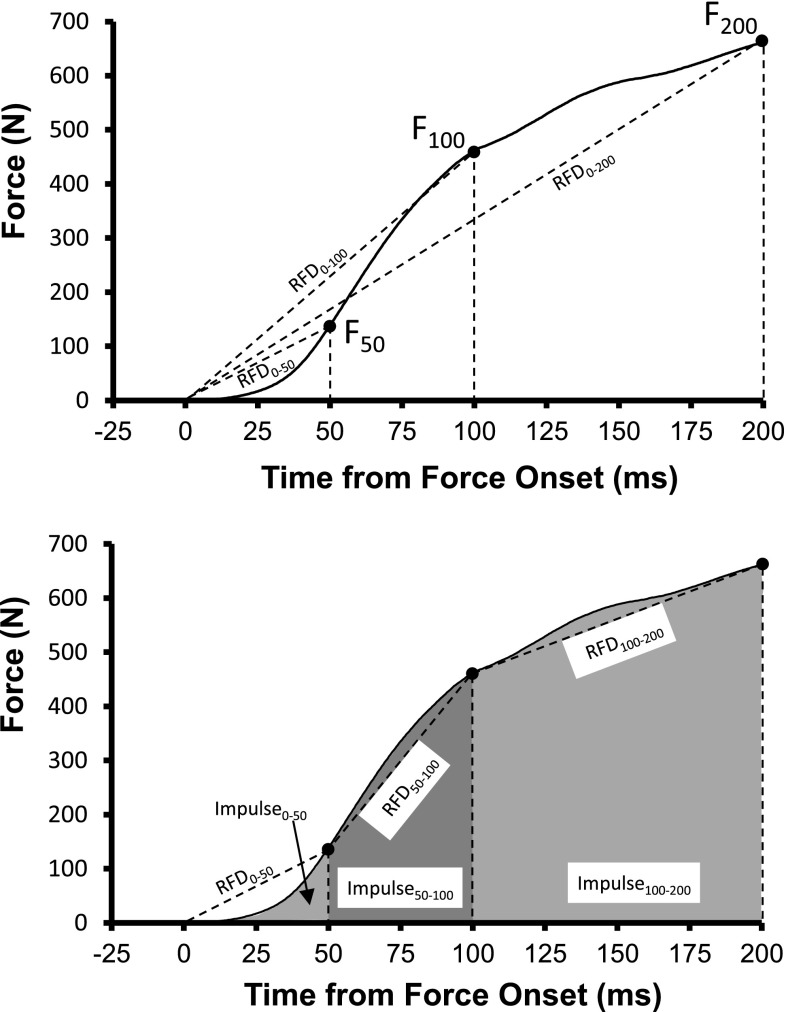
The evaluation of rate of force development during rapid contractions has recently become quite popular for characterising explosive strength of athletes, elderly individuals and patients. The main aims of this narrative review are to describe the neuromuscular determinants of rate of force development and to discuss various methodological considerations inherent to its evaluation for research and clinical purposes. Rate of force development (1) seems to be mainly determined by the capacity to produce maximal voluntary activation in the early phase of an explosive contraction (first 50-75 ms), particularly as a result of increased motor unit discharge rate; (2) can be improved by both explosive-type and heavy-resistance strength training in different subject populations, mainly through an improvement in rapid muscle activation; (3) is quite difficult to evaluate in a valid and reliable way. Therefore, we provide evidence-based practical recommendations for rational quantification of rate of force development in both laboratory and clinical settings.

Keywords: Ballistic contraction; Dynamometry; Explosive strength; Motor unit discharge rate; Musculotendinous stiffness; Strength training.


Figures

Fig. 1
Fig. 1
Illustration of the early phase of the torque- and EMG-time curves of the knee extensor muscles in two subjects during an explosive voluntary isometric contraction (continuous line) and in response to electrical stimulation (8 pulses at 300 Hz; discontinuous line). The rate of torque development during the two types of contraction is similar for subject 2 (b), whereas it is substantially smaller during voluntary activation for subject 1 (a). Interestingly, EMG activity (expressed as % of EMG during MVC) of the vastus lateralis is much greater at the onset of muscle activation in subject 2 (d) compared to subject 1 (c). These data indicate that the rate of torque development is mainly limited by muscle activation (neural factors) in subject 1 whereas it is more likely constrained by muscular factors in subject 2. Arrows and vertical lines indicate, respectively, the onset of torque development and the force attained 40 ms after the onset of the contraction. Figure reproduced with permission from de Ruiter et al. (2004)
Fig. 2
Fig. 2
Distribution of myosin heavy chain (MHC)-II (IIA + IIB) isoforms in soleus (squares), vastus lateralis (triangles) and triceps brachii (circles) in relation to a twitch time to peak torque (TPT), and b maximal rate of rise of evoked torque at 50 Hz (dPo50). Between-muscle differences were strongly associated with differences in muscle fibre type, although the relationship with within-muscle variability was less pronounced. Figure reproduced with permission from Harridge et al. (1996)
Fig. 3
Fig. 3
Motor unit (MU) discharge rate at the onset of maximal ballistic contractions, obtained in the tibialis anterior muscle before and after 12 weeks of ballistic-type strength training. a Representative MU action potential recordings obtained before (left) and after (right) training. Note the marked increases in MU discharge rate and RFD with training. b Mean discharge rate (and SEM) recorded in the first, second and third interspike intervals, respectively. All post-training values were greater than pre-training values (p < 0.001). The number of MU action potentials analysed in each interspike interval ranged between 243 and 609. Figure reproduced with permission from Van Cutsem et al. (1998) and Aagaard (2003)
Fig. 4
Fig. 4
a Representative linear-array EMG recordings obtained in the vastus lateralis muscle during explosive isometric contractions of the knee extensors. EMG signals were analysed in two intervals of 50 ms (shaded boxes I and II) that were initiated 70 ms before the onset of force (I) and centered at the time instant of maximal RFD (peak slope) (II). b Mean RFD (and SEM) obtained before, during (3 weeks) and after 6 weeks of heavy-resistance strength training, endurance training or no training. *p < 0.05. c, d Average rectified EMG amplitude (ARV; mean and SE) measured for the vastus lateralis and vastus medialis muscles in time intervals I (c) and II (d). *p < 0.05; **p < 0.001. Note that increases in RFD and EMG activity were only observed following strength training, while absent in response to endurance training and in non-trained controls. Figure reproduced with permission from Vila-Cha et al. (2010)
Fig. 5
Fig. 5
Rate of force development (RFD) is influenced by numerous factors within the neuromuscular system; those contributing to maximal muscular strength will improve the mean RFD (assuming the rate at which a given proportional force level is reached remains constant), whereas those affecting the time to reach a given force level may additionally influence the RFD measured at different time intervals during the rise in muscle force. CSA cross-sectional area
Fig. 6
Fig. 6
Photograph and baseline-torque recordings from a commercial isokinetic dynamometer (a, c) and a custom-built dynamometer (b, d), measuring knee extensor torque at ~60° knee flexion in the same participant. The padding on the chair/crank-arm adaptor in a, that is not present in b, contributes to dynamometer compliance. Torque in d is the product of force and moment arm. The baseline-torque recordings in c and d are prior to and during the early phase of an explosive contraction, and presented in the same scale for both absolute (Nm) and relative (% MVC) units. The dashed lines are ±3 SDs of the baseline mean which is often used as a threshold for detecting contraction onset, and is comparable with typical objective criteria thresholds for detecting an unstable baseline (e.g., shift above/below this threshold in the preceding 200 ms). The considerably greater baseline noise amplitude in c makes the thresholds for detecting contraction onset and/or an unstable baseline, including any pre-tension or countermovement, markedly less sensitive than in d
Fig. 7
Fig. 7
An unfiltered force–time curve recorded during an explosive contraction of the knee extensors (force is expressed relative to maximal voluntary force). Force onset (0 ms) was detected manually/visually using the systematic method detailed in Tillin et al. (2010). Some automated systems for detecting contraction onset have used arbitrary thresholds between 2 and 3.6 % maximal voluntary force which in this example occurs 24–30 ms after manually detected onset. Figure reproduced with permission from Tillin et al. (2013b)
Fig. 8
Fig. 8
Common measurements of the rising force–time curve. a Force at specific time points (F 50, F 100, etc.) and overlapping RFD measurements all starting from force onset (RFD0–50, RFD0–100, etc.). b An identical force trace showing measurements of sequential RFD and sequential impulse both assessed over consecutive periods

References

    1. Aagaard P. Training-induced changes in neural function. Exerc Sport Sci Rev. 2003;31:61–67. doi: 10.1097/00003677-200304000-00002. - DOI - PubMed
    1. Aagaard P. Neural adaptations to resistance exercise. In: Cardinale M, Newton RU, Nosaka K, editors. Strength and conditioning: biological principles and practical applications. New York: Wiley-Blackwell; 2010. pp. 105–124.
    1. Aagaard P, Thorstensson A. Neuromuscular aspects of exercise: adaptive responses evoked by strength training. In: Kjaer M, editor. Textbook of sports medicine. London: Blakwell; 2003. pp. 70–106.
    1. Aagaard P, Andersen JL, Dyhre-Poulsen P, Leffers AM, Wagner A, Magnusson SP, Halkjaer-Kristensen J, Simonsen EB. A mechanism for increased contractile strength of human pennate muscle in response to strength training: changes in muscle architecture. J Physiol. 2001;534:613–623. doi: 10.1111/j.1469-7793.2001.t01-1-00613.x. - DOI - PMC - PubMed
    1. Aagaard P, Simonsen EB, Andersen JL, Magnusson P, Dyhre-Poulsen P. Increased rate of force development and neural drive of human skeletal muscle following resistance training. J Appl Physiol (1985) 2002;93:1318–1326. doi: 10.1152/japplphysiol.00283.2002. - DOI - PubMed

MeSH terms