. 2016 May;171(1):437-51.
doi: 10.1104/pp.15.01875. Epub 2016 Mar 3.

Habitat-Associated Life History and Stress-Tolerance Variation in Arabidopsis arenosa

Affiliations

Habitat-Associated Life History and Stress-Tolerance Variation in Arabidopsis arenosa

Pierre Baduel et al. Plant Physiol. 2016 May.

Abstract

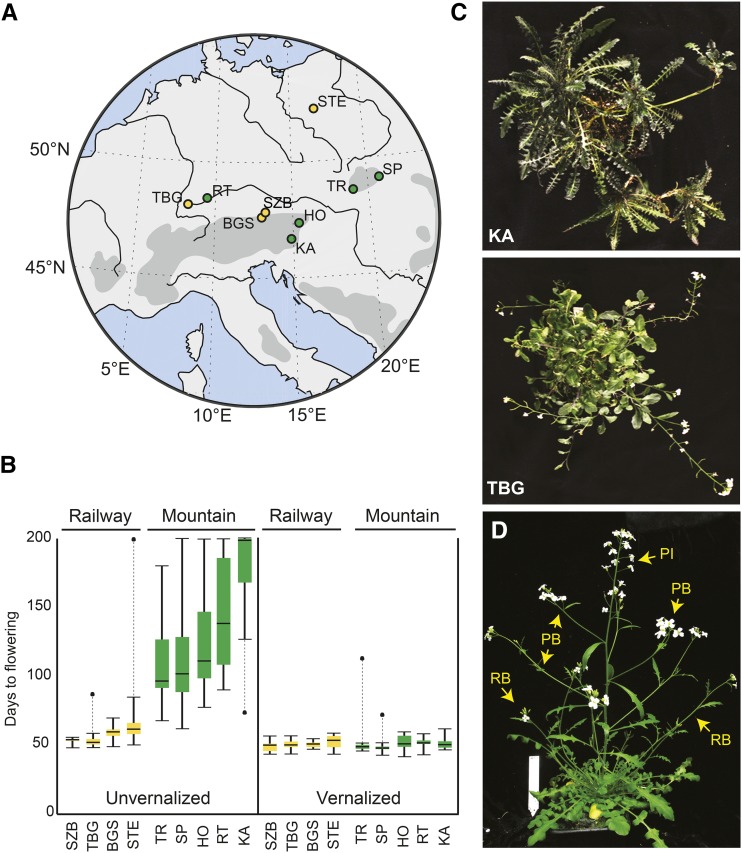
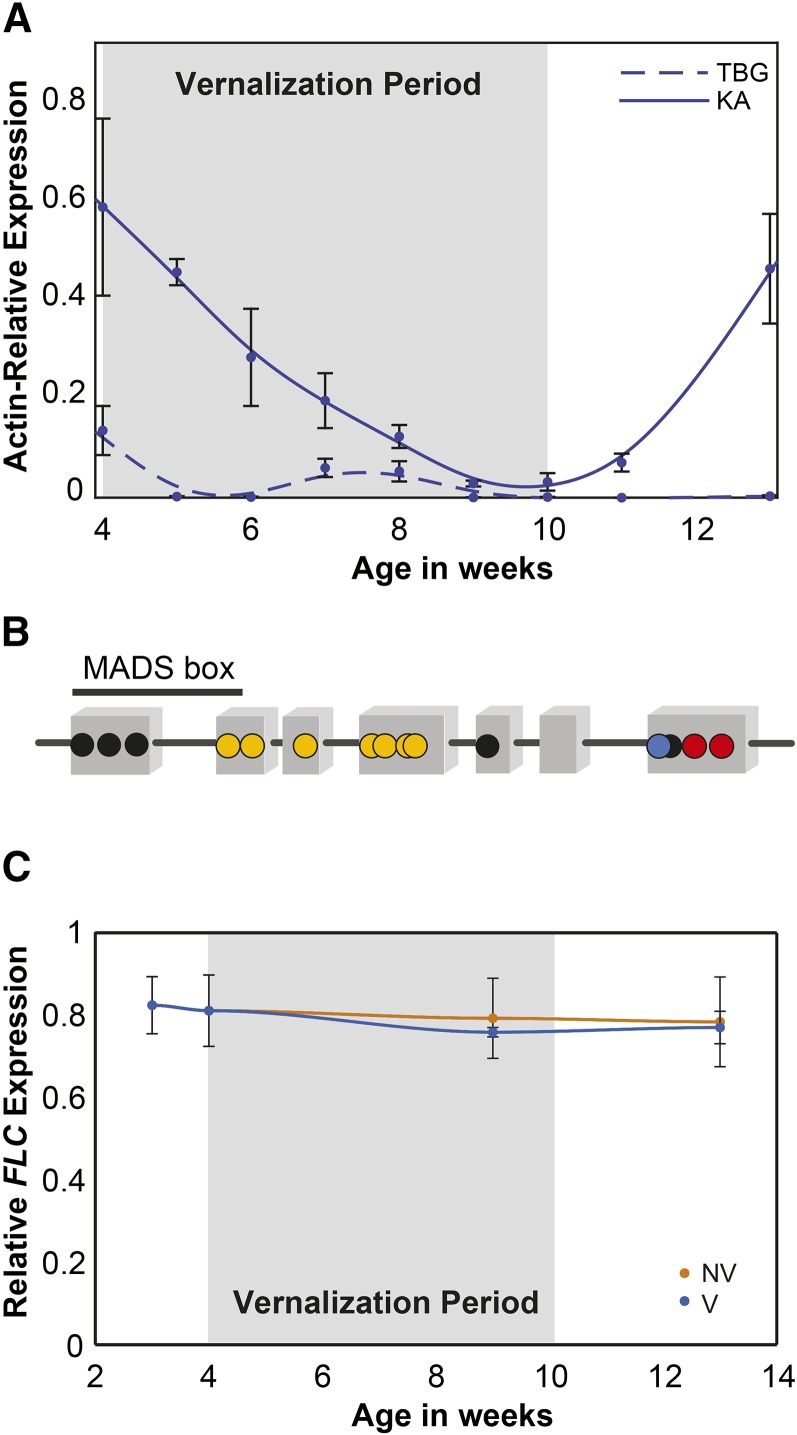
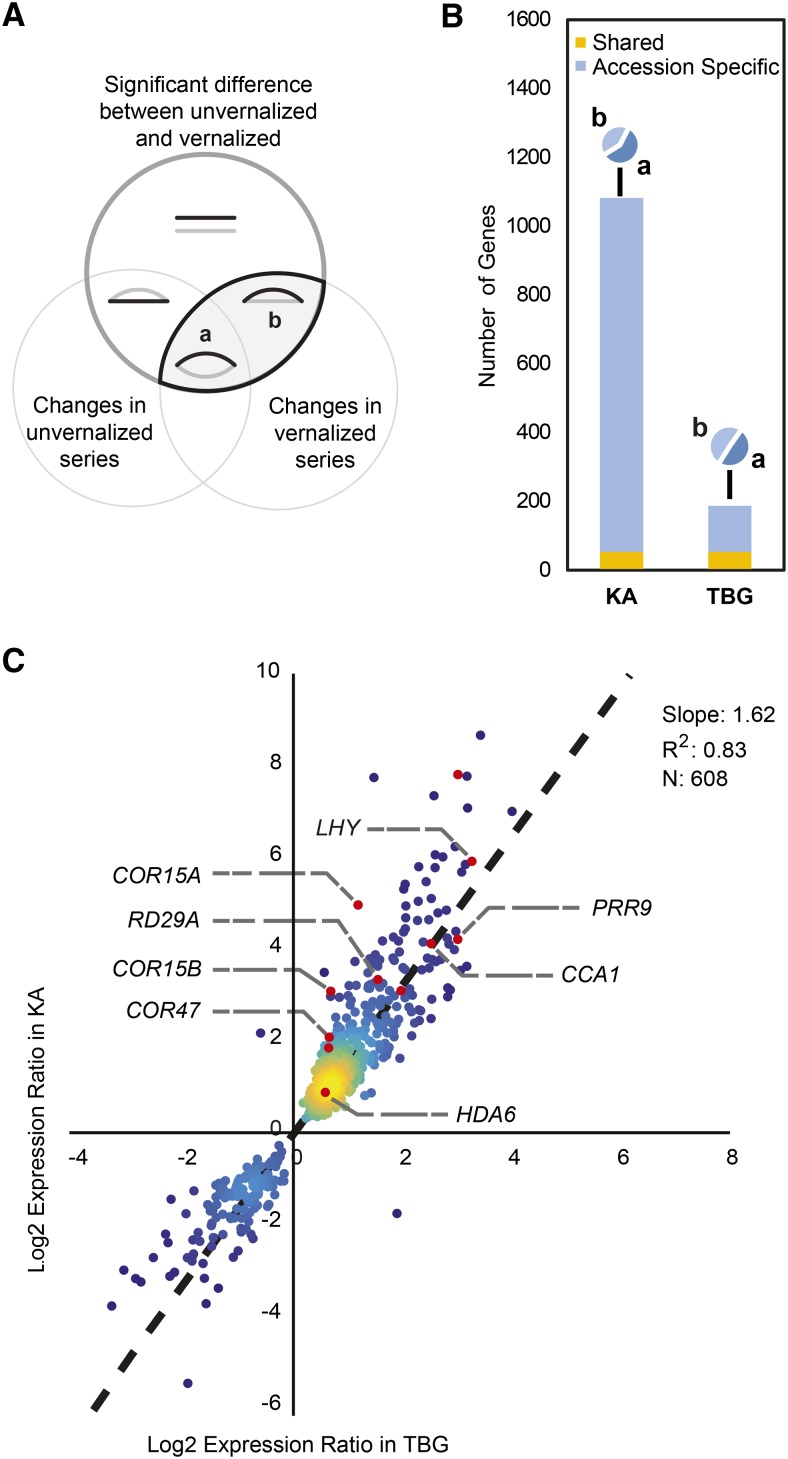
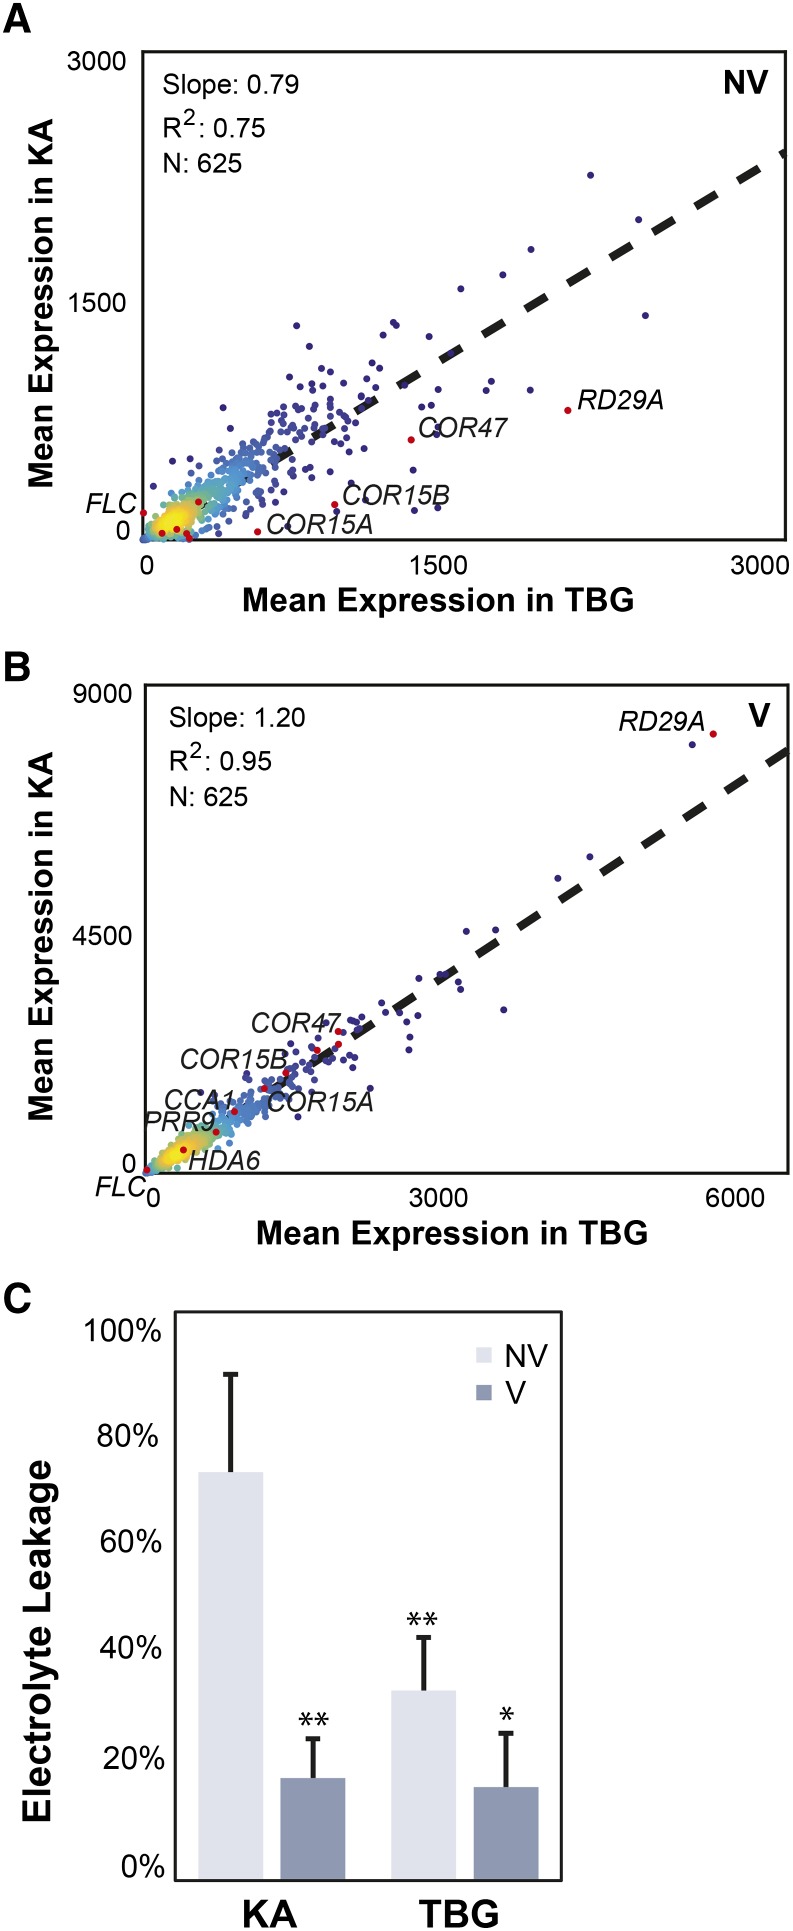
Weediness in ephemeral plants is commonly characterized by rapid cycling, prolific all-in flowering, and loss of perenniality. Many species made transitions to weediness of this sort, which can be advantageous in high-disturbance or human-associated habitats. The molecular basis of this shift, however, remains mostly mysterious. Here, we use transcriptome sequencing, genome resequencing scans for selection, and stress tolerance assays to study a weedy population of the otherwise nonweedy Arabidopsis arenosa, an obligately outbreeding relative of Arabidopsis thaliana Although weedy A. arenosa is widespread, a single genetic lineage colonized railways throughout central and northern Europe. We show that railway plants, in contrast to plants from sheltered outcrops in hill/mountain regions, are rapid cycling, have lost the vernalization requirement, show prolific flowering, and do not return to vegetative growth. Comparing transcriptomes of railway and mountain plants across time courses with and without vernalization, we found that railway plants have sharply abrogated vernalization responsiveness and high constitutive expression of heat- and cold-responsive genes. Railway plants also have strong constitutive heat shock and freezing tolerance compared with mountain plants, where tolerance must be induced. We found 20 genes with good evidence of selection in the railway population. One of these, LATE ELONGATED HYPOCOTYL, is known in A. thaliana to regulate many stress-response genes that we found to be differentially regulated among the distinct habitats. Our data suggest that, beyond life history regulation, other traits like basal stress tolerance also are associated with the evolution of weediness in A. arenosa.


Figures

Figure 1.
Figure 1.
Phenotypes of railway and mountain A. arenosa plants. A, Map of central Europe with locations of A. arenosa populations sampled from railway (yellow) and mountain (green) sites. TBG = Triberg, Germany; RT = Upper Danube Valley, Germany; BGS = Berchtesgaden, Germany; SZB = Salzburg, Austria; HO = Hochlantsch, Austria; KA = Kasparstein, Austria; TR = Trencin, Slovakia; SP = Spisska, Slovakia. B, Box plots showing flowering phenotypes of plants grown from seeds collected from railway and mountain populations. Flowering time was quantified as the time from germination to the first open flower for vernalized (left) and nonvernalized (right) plants from both accessions. Plants that did not flower by the end of the experiment (200 d) were assigned 200 d as their flowering date. C, Images of two representative vernalized individuals taken at 38 weeks. TBG plants flower continuously, while KA plants revert to vegetative growth after an episode of flowering. The development of secondary rosettes along branched stems of KA plants can then be observed. D, Representative greenhouse-grown A. arenosa indicating scored phenotypes of primary inflorescence branches (PB) and rosette branches (RB). PI indicates the primary inflorescence.
Figure 2.
Figure 2.
Differential FLC expression and responsiveness to vernalization. A, Quantitative reverse transcription-PCR of FLC expression relative to ACTIN (ACT) in vernalized KA and TBG plants. While undetectable in TBG, FLC is suppressed by vernalization in KA but comes back to unvernalized levels after plants are returned to warm conditions. B, Single-nucleotide differences between the coding sequences of the two AaFLC1 and AaFLC2 paralogs in our sample. Gray boxes are exons. Yellow indicates differences between AaFLC1 and AaFLC2 present in our samples as well as the published BAC sequence (Nah and Chen, 2010). Black indicates differences between AaFLC1 and AaFLC2 in the BAC not found in our accessions. Red indicates differences between AaFLC1 and AaFLC2 in our samples but not present in the BAC. Blue indicates differences between AaFLC1 and AaFLC2 where both paralogs differ from the BAC. C, Expression levels of AaFLC1 as a proportion of total AaFLC locus expression across the vernalized (V) and nonvernalized (NV) time series, showing that the relative expression of the two FLC copies does not change by treatment or through the time series.
Figure 3.
Figure 3.
Vernalization response differences between KA and TBG mainly due to a reduced magnitude of response in TBG. A, Venn diagram representing the seven categories of differential responses for each accession. The top circle (dark gray) includes genes with significant differential expression when comparing the vernalized and unvernalized time series. The bottom left circle contains genes with significant differential expression among time points in the unvernalized time series. The bottom right circle contains genes with significantly different expression among time points in the vernalized time series. Cartoon curves show schematic vernalized (black) and unvernalized (gray) expression profiles of genes found in each category. Vernalization-responsive genes are found for each accession at the intersection between the top and bottom right circles. Within this pattern, a represents genes that change across the time series in both vernalized and unvernalized plants, but in distinct ways, while b includes genes that show changes in the vernalized time series but not in the unvernalized time series. B, Decomposition of each vernalization response showing which genes change in both accessions (yellow), which are accession specific (blue), and how they are partitioned between a- and b-category patterns (camembert diagrams). Almost 6 times more genes are identified as vernalization responsive in KA compared with TBG. C, Comparison of vernalization responsiveness in KA versus TBG. The responsiveness of a gene is calculated for each accession as the log2 ratio of vernalized over nonvernalized expression levels. Only ratios significantly different from 1 (log2 ratios different from 0) in both accessions are displayed. Several genes discussed here are highlighted. Colors signify plot density. The dotted line indicates the linear regression fit line based on n = 608 data points. The slope and r2 values for the fit are given on the chart.
Figure 4.
Figure 4.
Expression of vernalization-responsive genes in KA versus TBG. A, Expression levels of vernalization-responsive genes in unvernalized KA plotted against their levels in unvernalized TBG. The slope of the linear regression (0.79 with r2 = 0.75) indicates that vernalization-responsive genes have a higher expression in TBG in unvernalized plants. Known cold-responsive genes are highlighted in red, and in particular, COR15A, COR15B, COR47, and RD29A show even stronger bias toward higher constitutive expression in TBG. B, Expression levels of vernalization-responsive genes in vernalized KA versus vernalized TBG. Due to the stronger vernalization response in KA, the relationship is inversed compared with A (slope of 1.2 with r2 = 0.95). C, Electrolyte leakage measured after freezing at −6°C of leaves from 7-week-old KA and TBG plants vernalized for 1 week (V; dark blue bars) or not vernalized (NV; light blue bars). Two asterisks indicate significant differences of vernalized KA and nonvernalized TBG compared with the high leakage of unvernalized KA plants (Student’s t test P < 1%). One asterisk denotes a significant difference of vernalized TBG from the controlled leakage of unvernalized TBG (Student’s t test P < 5%).
Figure 5.
Figure 5.
Overall transcriptome differential expression between KA and TBG. A, Genome-wide distribution of q values comparing KA and TBG nonvernalized (NV; x axis) and vernalized (V; y axis) time series. FLC is highlighted, as it is ranked third in both comparisons, which makes it the most differentiated expression pattern overall. The top 1% (326 genes) overall (sum of both q values) are colored in red if a homolog is known in A. thaliana and in black if not. Yellow dots represent genes with low expression across all time points, genotypes, and conditions and, therefore, excluded from further consideration in the top 1% subset. B, Expression heat map of genes that are both within the 1% most differentiated pattern and associated with the GO category response to stimulus (GO:0050896). For each gene, the mean expression of both vernalized and nonvernalized time series is given for KA and TBG. Expression is given in normalized gene counts.
Figure 6.
Figure 6.
Constitutive heat shock tolerance in railway plants. The percentage of seedlings exhibiting partial or total bleaching of their cotyledons and leaves after heat shock treatment is shown. H indicates healthy after treatment (green), and B indicates bleached after treatment (orange). Acclimated seedlings were subjected to a 3-h 37°C pretreatment 2 d prior to a 1-h heat shock at 45°C, while nonacclimated seedlings were incubated directly for 1 h at 45°C. Bleaching was often nonlethal even for KA plants.

References

    1. Alabadí D, Oyama T, Yanovsky MJ, Harmon FG, Más P, Kay SA (2001) Reciprocal regulation between TOC1 and LHY/CCA1 within the Arabidopsis circadian clock. Science 293: 880–883 - PubMed
    1. Albani MC, Castaings L, Wötzel S, Mateos JL, Wunder J, Wang R, Reymond M, Coupland G (2012) PEP1 of Arabis alpina is encoded by two overlapping genes that contribute to natural genetic variation in perennial flowering. PLoS Genet 8: e1003130. - PMC - PubMed
    1. Anders S, Huber W (2010) Differential expression analysis for sequence count data. Genome Biol 11: R106. - PMC - PubMed
    1. Anders S, Pyl PT, Huber W (2015) HTSeq: a Python framework to work with high-throughput sequencing data. Bioinformatics 31: 166–169 - PMC - PubMed
    1. Anderson HJ, Vonarx EJ, Pastushok L, Nakagawa M, Katafuchi A, Gruz P, Di Rubbo A, Grice DM, Osmond MJ, Sakamoto AN, et al. (2008) Arabidopsis thaliana Y-family DNA polymerase eta catalyses translesion synthesis and interacts functionally with PCNA2. Plant J 55: 895–908 - PubMed

Publication types

MeSH terms

LinkOut - more resources