. 2016 Mar 22;113(12):3329-34.
doi: 10.1073/pnas.1507706113. Epub 2016 Mar 3.

Sialic acid-modified antigens impose tolerance via inhibition of T-cell proliferation and de novo induction of regulatory T cells

Affiliations

Sialic acid-modified antigens impose tolerance via inhibition of T-cell proliferation and de novo induction of regulatory T cells

Maurizio Perdicchio et al. Proc Natl Acad Sci U S A. .

Abstract

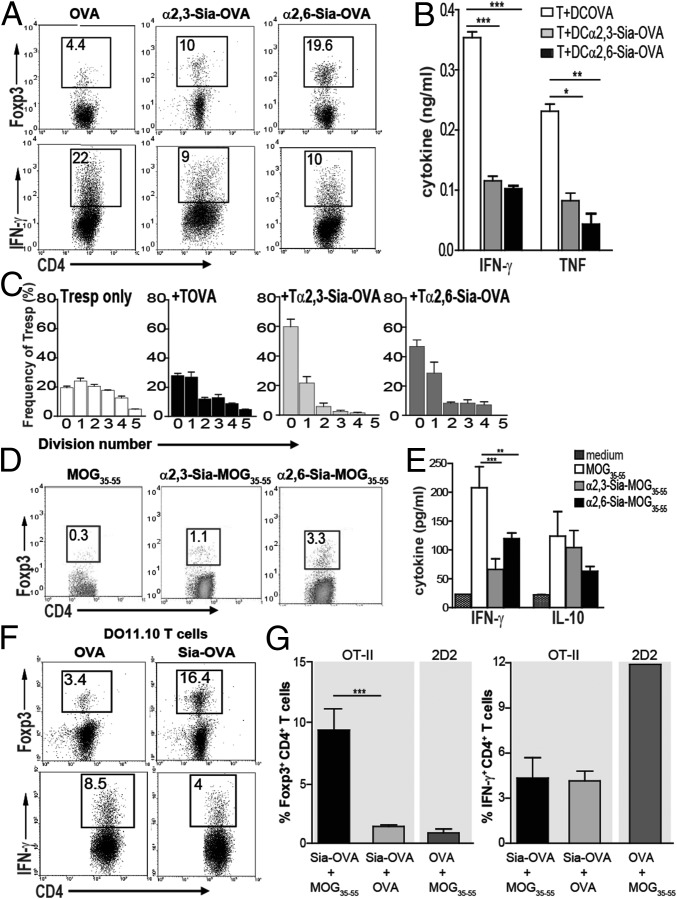
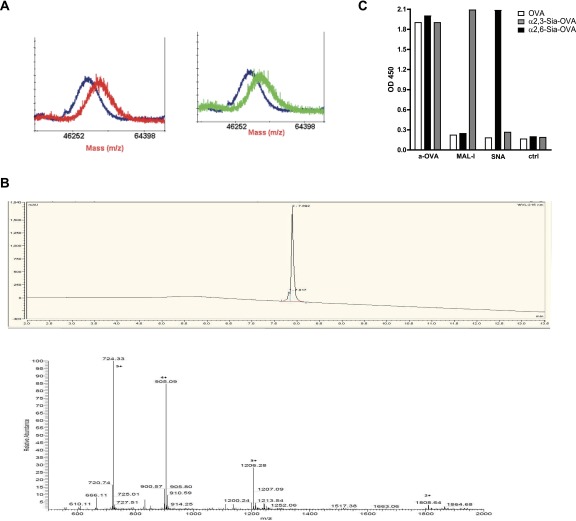
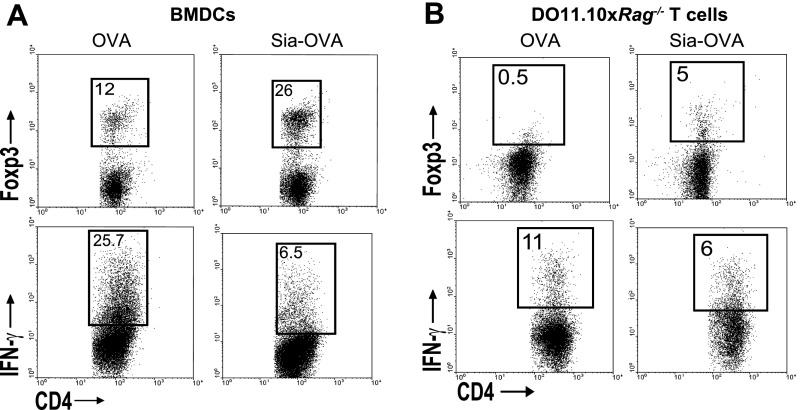
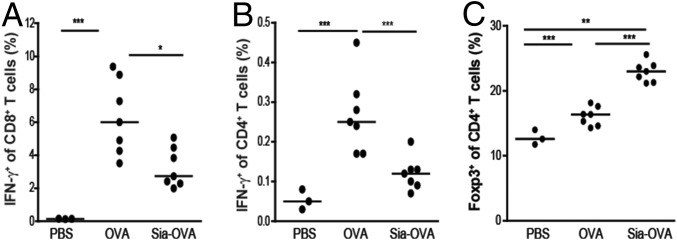
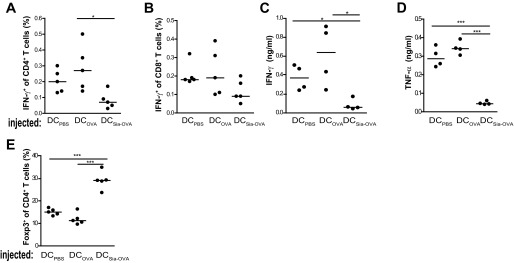
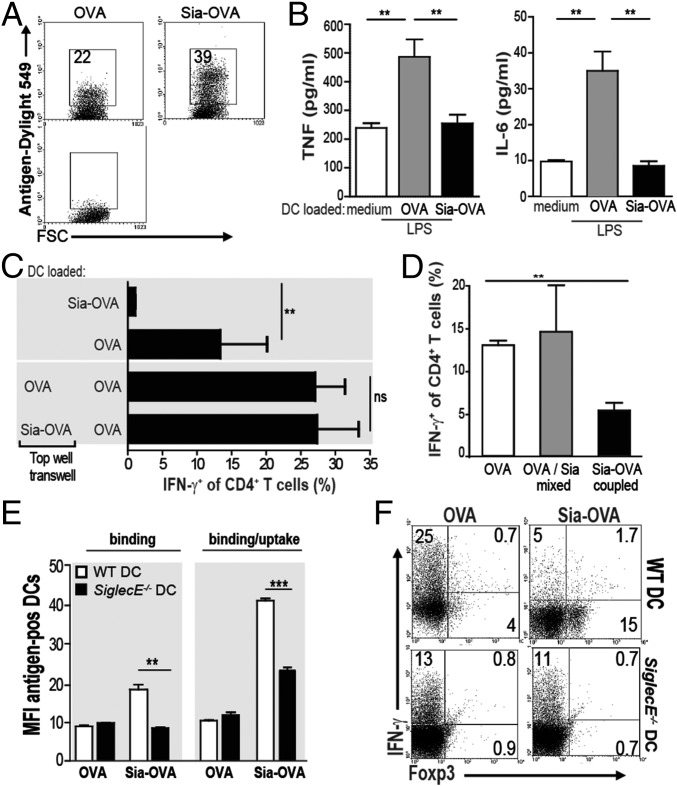
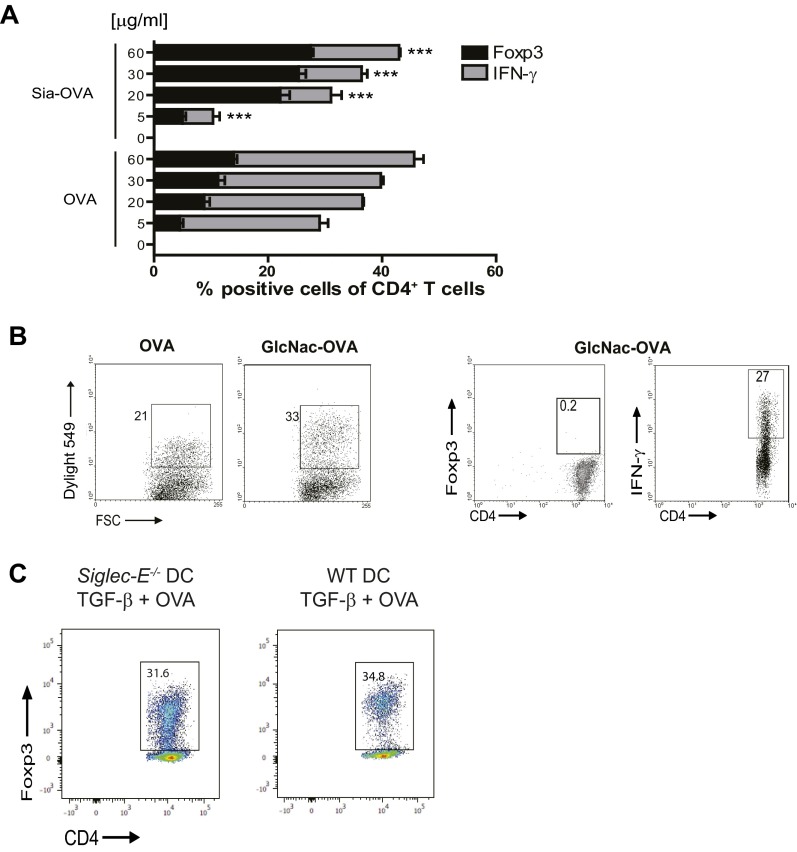
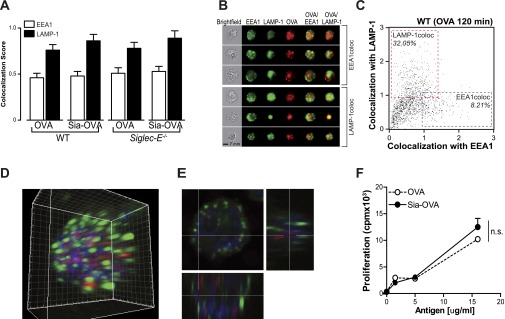
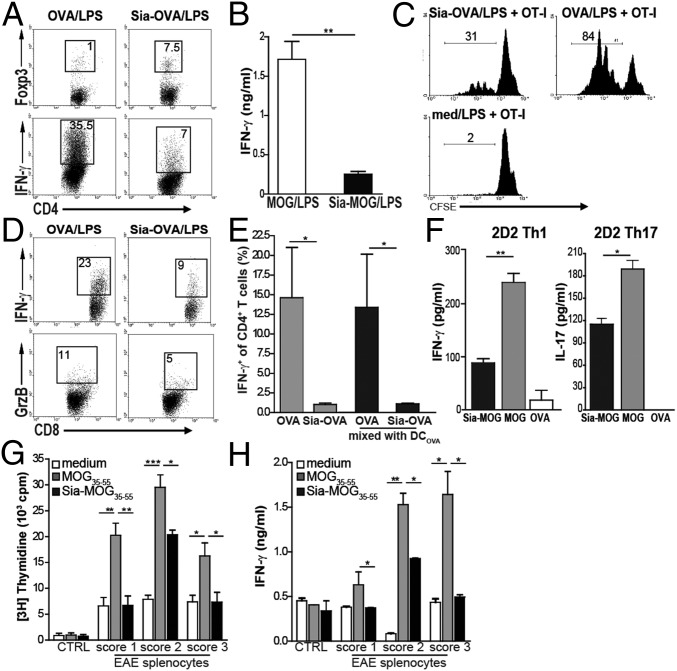
Sialic acids are negatively charged nine-carbon carboxylated monosaccharides that often cap glycans on glycosylated proteins and lipids. Because of their strategic location at the cell surface, sialic acids contribute to interactions that are critical for immune homeostasis via interactions with sialic acid-binding Ig-type lectins (siglecs). In particular, these interactions may be of importance in cases where sialic acids may be overexpressed, such as on certain pathogens and tumors. We now demonstrate that modification of antigens with sialic acids (Sia-antigens) regulates the generation of antigen-specific regulatory T (Treg) cells via dendritic cells (DCs). Additionally, DCs that take up Sia-antigen prevent formation of effector CD4(+) and CD8(+)T cells. Importantly, the regulatory properties endowed on DCs upon Sia-antigen uptake are antigen-specific: only T cells responsive to the sialylated antigen become tolerized. In vivo, injection of Sia-antigen-loaded DCs increased de novo Treg-cell numbers and dampened effector T-cell expansion and IFN-γ production. The dual tolerogenic features that Sia-antigen imposed on DCs are Siglec-E-mediated and maintained under inflammatory conditions. Moreover, loading DCs with Sia-antigens not only inhibited the function of in vitro-established Th1 and Th17 effector T cells but also significantly dampened ex vivo myelin-reactive T cells, present in the circulation of mice with experimental autoimmune encephalomyelitis. These data indicate that sialic acid-modified antigens instruct DCs in an antigen-specific tolerogenic programming, enhancing Treg cells and reducing the generation and propagation of inflammatory T cells. Our data suggest that sialylation of antigens provides an attractive way to induce antigen-specific immune tolerance.

Keywords: dendritic cells; glycans; regulatory T cells; sialic acids; tolerance.


Conflict of interest statement

The authors declare no conflict of interest.

Figures

Fig. 1.
Fig. 1.
Sia-OVA promotes DC-mediated Treg-cell differentiation and prevents effector T-cell generation. (A) Foxp3 and IFN-γ expressed by OT-II T cells cocultured with OVA-, α2,3-Sia-OVA–, or α2,6-Sia-OVA–loaded splenic DCs. The percentage of positive cells is indicated (n = 5). (B) IFN-γ and TNF in supernatants of DC-differentiated OT-II T cells (mean ± SEM; n = 5). (C) Suppressive activity of T cells primed with OVA-, α2,3-Sia-OVA–, or α2,6-Sia-OVA–loaded DCs in a coculture with CFSE-labeled CD4+ Tresp cells (mean frequency Tresp cells/division ± SEM; n = 2). (D) Foxp3 expression in 2D2 T cells differentiated by MOG35–55–, α2,3-Sia-MOG35–55–, or α2,6-Sia-MOG35–55–loaded DCs (n = 3). (E) TNF and IL-10 in supernatants of DC-differentiated 2D2 T cells (mean ± SEM; n = 3). (F) Foxp3 and IFN-γ expression by DO11.10 CD4+ T cells upon coculture with Sia-OVA– or OVA-loaded DCs. The percentage of positive cells is indicated (mean ± SEM; n = 2). (G) Naive CD4+ 2D2 and OT-II T cells were cocultured with DCs loaded with different antigens. The percentage of Foxp3+ and IFN-γ+ T cells is depicted (mean ± SEM; n = 2). ***P < 0.001; **P < 0.01; *P < 0.05.
Fig. S1.
Fig. S1.
Detection of α2,3- and α2,6-linked sialic acids on sialylated antigens. (A) The presence of α2,3- or α2,6-linked sialic acids on OVA was analyzed by MALDI-TOF comparing the mass of the nonmodified OVA (blue line) to the α2,3- (red line) or α2,6-coupled OVA (green line). We confirmed an average substitution of 5.5 sialic acids per OVA. (B) We confirmed the purity (Upper) and mass (Lower) of Sia-MOG by HPLC (Upper, purity > 90%) and mass spectrometry (Lower, visible m/z: 1808 [M+2H]2+; 1206 [M+3H]3+; 905 [M+4H]4+; 724 [M+5H]5+). (C) The antigens were coated, and the presence of α2,3- or α2,6-linked sialic acids was detected by ELISA using MAL-I and SNA lectins, respectively. Additionally, OVA was detected using an anti-OVA antibody. Data are means ± SEM of duplicate measurements and representative of five independent experiments.
Fig. S2.
Fig. S2.
Sia-OVA–loaded BMDCs promote de novo Foxp3+ T-cell generation and prevents effector T-cell generation. (A and B) Flow cytometric detection of Foxp3 and IFN-γ in OT-II (A) or DO11.10×Rag−/− CD4+ (B) T cells cocultured with OVA-, α2,3-Sia-OVA, or α2,6-Sia-OVA–loaded BMDCs. Percentages of positive cells are indicated (n = 5 and n = 2).
Fig. 2.
Fig. 2.
Sia-OVA induces tolerance and prevents the effector immune response in vivo. C57BL/6 mice received 50 µg of Sia-OVA or OVA 1 wk before sensitization with OVA/poly(I:C)/anti-CD40. Frequencies of IFN-γ+CD8+ T cells (A), IFN-γ+CD4+ T cells (B), and Foxp3+CD4+T cells (C) among total splenocytes were determined by flow cytometry. Dots represent individual mice (n = 7/group; bars indicate the median). *P < 0.05; ***P < 0.001; ns, not significant.
Fig. S3.
Fig. S3.
Injection of Sia-OVA–loaded DCs prevents the effector immune response in vivo. For adoptive transfer of antigen-loaded DCs, the DCs were pulsed overnight with 200 µg/mL Sia-OVA or OVA, and 3 × 10⁵ DCs were injected i.v. into each recipient mouse. On day 7, mice were immunized s.c. with 100 µg of OVA/50 µg of CpG. Frequencies of IFN-γ–expressing CD4+ T cells (A) and CD8+ T cells (B) in spleen were determined. Dots represent individual mice (n = 5/group); bars indicate the median. (C and D) IFN-γ and TNF secreted by PMA/ionomycin-restimulated splenocytes (mean ± SEM; n = 5/group). (E) Frequency of Foxp3+ among CD4+ splenocytes. Dots represent individual mice (n = 5/ group); bars indicate the median. *P < 0.05; ***P < 0.001.
Fig. 3.
Fig. 3.
Sia-OVA-DC–mediated Treg-cell generation depends on antigen dose and soluble factors. (A) Binding/uptake of Dylight549-labeled Sia-OVA or OVA by DCs analyzed using flow cytometry (n = 3). (B) Secretion of TNF and IL-6 by DCs incubated with OVA/LPS or Sia-OVA/LPS (mean ± SEM; n = 5). (C) Frequency of IFN-γ+ OT-II cells after differentiation by DCOVA (lower wells) in the presence or absence or Sia-OVA–loaded DCs in the top well of Transwells (mean ± SEM of triplicates; n = 4). (D) IFN-γ+ OT-II T-cell frequencies induced by BMDCs loaded with OVA, Sia-OVA, or a mixture of OVA and sialic acids (mean ± SEM; n = 3). (E) Mean fluorescence intensity (MFI) of bound and/or internalized Dylight549-labeled Sia-OVA or OVA by WT and Siglec-E−/− DCs. (Means ± SEM; n = 4). (F) Foxp3 and IFN-γ expression in OT-II T cells differentiated by antigen-loaded WT or Siglec-E−/− BMDCs (n = 2). ***P < 0.001; **P < 0.01.
Fig. S4.
Fig. S4.
Treg-cell generation depends on the dose of sialylated antigens and is intrinsic to sialic acids. (A) Percentage of Foxp3+ and IFN-γ+ in OT-II T cells that were differentiated by DCs pulsed with the indicated concentrations of Sia-OVA or OVA (mean ± SEM; n = 3). (B) Binding/uptake of Dylight549-labeled OVA or GlcNAc-OVA by DCs (n = 4). GlcNAc-OVA–pulsed DCs were cocultured with naive OT-II T cells, and frequencies of Foxp3+ and IFN-γ+ CD4+ T cells were determined (n = 3). (C) Siglec-E−/− or WT BMDCs were treated with 10 ng/mL TGF-β for 24 h and subsequently loaded with OVA (30 µg/mL) prior to coculture with naive OT-II T cells. Five days later, the frequency of Foxp3+ cells was determined using flow cytometry. Numbers in plots indicate the percentage of Foxp3+CD4+ T cells. ***P < 0.001.
Fig. S5.
Fig. S5.
Sialylation of antigens does not affect the intracellular routing, processing, and presentation of antigens in MHC-II. (A) WT or Siglec-E−/− BMDCs were incubated with atto633-labeled Sia-OVA or native OVA, and colocalization with EEA-1 (open bars) and LAMP-1 (solid bars) was assessed after 2 h using imaging flow cytometry. (B) Representative images of cells with high colocalization of OVA with EEA-1 or LAMP-1. (C) Representative bivariate plot of colocalization scores of OVA with EEA-1 or LAMP-1 in WT BMDCs. (D and E) WT or Siglec-E−/− BMDCs were incubated with atto633-labeled Sia-OVA for 2 h, and colocalization with EEA-1 (green) and LAMP-1 (blue) was analyzed using CLSM. The 3D rendering of a 20-μm Z-stack is shown. (E) Cross-section focusing in an OVA-rich area. (F) Proliferation of OT-II cells after 3 d of coculture with Sia-OVA or native OVA-loaded DCs (mean ± SEM; n = 3); ns, not significant (Student’s t test).
Fig. 4.
Fig. 4.
Sia-antigen also modulates DCs in an inflammatory environment. DCs were loaded with antigens in the presence of LPS and cocultured with OT-II or OT-I T cells. (A) Flow cytometric analysis of Foxp3 and IFN-γ expression; the percentage of positive cells is indicated. (B) IFN-γ produced by 2D2 T cells cocultured with DCs pulsed with MOG35–55/LPS, α2,3-Sia-MOG35–55/LPS, or α2,6-Sia-MOG35–55/LPS (mean ± SEM; n = 3). CFSE-labeled OT-I T cells cocultured with Sia-OVA/LPS or OVA/LPS–loaded DCs. (C and D) Percentages of divided cells (C) and of IFN-γ+ and GrB+ OT-I cells (D) are shown (n = 3). (E) Proportion of IFN-γ+CD4+ T cells in cultures with DCs loaded with Sia-OVA or OVA mixed 1:1 with DCOVA. Control cultures contain only DCSia-OVA or DCOVA. (F) IFN-γ or IL-17 production by in vitro-generated Th1 and Th17 cells after reactivation by antigen-loaded DCs. (G and H) Ex vivo restimulation of spleens from mice induced for EAE with Sia-MOG35–55–loaded (black bars) or MOG35–55–loaded (gray bars) DCs. Medium-treated DCs (white bars) and spleens of naive mice were assessed as controls. Four days later, MOG-specific T-cell proliferation (G) and IFN-γ in culture supernatants (H) was determined (means ± SEM; n = 3 mice/condition). ***P < 0.001; **P < 0.01; *P < 0.05.

References

    1. Sakaguchi S, Sakaguchi N, Asano M, Itoh M, Toda M. Immunologic self-tolerance maintained by activated T cells expressing IL-2 receptor alpha-chains (CD25). Breakdown of a single mechanism of self-tolerance causes various autoimmune diseases. J Immunol. 1995;155(3):1151–1164. - PubMed
    1. Viglietta V, Baecher-Allan C, Weiner HL, Hafler DA. Loss of functional suppression by CD4+CD25+ regulatory T cells in patients with multiple sclerosis. J Exp Med. 2004;199(7):971–979. - PMC - PubMed
    1. Long SA, Buckner JH. CD4+FOXP3+ T regulatory cells in human autoimmunity: More than a numbers game. J Immunol. 2011;187(5):2061–2066. - PMC - PubMed
    1. Buckner JH. Mechanisms of impaired regulation by CD4(+)CD25(+)FOXP3(+) regulatory T cells in human autoimmune diseases. Nat Rev Immunol. 2010;10(12):849–859. - PMC - PubMed
    1. Beavis PA, et al. Resistance to regulatory T cell-mediated suppression in rheumatoid arthritis can be bypassed by ectopic foxp3 expression in pathogenic synovial T cells. Proc Natl Acad Sci USA. 2011;108(40):16717–16722. - PMC - PubMed

Publication types