

Downregulation of Melanoma Cell Adhesion Molecule (MCAM/CD146) Accelerates Cellular Senescence in Human Umbilical Cord Blood-Derived Mesenchymal Stem Cells
- PMID: 26941359
- PMCID: PMC4798732
- DOI: 10.5966/sctm.2015-0109
Downregulation of Melanoma Cell Adhesion Molecule (MCAM/CD146) Accelerates Cellular Senescence in Human Umbilical Cord Blood-Derived Mesenchymal Stem Cells
Abstract
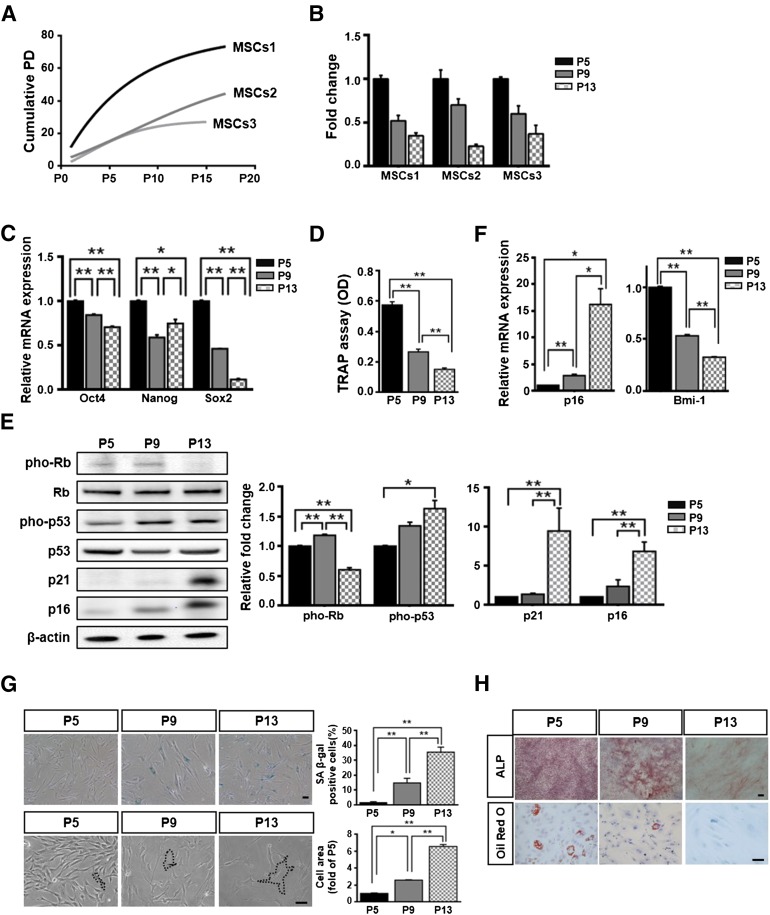
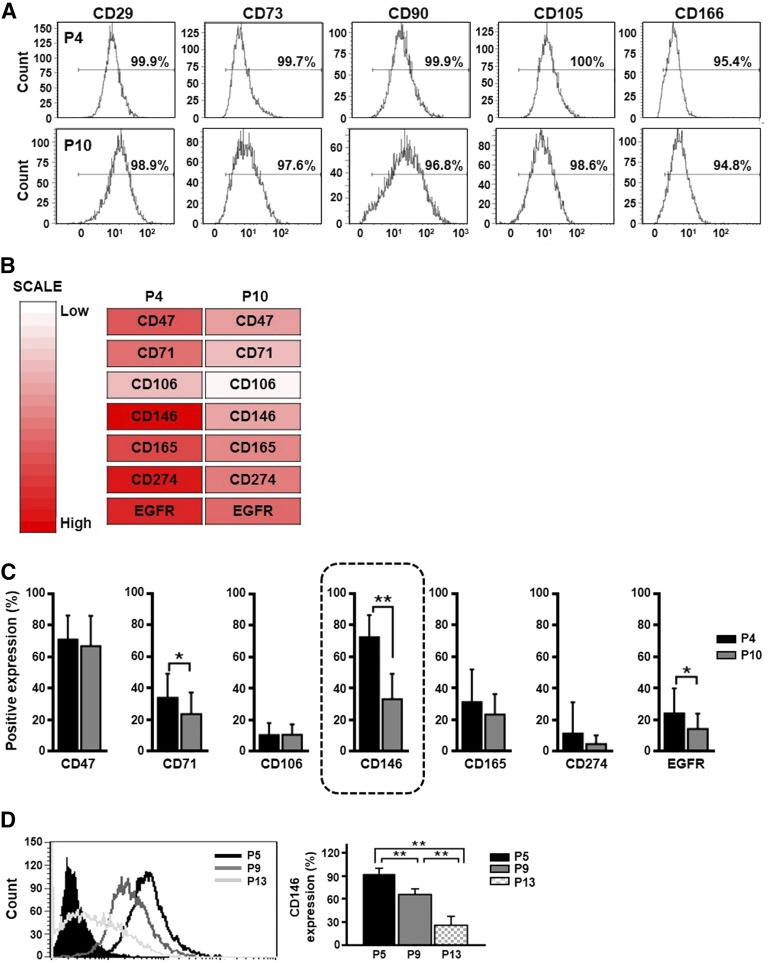
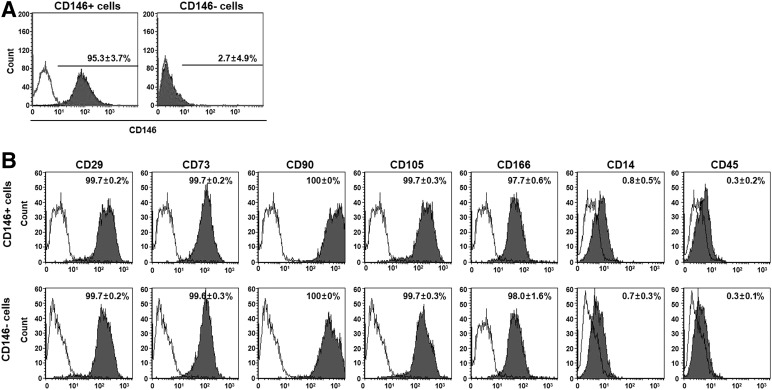
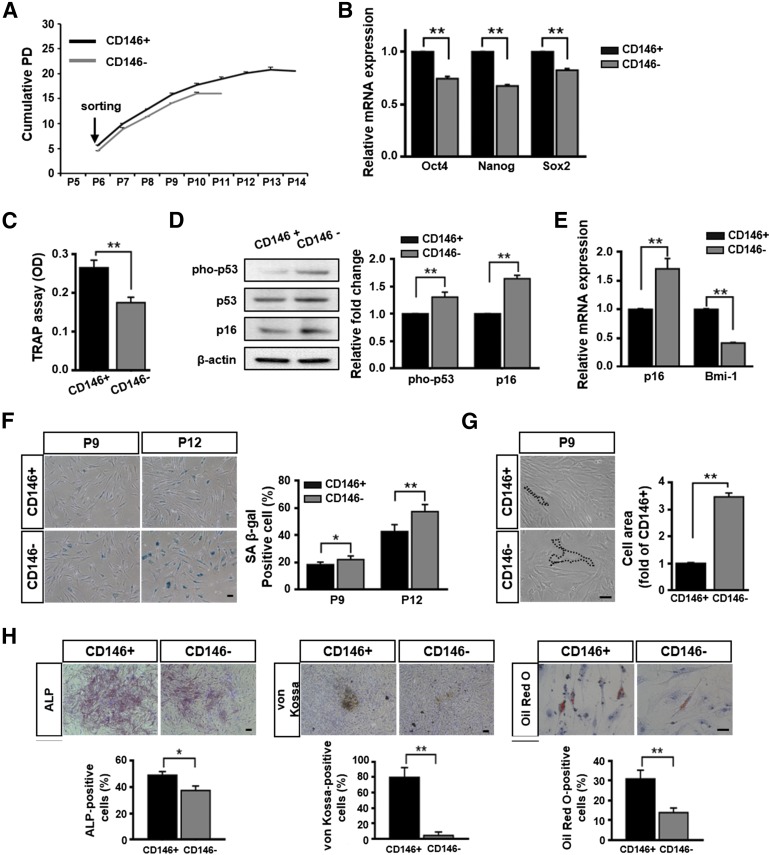
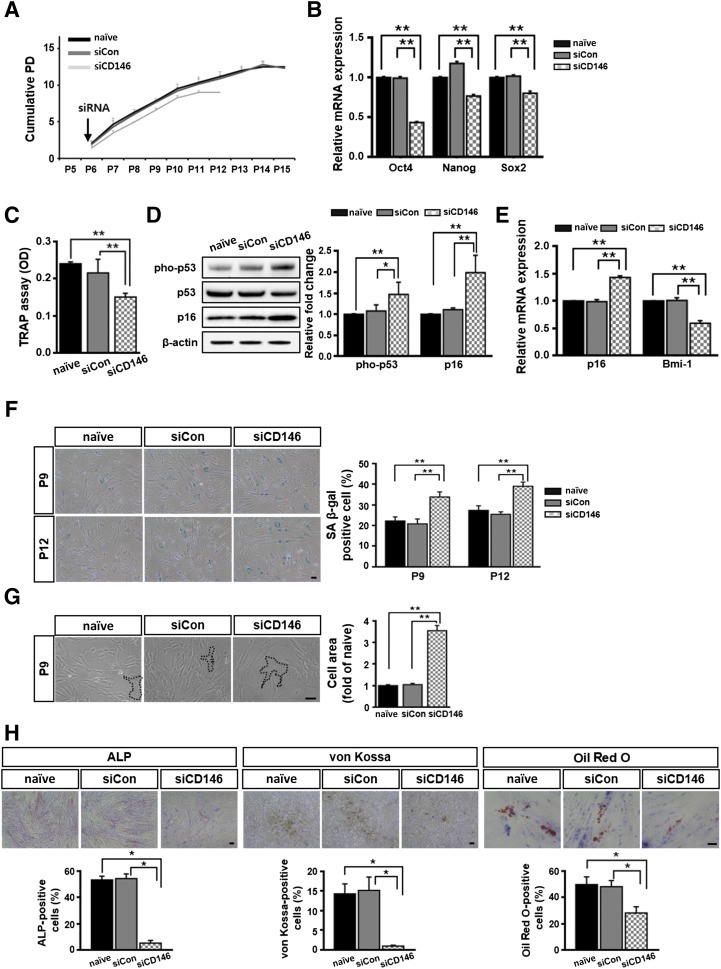
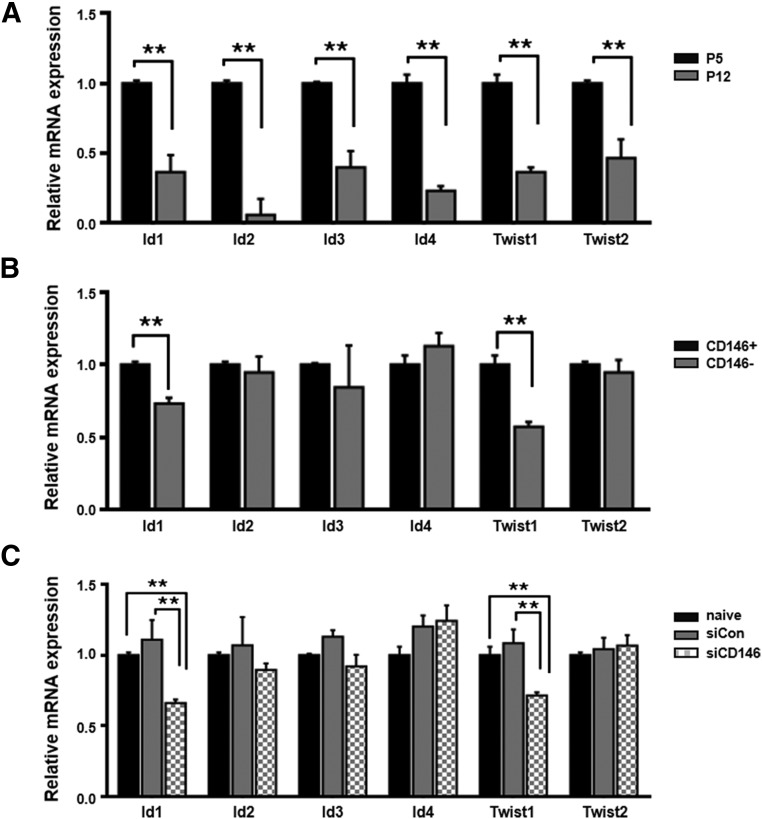
Therapeutic applications of mesenchymal stem cells (MSCs) for treating various diseases have increased in recent years. To ensure that treatment is effective, an adequate MSC dosage should be determined before these cells are used for therapeutic purposes. To obtain a sufficient number of cells for therapeutic applications, MSCs must be expanded in long-term cell culture, which inevitably triggers cellular senescence. In this study, we investigated the surface markers of human umbilical cord blood-derived MSCs (hUCB-MSCs) associated with cellular senescence using fluorescence-activated cell sorting analysis and 242 cell surface-marker antibodies. Among these surface proteins, we selected the melanoma cell adhesion molecule (MCAM/CD146) for further study with the aim of validating observed expression differences and investigating the associated implications in hUCB-MSCs during cellular senescence. We observed that CD146 expression markedly decreased in hUCB-MSCs following prolonged in vitro expansion. Using preparative sorting, we found that hUCB-MSCs with high CD146 expression displayed high growth rates, multilineage differentiation, expression of stemness markers, and telomerase activity, as well as significantly lower expression of the senescence markers p16, p21, p53, and senescence-associated β-galactosidase, compared with that observed in hUCB-MSCs with low-level CD146 expression. In contrast, CD146 downregulation with small interfering RNAs enhanced the senescence phenotype. In addition, CD146 suppression in hUCB-MSCs caused downregulation of other cellular senescence regulators, including Bmi-1, Id1, and Twist1. Collectively, our results suggest that CD146 regulates cellular senescence; thus, it could be used as a therapeutic marker to identify senescent hUCB-MSCs.
Significance: One of the fundamental requirements for mesenchymal stem cell (MSC)-based therapies is the expansion of MSCs during long-term culture because a sufficient number of functional cells is required. However, long-term growth inevitably induces cellular senescence, which potentially causes poor clinical outcomes by inducing growth arrest and the loss of stem cell properties. Thus, the identification of markers for evaluating the status of MSC senescence during long-term culture may enhance the success of MSC-based therapy. This study provides strong evidence that CD146 is a novel and useful marker for predicting senescence in human umbilical cord blood-derived MSCs (hUCB-MSCs), and CD146 can potentially be applied in quality-control assessments of hUCB-MSC-based therapy.
Keywords: Bmi-1; Cell surface marker; Cellular senescence; Human umbilical cord blood-derived mesenchymal stem cells; Id1; Melanoma cell adhesion molecule (CD146); Mesenchymal stem cell-based therapy; Twist1.
©AlphaMed Press.
Figures
Similar articles
-
Neural differentiation of brain-derived neurotrophic factor-expressing human umbilical cord blood-derived mesenchymal stem cells in culture via TrkB-mediated ERK and β-catenin phosphorylation and following transplantation into the developing brain.Cell Transplant. 2011;20(11-12):1855-66. doi: 10.3727/096368910X557236. Epub 2011 Mar 4. Cell Transplant. 2011. PMID: 21375801
-
Human umbilical cord blood mesenchymal stem cells reduce colitis in mice by activating NOD2 signaling to COX2.Gastroenterology. 2013 Dec;145(6):1392-403.e1-8. doi: 10.1053/j.gastro.2013.08.033. Epub 2013 Aug 21. Gastroenterology. 2013. PMID: 23973922
-
Isolation and prolonged expansion of oral mesenchymal stem cells under clinical-grade, GMP-compliant conditions differentially affects "stemness" properties.Stem Cell Res Ther. 2017 Nov 2;8(1):247. doi: 10.1186/s13287-017-0705-0. Stem Cell Res Ther. 2017. PMID: 29096714 Free PMC article.
-
Senescence in Human Mesenchymal Stem Cells: Functional Changes and Implications in Stem Cell-Based Therapy.Int J Mol Sci. 2016 Jul 19;17(7):1164. doi: 10.3390/ijms17071164. Int J Mol Sci. 2016. PMID: 27447618 Free PMC article. Review.
-
Senescence of mesenchymal stem cells (Review).Int J Mol Med. 2017 Apr;39(4):775-782. doi: 10.3892/ijmm.2017.2912. Epub 2017 Mar 9. Int J Mol Med. 2017. PMID: 28290609 Review.
Cited by
-
CD146, a therapeutic target involved in cell plasticity.Sci China Life Sci. 2024 Aug;67(8):1563-1578. doi: 10.1007/s11427-023-2521-x. Epub 2024 Apr 9. Sci China Life Sci. 2024. PMID: 38613742 Review.
-
Potential Research Tool of Stem Cells from Human Exfoliated Deciduous Teeth: Lentiviral Bmi-1 Immortalization with EGFP Marker.Stem Cells Int. 2019 Mar 10;2019:3526409. doi: 10.1155/2019/3526409. eCollection 2019. Stem Cells Int. 2019. PMID: 30984268 Free PMC article.
-
Differential SOD2 and GSTZ1 profiles contribute to contrasting dental pulp stem cell susceptibilities to oxidative damage and premature senescence.Stem Cell Res Ther. 2021 Feb 17;12(1):142. doi: 10.1186/s13287-021-02209-9. Stem Cell Res Ther. 2021. PMID: 33596998 Free PMC article.
-
Primary Cilia Mediate Wnt5a/β-catenin Signaling to Regulate Adipogenic Differentiation of Human Umbilical Cord Blood-Derived Mesenchymal Stem Cells Following Calcium Induction.Tissue Eng Regen Med. 2020 Apr;17(2):193-202. doi: 10.1007/s13770-019-00237-4. Epub 2020 Feb 1. Tissue Eng Regen Med. 2020. PMID: 32008170 Free PMC article.
-
Manufacturing of primed mesenchymal stromal cells for therapy.Nat Biomed Eng. 2019 Feb;3(2):90-104. doi: 10.1038/s41551-018-0325-8. Epub 2019 Jan 28. Nat Biomed Eng. 2019. PMID: 30944433 Review.
References
-
- Lee OK, Kuo TK, Chen WM, et al. Isolation of multipotent mesenchymal stem cells from umbilical cord blood. Blood. 2004;103:1669–1675. - PubMed
-
- Yang SE, Ha CW, Jung M, et al. Mesenchymal stem/progenitor cells developed in cultures from UC blood. Cytotherapy. 2004;6:476–486. - PubMed
-
- Lee M, Jeong SY, Ha J, et al. Low immunogenicity of allogeneic human umbilical cord blood-derived mesenchymal stem cells in vitro and in vivo. Biochem Biophys Res Commun. 2014;446:983–989. - PubMed
-
- Kim JY, Kim DH, Kim DS, et al. Galectin-3 secreted by human umbilical cord blood-derived mesenchymal stem cells reduces amyloid-beta42 neurotoxicity in vitro. FEBS Lett. 2010;584:3601–3608. - PubMed
Publication types
MeSH terms
Substances
LinkOut - more resources
Full Text Sources
Other Literature Sources
Research Materials
Miscellaneous
