. 2016 Feb 23:10:47.
doi: 10.3389/fnins.2016.00047. eCollection 2016.

Classification of Single Normal and Alzheimer's Disease Individuals from Cortical Sources of Resting State EEG Rhythms

Affiliations

Classification of Single Normal and Alzheimer's Disease Individuals from Cortical Sources of Resting State EEG Rhythms

Claudio Babiloni et al. Front Neurosci. .

Abstract

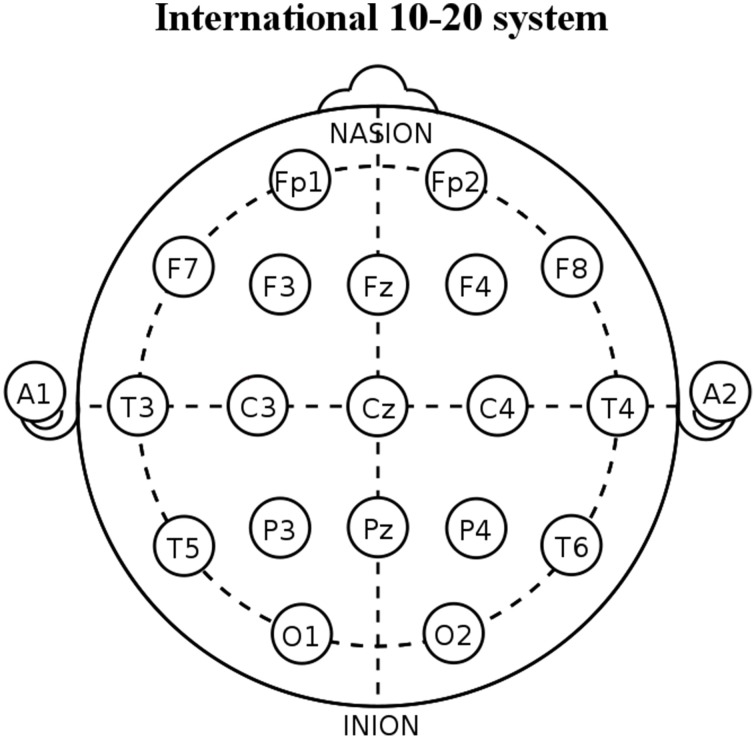
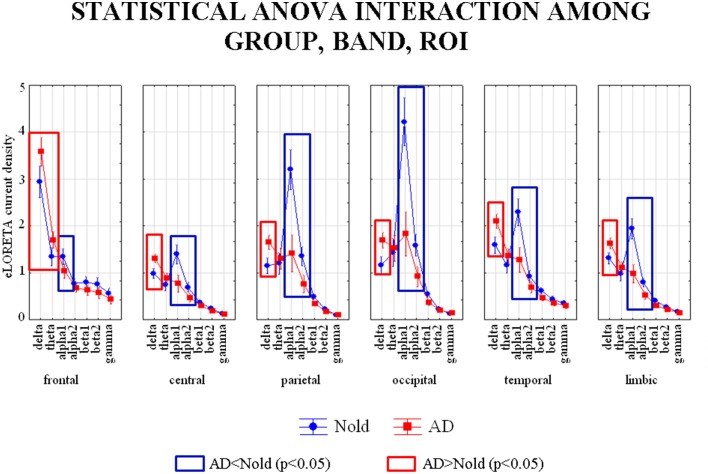
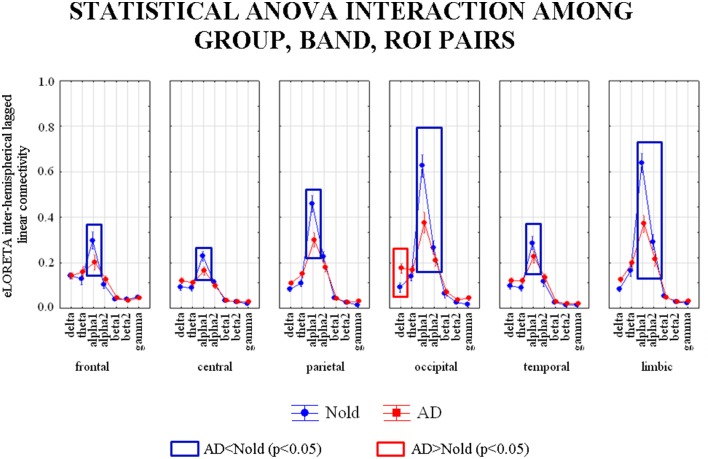
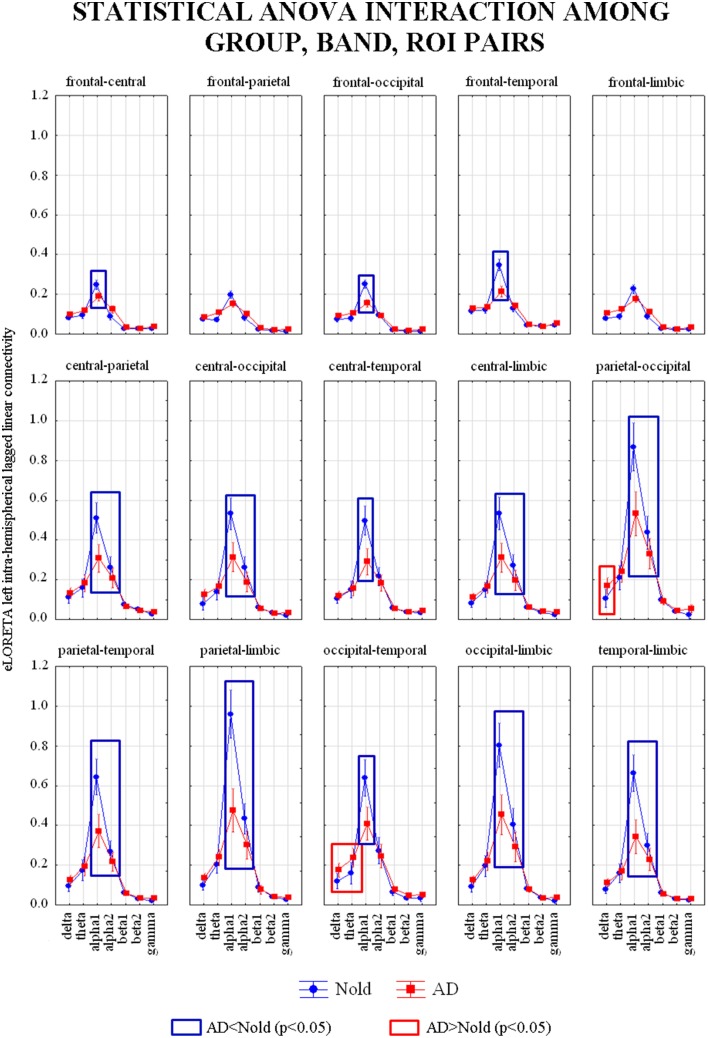
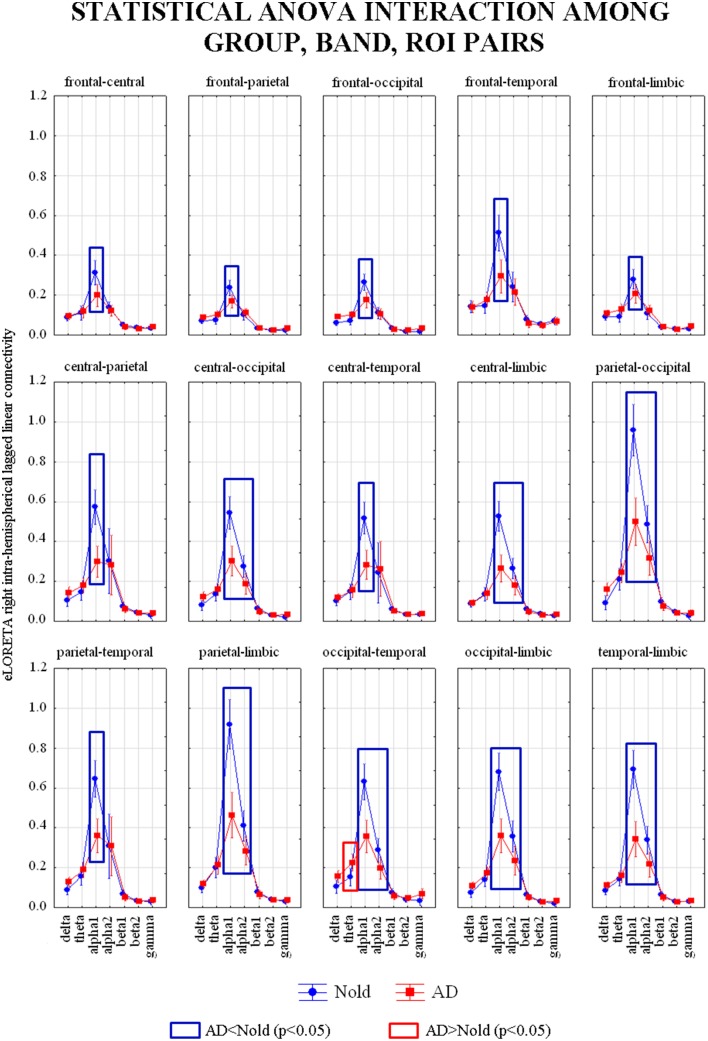
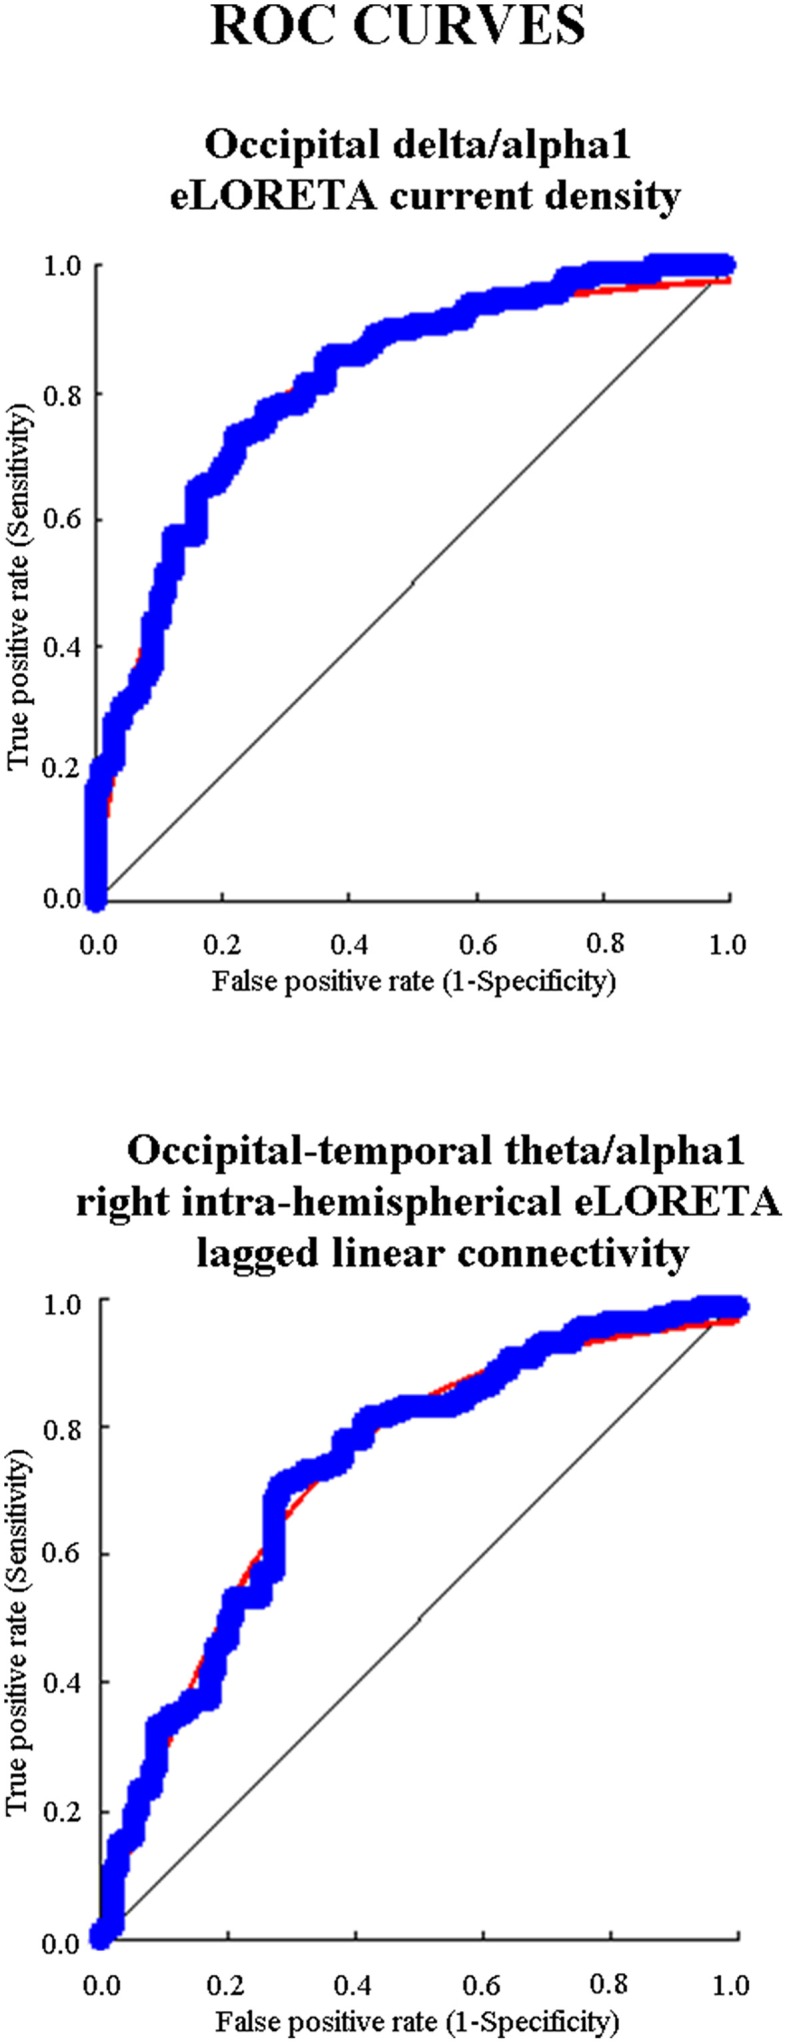
Previous studies have shown abnormal power and functional connectivity of resting state electroencephalographic (EEG) rhythms in groups of Alzheimer's disease (AD) compared to healthy elderly (Nold) subjects. Here we tested the best classification rate of 120 AD patients and 100 matched Nold subjects using EEG markers based on cortical sources of power and functional connectivity of these rhythms. EEG data were recorded during resting state eyes-closed condition. Exact low-resolution brain electromagnetic tomography (eLORETA) estimated the power and functional connectivity of cortical sources in frontal, central, parietal, occipital, temporal, and limbic regions. Delta (2-4 Hz), theta (4-8 Hz), alpha 1 (8-10.5 Hz), alpha 2 (10.5-13 Hz), beta 1 (13-20 Hz), beta 2 (20-30 Hz), and gamma (30-40 Hz) were the frequency bands of interest. The classification rates of interest were those with an area under the receiver operating characteristic curve (AUROC) higher than 0.7 as a threshold for a moderate classification rate (i.e., 70%). Results showed that the following EEG markers overcame this threshold: (i) central, parietal, occipital, temporal, and limbic delta/alpha 1 current density; (ii) central, parietal, occipital temporal, and limbic delta/alpha 2 current density; (iii) frontal theta/alpha 1 current density; (iv) occipital delta/alpha 1 inter-hemispherical connectivity; (v) occipital-temporal theta/alpha 1 right and left intra-hemispherical connectivity; and (vi) parietal-limbic alpha 1 right intra-hemispherical connectivity. Occipital delta/alpha 1 current density showed the best classification rate (sensitivity of 73.3%, specificity of 78%, accuracy of 75.5%, and AUROC of 82%). These results suggest that EEG source markers can classify Nold and AD individuals with a moderate classification rate higher than 80%.

Keywords: Alzheimer's disease (AD); alpha rhythms; area under the receiver operating characteristic curve (AUROC); delta rhythms; electroencephalography (EEG); exact low-resolution brain electromagnetic tomography (eLORETA); lagged linear connectivity; spectral coherence.


Figures

Figure 1
Figure 1
Diagram showing the placement of the 19 scalp electrodes used for the present electroencephalographic (EEG) recordings. These electrodes are positioned according to the International 10–20 System (i.e., Fp1, Fp2, F7, F3, Fz, F4, F8, T3, C3, Cz, C4, T4, T5, P3, Pz, P4, T6, O1, and O2). In the figure, A1 and A2 indicate the position of linked earlobe reference electrodes.
Figure 2
Figure 2
Diagram showing the grand average of regional normalized exact low-resolution brain electromagnetic tomography (eLORETA) solutions (i.e., source activity) relative to a statistically significant ANOVA interaction [F(30, 6540) = 18.727, p < 0.0001] among the factors Group (AD, Nold), Band (delta, theta, alpha 1, alpha 2, beta 1, beta 2, gamma), and ROI (central, frontal, parietal, occipital, temporal, limbic). Subjects' age, education, IAF, and gender were used as covariates. Legend: the rectangles indicate the cortical regions and frequency bands in which source activity presented the statistically significant LORETA pattern of source activity Nold ≠ AD (Duncan test, p < 0.05).
Figure 3
Figure 3
Diagram showing the grand average of the EEG inter-hemispherical lagged linear connectivity computed between left and right hemispheres in the six regions of interest (ROI). These values refer a statistically significant ANOVA interaction [F(30, 6540) = 4.8771, p < 0.0001] among the factors Group (Nold, and MCI), Band (delta, theta, alpha 1, alpha 2, beta 1, beta 2, gamma), and ROI pairs (frontal left-frontal right, central left-central right, parietal left-parietal right, occipital left-occipital right, temporal left-temporal right, and limbic left-limbic right). Subjects' age, education, IAF, and gender were used as covariates. Legend: the rectangles indicate the ROIs and frequency bands in which connectivity values presented the pattern Nold ≠ AD (Duncan test, p < 0.05).
Figure 4
Figure 4
Diagram showing the grand average of the EEG intra-hemispherical lagged linear connectivity computed between each pair of regions of interest (ROI) in the left hemisphere. These values refer a statistically significant ANOVA interaction [F(84, 18312) = 8.5942, p < 0.0001] among the factors Group (AD, Nold), ROI pairs (frontal-central, frontal-parietal, frontal-occipital, frontal-temporal, frontal-limbic, central-parietal, central-occipital, central, temporal, central-limbic, parietal-occipital, parietal-temporal, parietal-limbic, occipital-temporal, occipital-limbic, and temporal-limbic), and Band (delta, theta, alpha 1, alpha 2, beta 1, beta 2, gamma). Subjects' age, education, IAF, and gender were used as covariates. Legend: the rectangles indicate the ROI pairs and frequency bands in which connectivity values presented the pattern Nold ≠ AD (Duncan test, p < 0.05).
Figure 5
Figure 5
Diagram showing the grand average of the EEG intra-hemispherical lagged linear connectivity computed between each pair of regions of interest (ROI) in the right hemisphere. These values refer a statistically significant ANOVA interaction [F(84, 18312) = 4.6296, p < 0.0001] among the factors Group (AD, Nold), ROI pairs (frontal-central, frontal-parietal, frontal-occipital, frontal-temporal, frontal-limbic, central-parietal, central-occipital, central-temporal, central-limbic, parietal-occipital, parietal-temporal, parietal-limbic, occipital-temporal, occipital-limbic, and temporal-limbic), and Band (delta, theta, alpha 1, alpha 2, beta 1, beta 2, gamma). Subjects' age, education, IAF, and gender were used as covariates. Legend: the rectangles indicate the ROI pairs and frequency bands in which connectivity values presented the pattern Nold ≠ AD (Duncan test, p < 0.05).
Figure 6
Figure 6
Diagram showing the ROC (receiver operating characteristic) curves that illustrate the performance of the EEG markers with the best classification rate of single Nold and AD individuals. The upper panel shows the best EEG marker for source activity and the bottom panel the best EEG maker for functional connectivity. These EEG markers had an area under the ROC curve (AUROC) higher than 0.70 (i.e., 70%), which is the threshold of a moderate classification performance.
Figure 7
Figure 7
Mean and SD-values of cortical gray matter (GM), subcortical white matter (WM), and cerebrospinal fluid (CSF) normalized volumes as indexes of brain structural integrity extracted by magnetic resonance imaging (MRI) in a subpopulation of 39 AD patients having MRI data associated to EEG recordings. The values are reported in the AD subgroup negative to the EEG marker (AD−; n = 12) and in the AD subgroup positive to the EEG marker (AD+; n = 27). These values refer to an ANOVA design showing a statistically significant interaction [F(2, 74) = 3.3761, p < 0.05] between the factors Group (AD−, AD+) and Volume (GM, WM, CSF). Asterisks indicate the p level of the statistical differences between the two AD subgroups obtained by Duncan post-hoc testing.

References

    1. Adler G., Brassen S., Jajcevic A. (2003). EEG coherence in Alzheimer's dementia. J. Neural Transm. 110, 1051–1058. 10.1007/s00702-003-0024-8 - DOI - PubMed
    1. Anderer P., Saletu B., Klöppel B., Semlitsch H. V., Werner H. (1994). Discrimination between demented patients and normals based on topographic EEG slow wave activity: comparison between z statistics, discriminant analysis and artificial neural network classifiers. Electroencephalogr. Clin. Neurophysiol. 91, 108–117. 10.1016/0013-4694(94)90032-9 - DOI - PubMed
    1. Ashburner J., Friston K. (1997). Multimodal image coregistration and partitioning—A unified framework. Neuroimage 6, 209–217. 10.1006/nimg.1997.0290 - DOI - PubMed
    1. Babiloni C., Binetti G., Cassetta E., Cerboneschi D., Dal Forno G., Del Percio C., et al. . (2004a). Mapping distributed sources of cortical rhythms in mild Alzheimer's disease. A multicentric EEG study. Neuroimage 22, 57–67. 10.1016/j.neuroimage.2003.09.028 - DOI - PubMed
    1. Babiloni C., Binetti G., Cassetta E., Del Forno G., Percio C., Del Ferreri F., et al. . (2006a). Sources of cortical rhythms change as a function of cognitive impairment in pathological aging: a multicenter study. Clin. Neurophysiol. 117, 252–268. 10.1016/j.clinph.2005.09.019 - DOI - PubMed

LinkOut - more resources