. 2016 Feb 23:10:14.
doi: 10.3389/fnsys.2016.00014. eCollection 2016.

Rheotaxis of Larval Zebrafish: Behavioral Study of a Multi-Sensory Process

Affiliations

Rheotaxis of Larval Zebrafish: Behavioral Study of a Multi-Sensory Process

Raphaël Olive et al. Front Syst Neurosci. .

Abstract

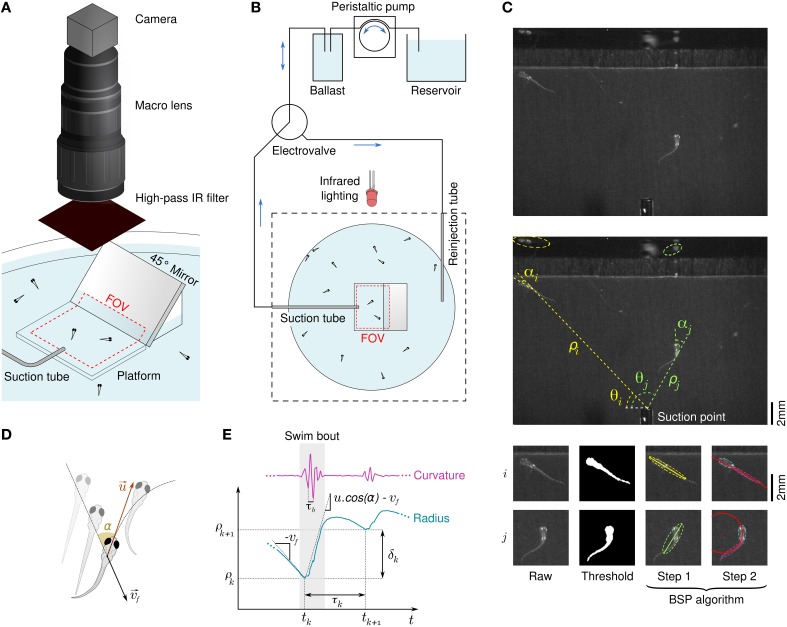
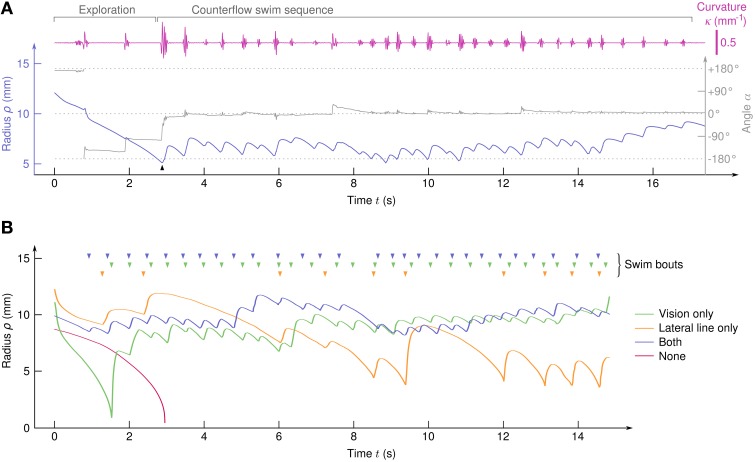
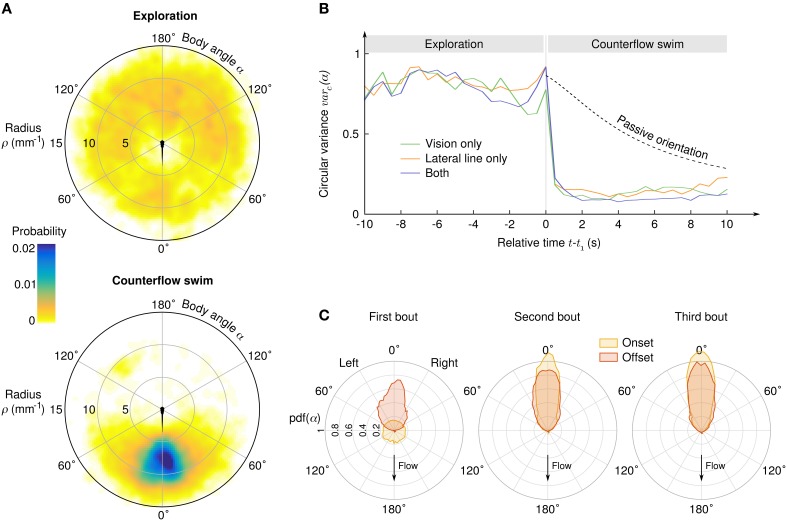
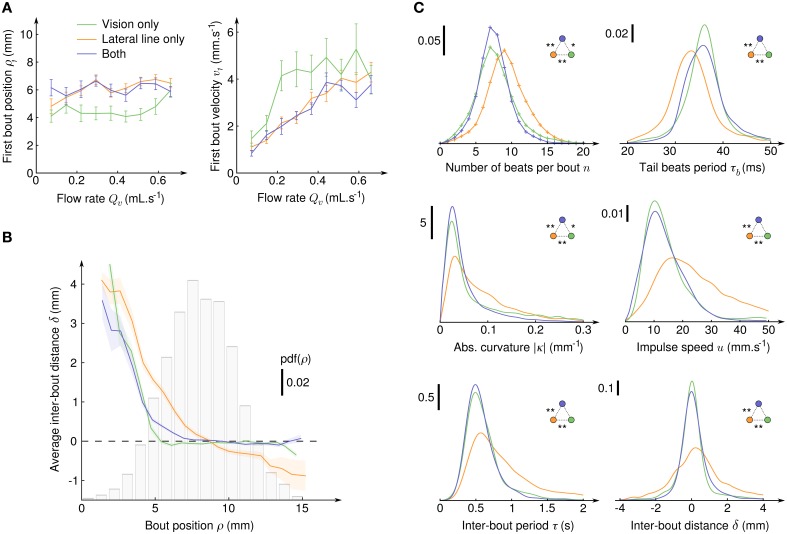
Awake animals unceasingly perceive sensory inputs with great variability of nature and intensity, and understanding how the nervous system manages this continuous flow of diverse information to get a coherent representation of the environment is arguably a central question in systems neuroscience. Rheotaxis, the ability shared by most aquatic species to orient toward a current and swim to hold position, is an innate and robust multi-sensory behavior that is known to involve the lateral line and visual systems. To facilitate the neuroethological study of rheotaxic behavior in larval zebrafish we developed an assay for freely swimming larvae that allows for high experimental throughtput, large statistic and a fine description of the behavior. We show that there exist a clear transition from exploration to counterflow swim, and by changing the sensory modalities accessible to the fishes (visual only, lateral line only or both) and comparing the swim patterns at different ages we were able to detect and characterize two different mechanisms for position holding, one mediated by the lateral line and one mediated by the visual system. We also found that when both sensory modalities are accessible the visual system overshadows the lateral line, suggesting that at the larval stage the sensory inputs are not merged to finely tune the behavior but that redundant information pathways may be used as functional fallbacks.

Keywords: behavior; lateral line; multi-sensory integration; rheotaxis; vision; zebrafish.


Figures

Figure 1
Figure 1
Behavioral response of freely swimming zebrafish larvae to a radial flow. (A) Schematic diagram of the rheotaxis assay. Zebrafish larvae are spread all across the pool and a thin tube creates a radial flow by aspiration. The field of view (FOV) is a rectangle in the center of the assay which comprises a platform that locally raises the ground and the bottom part of a 45° mirror. An infrared-sensitive camera continuously images the FOV at a framerate of 250 Hz. (B) Schematic view of the flow control system. The suction tube is connected to a ballast, a peristaltic pump, and a reservoir. A computer-driven electrovalve allows to reinject water orthoradially to periodically randomize the larvae positions. (C) Illustration of the image processing algorithm. Raw grayscale images (top) are substracted to a background image and thresholded to materialize binarized larvae bodies (bottom left), from which polar coordinates [ρ(t), θ(t)] are derived (center). A BSP tree (bottom-right) is used to obtain the equivalent ellipses of the head and tail and define the body angle (head angle) α(t) and body curvature κ(t). (D) Scheme defining the fluid velocity vf and the bout impulse speed u. (E) Swim bouts are located on the basis of the curvature's trace. For each swim bout k we define the radius ρk where the bout started and the inter-bout delay / distance, respectively τk = tk + 1tk and δk = ρk + 1 − ρk.
Figure 2
Figure 2
Typical trajectories. (A) Traces of ρ(t), α(t), and κ(t) for a sample trajectory of a larva with both the visual system and the lateral line. A counterflow swim sequence of 31 bouts starts at t≃3s (arrow). (B) Typical trajectories of four larvae in the different sensory conditions. (top) Arrowheads indicate the swim bouts.
Figure 3
Figure 3
Transition from exploration to counterflow swim. (A) Probability density of the suction point's location in the reference frame of the larva, before (top) and during (bottom) the counterflow swim sequence. (B) Circular variance of α as a function of the time relative to the first bout of the CSS, for three different sensory conditions. The “passive orientation” curve has been obtained numerically by computing the circular variance of putative trajectories of inert larvae with the same initial conditions (position and body angle). (C) Distributions of the body angle α at the onset (yellow) and offset (red) of the first three bouts of the CSS.
Figure 4
Figure 4
Initiation, characterization and regulation of counterflow swim sequences. (A) Average radial position ρ1 (left) and fluid velocity v1 (right) at the onset of the first bout of the CSS as a function of the suction flow rate, for the three sensory conditions where CSS is observed. Error bars: standard error. (B) Average inter-bout distance δ as a function of the bout radial position ρ during the CSS. The dashed line at δ = 0 indicates perfect distance holding. The bar plot shows the probability density function of ρ for all three sensory conditions. The colored transparent surfaces indicate standard errors. (C) Probability density functions of six quantities characterizing the intra- and inter-bout behavior during the CSS for the three sensory conditions. Pdf were obtained with kernel density estimation with Gaussian kernels: σkn=0.75, σkτb=1, σk|κ|=0.01, σku=2, σkτ=0.075, and σkδ=0.25. Two-sample Kolmogorov-Smirnov tests were used to determine if distributions are significantly different from each other (*p < 10−3 and **p < 10−6).
Figure 5
Figure 5
Evolution of the counterflow swimming patterns with age for the different sensory conditions. (A) Average number of tail beats per bout n, (B) mean absolute curvature |κ|, (C) mean tail beat period τb, (D) average bout impulse speed u, (E) average inter-bout period τ, and (F) average inter-bout distance δ as a function of the larval stage for the three sensory conditions showing CSS. Error bars: standard errors.

References

    1. Ahrens M. B., Orger M. B., Robson D. N., Li J. M., Keller P. J. (2013). Whole-brain functional imaging at cellular resolution using light-sheet microscopy. Nat. Methods 10, 413–420. 10.1038/nmeth.2434 - DOI - PubMed
    1. Arnold G. Weihs, D. (1977). The hydrodynamics of rheotaxis in the plaice (Pleuronectes Platessa L.). J. Exp. Biol. 75, 147–169.
    1. Arnold G. P. (1974). Rhoetropism in fishes. Biol. Rev. 49, 515–576. - PubMed
    1. Bak-Coleman J. Coombs, S. (2014). Sedentary behavior as a factor in determining lateral line contributions to rheotaxis. J. Exp. Biol. 217, 2338–2347. 10.1242/jeb.102574 - DOI - PubMed
    1. Baker C. Montgomery, J. (1999). The sensory basis of rheotaxis in the blind Mexican cave fish, Astyanax fasciatus. J. Comp. Physiol. A 184, 519–527.

LinkOut - more resources