. 2015 Jun 5;5(1):e1056442.
doi: 10.1080/2162402X.2015.1056442. eCollection 2016.

Hypoxia induces macrophage polarization and re-education toward an M2 phenotype in U87 and U251 glioblastoma models

Affiliations

Hypoxia induces macrophage polarization and re-education toward an M2 phenotype in U87 and U251 glioblastoma models

Marine M Leblond et al. Oncoimmunology. .

Abstract

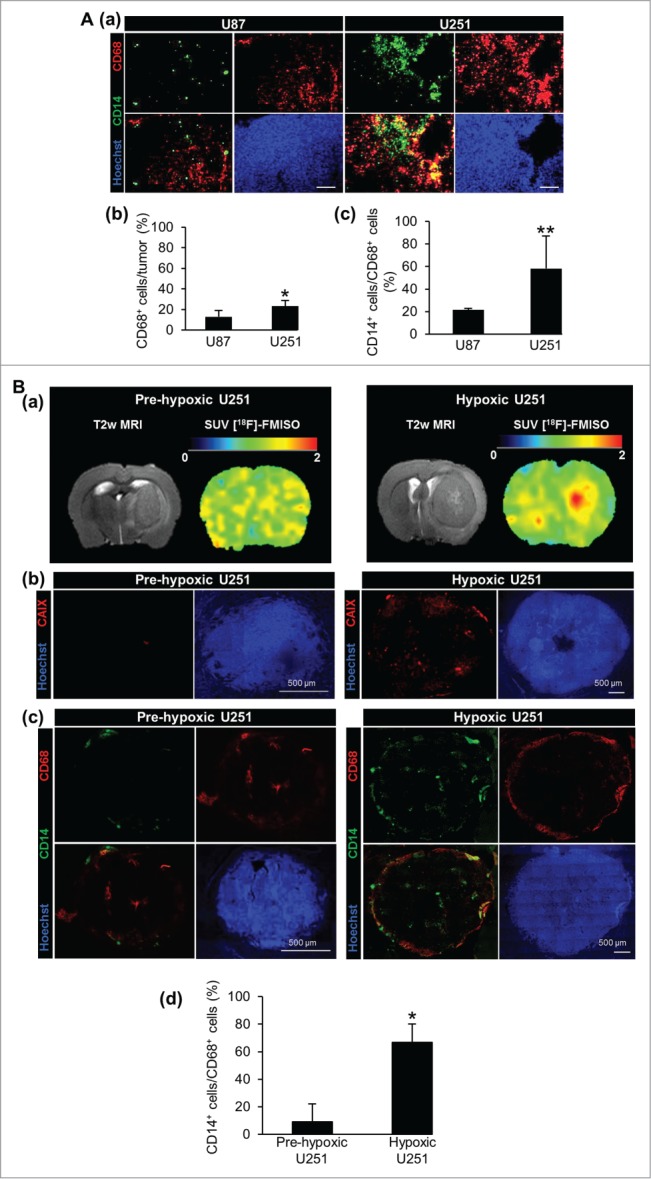
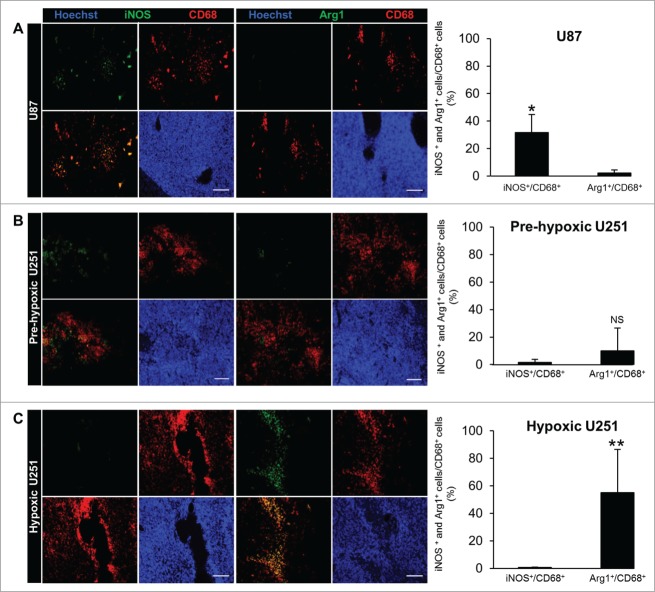
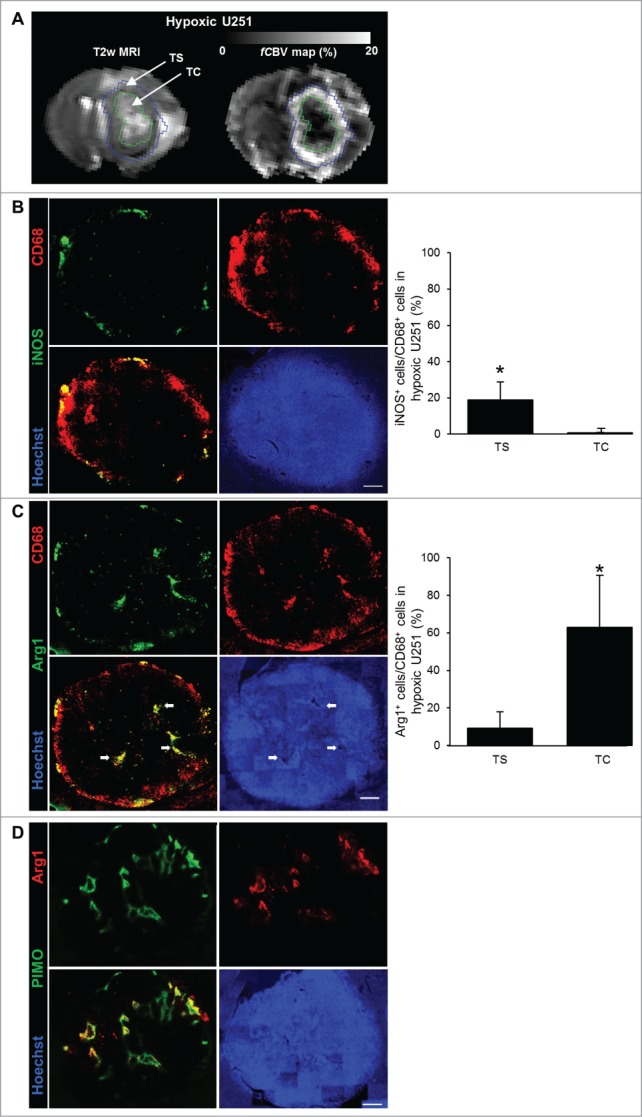
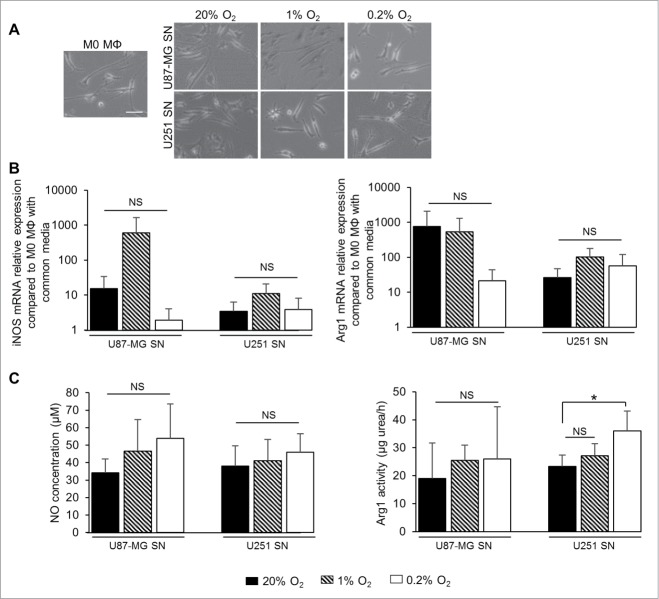
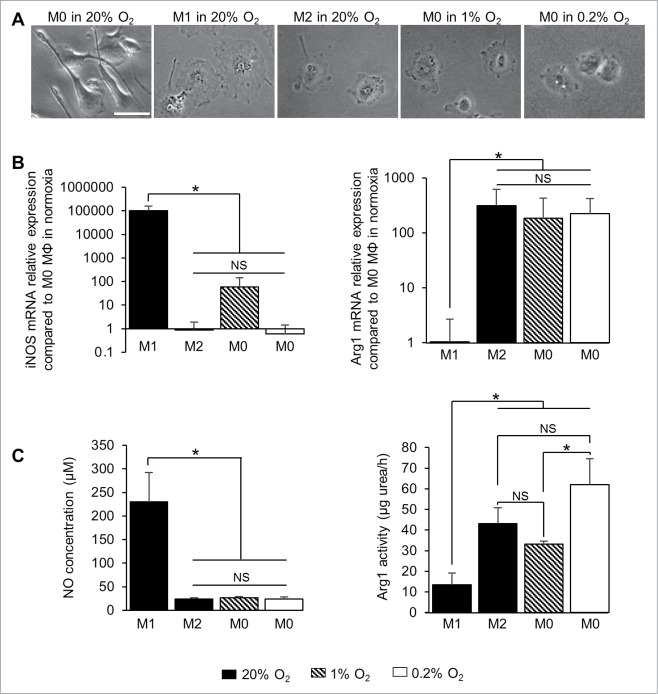
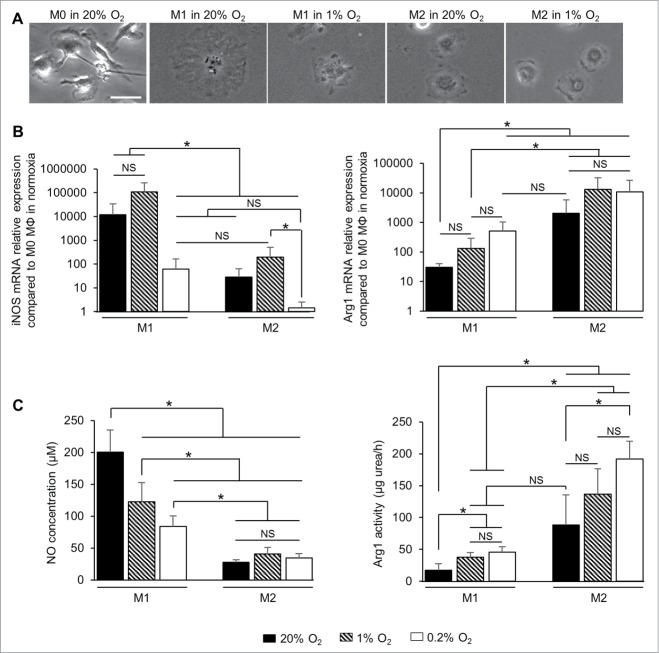
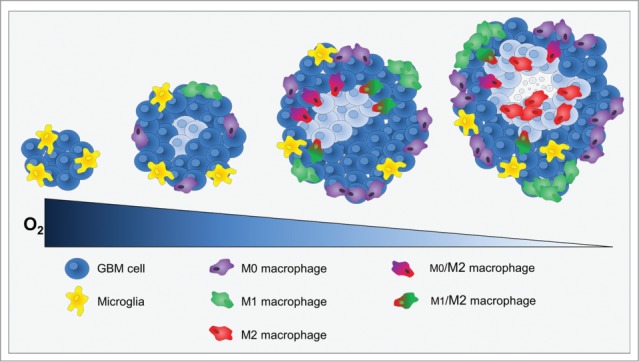
Hypoxia is a common feature of solid tumors, particularly in glioblastoma (GBM), and known to be a poor prognosis factor in GBM patients. The growth of GBM is also associated with a marked inflammation partially characterized by an accumulation of macrophage (MΦ) of the M2 phenotype. However, the transition between M1 MΦ (antitumoral) and M2 MΦ (protumoral) phenotypes is a dynamic process. We made the assumption that oxygen (O2) availability could be a major regulator of this transition and that the intratumoral O2 gradient is of importance. We evaluated, in vivo, the impact of hypoxia on MΦ tropism and polarization in two models of human GBM, well differentiated by their degree of hypoxia. MΦ migration in the tumor was more pronounced in the more hypoxic tumor of the two GBM models. In the more hypoxic of the models, we have shown that MΦ migrated at the tumor site only when hypoxia takes place. We also demonstrated that the acquisition of the M2 phenotype was clearly an evolving phenomenon with hypoxia as the major trigger for this transition. In support of these in vivo finding, M0 but also M1 MΦ cultured in moderate or severe hypoxia displayed a phenotype close to that of M2 MΦ whose phenotype was further reinforced by severe hypoxia. These results highlight the role of hypoxia in the aggressiveness of GBM, in part, by transforming MΦ such that a protumoral activity is expressed.

Keywords: M2 macrophages; brain tumor; hypoxia; polarization; re-education.


Figures

Figure 1.
Figure 1.
MΦ migration toward tumor models of human GBM. (A) CD68, CD14 and Hoechst 33342 immunofluorescence images (a) and their respective quantifications (b, c) in the U87 and U251 tumors. Scale bars: 100 µm. (B) T2w µMRI and [18F]-FMISO µPET images (a) and CAIX and Hoechst 33342 immunofluorescence images (b) of the U251 tumors at two different stages of tumor development. CD68, CD14 and Hoechst 33342 immunofluorescence images (c) and their respective quantifications (d) of pre-hypoxic and hypoxic U251 tumors. n = 3 animals per group and per time. Statistical significance was achieved when p < 0.05 (*) or p < 0.01 (**).
Figure 2.
Figure 2.
MΦ polarization in tumor models of human GBM. Representative Arg1, iNOS, CD68 and Hoechst 33342 immunofluorescence images and their respective quantifications in the U87 (A), pre-hypoxic (B) and hypoxic (C) U251 tumors. Scale bars: 100 µm. n = 3 animals per group and per time. Statistical significance was achieved when p < 0.05 (*) or p < 0.01 (**), otherwise it was not significant (NS).
Figure 3.
Figure 3.
M2 MΦ distribution in the hypoxic U251 tumor. (A) Representative region of interest of the TC and TS overlayed on T2w and fCBV maps. Representative iNOS (B), Arg1 (C), CD68 and Hoechst 33342 immunofluorescence images and their quantifications in the hypoxic U251 tumor. Arrows indicate pseudopalisaded areas in the tumor. (D) Representative co-localization of Arg1+ immunofluorescence with pimonidazole staining in the hypoxic U251 tumor. Scale bars: 500 µm. n = 3 animals. Statistical significance was achieved when p < 0.05 (*).
Figure 4.
Figure 4.
Effect of SN of hypoxia-exposed GBM cells on MΦ polarization. (A) Phase contrast microscopy of M0 MΦ cultured with common media or with SN withdrawn from U87-MG or U251 cells cultured either in normoxia (20% O2) or in 1% or 0.2% O2 for 24 h. Scale bar: 25 µm. iNOS and Arg1 mRNA relative expressions (compared to M0 MΦ cultured with common media) (B) and NO concentration (µM per 106 cells) and Arg1 activity (µg urea/h per 106 cells) (C) in M0 MΦ cultured with SN withdrawn from U87-MG or U251 cells cultured either in normoxia (20% O2) or in 1% or 0.2% O2 for 24 h. Data were represented as the mean ± SD, n = 3 per group. Statistical significance was achieved when p < 0.05 (*), otherwise it was not significant (NS).
Figure 5.
Figure 5.
Effect of hypoxia on MΦ polarization. (A) Phase contrast microscopy of M0, M1 and M2 MΦ cultured in normoxia (20% O2) and M0 MΦ in the presence of 1% or 0.2% O2 for 24 h. Scale bar: 20 µm. iNOS and Arg1 mRNA relative expressions (compared to M0 MΦ in normoxia) (B) and NO concentration (µM per 106 cells) and Arg1 activity (µg urea/h per 106 cells) (C) in M1 and M2 MΦ in normoxia (20% O2) and M0 MΦ in 1% or 0.2% O2 for 24 h. Data were represented as the mean ±SD, n = 3 per group and per time. Statistical significance was achieved when p < 0.05 (*), otherwise it was not significant (NS).
Figure 6.
Figure 6.
Effect of hypoxia on MΦ re-education. (A) Phase contrast microscopy of M0, M1 and M2 MΦ in normoxia (20% O2) or in 1% O2 for 24 h. Scale bar: 20 µm. iNOS and Arg1 mRNA relative expressions (compared to M0 MΦ in normoxia) (B) and NO concentration (µM per 106 cells) and Arg1 activity (µg urea/h per 106 cells) (C) in M1 and M2 MΦ in normoxia (20% O2) or in 1% or 0.2% O2 for 24 h; Data were represented as the mean ± SD, n = 3 per group and per time. Statistical significance was achieved when p < 0.05 (*), otherwise it was not significant (NS).
Figure 7.
Figure 7.
Cross-section through a theoretical GBM to indicate the position and identity of the sub-types of MΦ as a function of hypoxia development. At the onset of tumor development, only microglia was present. When hypoxia begin to take place, MΦ were attracted to the tumor site and present M0 and M1 phenotypes at the shell of the tumor. Then, M0 and M1 MΦ migrated toward hypoxic zones where they increased the M2 markers. Once arrived to hypoxic zones, MΦ were M2 cells and hypoxia fine-tunes this phenotype.

References

    1. Stupp R, Mason WP, van den Bent MJ, Weller M, Fisher B, Taphoorn MJB, Belanger K, Brandes A, Marosi C, Bogdahn U et al.. Radiotherapy plus concomitant and adjuvant temozolomide for glioblastoma. N Engl J Med 2005; 352:987-96; PMID:15758009; http://dx.doi.org/10.1056/NEJMoa043330 - DOI - PubMed
    1. Charles NA, Holland EC, Gilbertson R, Glass R, Kettenmann H. The brain tumor microenvironment. Glia 2011; 59:1169-80; PMID:21446047; http://dx.doi.org/10.1002/glia.21136 - DOI - PubMed
    1. Clavreul A, Etcheverry A, Chassevent A, Quillien V, Avril T, Jourdan M-L, Michalak S, François P, Carré J-L, Mosser J et al.. Isolation of a new cell population in the glioblastoma microenvironment. J Neurooncol 2012; 106:493-504; PMID:21928115; http://dx.doi.org/10.1007/s11060-011-0701-7 - DOI - PubMed
    1. Hirata K, Terasaka S, Shiga T, Hattori N, Magota K, Kobayashi H, Yamaguchi S, Houkin K, Tanaka S, Kuge Y et al.. 18F-Fluoromisonidazole positron emission tomography may differentiate glioblastoma multiforme from less malignant gliomas. Eur J Nucl Med Mol Imaging 2012; 39:760-70; PMID:22307533; http://dx.doi.org/10.1007/s00259-011-2037-0 - DOI - PubMed
    1. Rampling R, Cruickshank G, Lewis AD, Fitzsimmons SA, Workman P. Direct measurement of pO2 distribution and bioreductive enzymes in human malignant brain tumors. Int J Radiat Oncol Biol Phys 1994; 29:427-31; PMID:8005794; http://dx.doi.org/10.1016/0360-3016(94)90432-4 - DOI - PubMed

Publication types

LinkOut - more resources