. 2015 Oct 29;5(1):e1104448.
doi: 10.1080/2162402X.2015.1104448. eCollection 2016.

PD-1 expression conditions T cell avidity within an antigen-specific repertoire

Affiliations

PD-1 expression conditions T cell avidity within an antigen-specific repertoire

Sylvain Simon et al. Oncoimmunology. .

Abstract

Despite its negative regulatory role on tumor-specific T cells, Programmed cell death 1 (PD-1) is also a marker of activated tumor-infiltrating T cells. In cancer, PD-1 blockade partially reverses T cell dysfunction allowing the amplification of tumor reactive T cells. Here, we investigated the role of PD-1 signaling on effector/memory human T cells specific for shared melanoma antigens, derived from blood. We documented for the first time the existence of melanoma-specific T cell clones unable to express PD-1. This stable feature was due to the persistent methylation of the PDCD1 promoter. These PD-1neg clones were of lower avidity than their PD-1pos counterparts, suggesting that high-affinity-specific T cell clones unable to express PD-1 are not or rarely present in peripheral blood, as they are probably eliminated by negative selection, due to their high reactivity. We also documented the existence of such PD-1neg T cell clones in melanoma tumor-infiltrating lymphocytes (TIL), which also exhibited a lower functional avidity than PD-1pos TIL clones. This clearly shows that PD-1 expression identifies antigen-specific T cell clonotypes of high functional avidity. Finally, we demonstrated that PD-1 blockade during the in vitro selection process of Melan-A-specific T cells favored the amplification of higher avidity T cell clonotypes. This preferential amplification of high-avidity memory T cells upon PD-1 blockade resonates with the expansion of reactive T cells, including neo-antigen-specific T cells observed in anti-PD-1-treated patients. This feature should also be a useful biomarker of clinical efficiency, while providing new insights for adoptive transfer treatments.

Keywords: Adoptive T cell transfer; Melan-A; PD-1; T cell avidity; immunotherapy; melanoma.


Figures
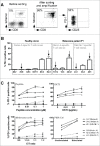
Figure 1.
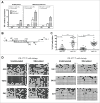
Figure 1.
PD-1 expression on melanoma-specific T cells clones. (A). Example of specificity and PD-1 expression on Melan-A-specific T cells. 107 PBMC from a melanoma patient were stimulated in 96-well plates (2 × 10⁵ cells/well) during 14 d with 1 μM of Melan-AA27Lpeptide. Melan-A-specific T cells (left panel) were sorted with Chim-AvT dynabeads coated with HLA-A2-peptide monomers and amplified on allogeneic irradiated feeders cells. After 16 d, the specificity (middle panel) and PD-1 expression (right panel) on resting T cells was assessed by a quadruple labeling using tetramer, anti-CD8, anti-CD25 and anti-PD-1 antibodies. (B). Stability of PD-1 expression profile on resting antigen-specific T cell clones. Melan-A and MELOE-1-specific T cell clones were derived from sorted T cell populations by limiting dilution. PD-1 expression on resting T cell clones was assessed by double labeling with anti-PD-1 and anti-CD25 antibodies (n = 7). Arrows indicate the T cell clones selected for further characterization. (C). PD-1 expression on specific T cell clones after activation. Specific T cell clones were activated either with a range of Melan-AA27L or MELOE-136-44-specific peptides, immobilized anti-CD3 Ab (OKT3), HLA-A2 melanoma cell lines or PMA-CaI, for 6 h at 37°C. Activation and PD-1 expression were assessed by anti-CD25 and anti-PD-1 double labeling (n = 3).
Figure 2.
Figure 2.
Transcriptional regulation of PD-1 expression on T cell clones. (A). PD-1 relative expression measured by RT-qPCR. PD-1 relative expression was measured on resting T cell clones (white bars) or after 6 h of activation with 1 μg/mL of OKT3 Ab (gray bars). PD-1 relative expression was normalized on the expression of two house-keeping genes (RPLPO and cyclophilin) and on PD-1 expression measured in resting HA1 T cell clone (n = 2). (B). Schematic representation of the PD-1 transcriptional regulatory region. Box represents the 460 bp region containing the 23 CpG analyzed, between −1206 and −769 positions. Arrows indicate the approximate location of the primers (external and nested primers) used for bisulfite sequencing analysis. (C). Global methylation of the regulatory region of PD-1 gene. Global percentages of methylation (mean ± SEM) of the 23 CpG of the PD-1 regulatory region were calculated on at least 33 sequences derived from PD-1pos (white circles) and PD-1neg (black circles) T cell clones, at rest and after 6 h of activation with OKT3 (1 μg/mL). Statistical analyses were performed using a non-parametric Mann–Whitney t test, to globally compare PD-1pos and PD-1neg T cell clones (***p < 0.001, two-tailed p value). (D). Individual bisulfite sequencing methylation analysis. Bisulfite sequencing of the PD-1 regulatory region was performed on PD-1neg and PD-1pos T cell clones. DNA treated by bisulfite conversion was amplified, cloned and sequenced. Each line represents an individual clone picked for sequencing. Filled circles represent methylated cytosines and open circles unmethylated ones.
Figure 3.
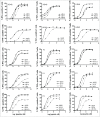
Figure 3.
Reactivity and affinity of PD-1pos and PD-1neg T cell clones. (A). Flow cytometric analysis of PD-L1 expression on M113 (left panel) and T2 (right panel) cell lines wild type and stably transfected with a PD-L1 coding expression vector. The filled histograms represent negative control staining while the over-laid empty histograms show staining with a PE-conjugated anti-PD-L1 Ab (clone MIH1, BD Biosciences). (B). Expression of HLA-A2 (clone BB7.2, BD Biosciences), Melan-A (clone A103, Dako, Denmark), ICAM-1 (CD54, clone HA58, BD Biosciences) and LFA-3 (CD58, clone 1C3, BD Biosciences) on M113 (upper panel) and M113-PD-L1pos (lower panel) cell lines. All the antibodies, unless A103 Ab were PE-conjugated. For Melan-A intracellular staining, cells were fixed, permeabilized, incubated with A103 Ab, and stained with PE-conjugated goat Fab’2 anti-mouse IgG secondary Ab (Beckman Coulter, France). (C). IFNγ production of PD-1neg and PD-1pos T cell clones in response to melanoma cell lines. IFNγ production was measured by ELISA (n = 2) in supernatants of PD-1neg (left column, dotted lines) and PD-1pos (right column, solid lines) T cell clones after 6 h of activation with M113 melanoma cell line (white circles) or M113-PD-L1pos melanoma cell line (black circles). (D). IFNγ production of PD-1neg and PD-1pos MELOE-1-specific T cell clones in response to T2 cells loaded with the MELOE-136-44 peptide. IFNγ production was measured by ELISA (n = 2) in supernatants of PD-1neg (left panel, dotted lines) and PD-1pos (right panel, solid lines) MELOE-1-specific T cell clones after a 6-h-activation period with peptide-loaded T2 cells (white circles) or peptide-loaded T2-PD-L1pos cells (black circles). (E). Avidities of PD-1neg and PD-1pos Melan-A and MELOE-1-specific T cell clones. T cell clones' avidities (PD-1neg, dotted lines and PD-1pos, solid lines) were evaluated by measuring IFNγ (left panel) and TNF-α production (right panel) in response to T2 cells loaded either with a range of Melan-AA27L peptide or MELOE-136-44 peptides, at an E:T ratio of 1:2. Cytokine production was evaluated by intracellular labeling with antibodies specific for IFNγ or TNF-α (gated on CD8+ T cells).
Figure 4.
Figure 4.
PD-1 expression and functional avidity of Melan-A-specific T cell clones derived from melanoma TIL. (A). CD25-PD-1 labeling of TIL clones, at rest and after OKT3 stimulation (1 μg/mL, 6 h at 37°C). (B) Functional avidities of PD-1neg (dotted lines) and PD-1pos TIL clones (solid lines) were evaluated by measuring CD107a membrane expression in response to T2 cells loaded with a range of Melan-AA27L peptide, at an E:T ratio of 1:2. CD107a membrane expression was evaluated by double staining with anti-CD8 and CD107a monoclonal antibodies.
Figure 5.
Figure 5.
Amplification rates and Melan-A-specific T cell diversity in presence of anti-PD-1 blocking antibody. (A). Absolute number of Melan-A-specific T cells after the step of PBMC-peptide stimulation. 107 PBMC from HLA-A2 healthy donors and melanoma patients were stimulated in 96-well plates (2 × 10⁵ cells/well) during 14 d with 1 μM of Melan-AA27Lpeptide, in presence of 10 μg/mL of anti-PD-1 Ab (hatched bars) or with 10 μg/mL of control IgG (white bars). At the end of the stimulation period, the absolute number of Melan-A-specific T cells was calculated from the total number of expanded T lymphocytes and the percentage of tetramer positive cells. (B). Analysis of the Vß repertoire of sorted and amplified Melan-A-specific T cells from stimulated PBMC. A panel of 24 anti-Vß antibodies was used. Empty histograms represent Melan-A-specific repertoire expanded in the control condition, and hatched histograms represent the repertoire amplified upon culture in the presence of anti-PD-1 Ab. Arrows indicate Vß subfamilies specifically amplified in one or the other of these two culture conditions, used for further analyses.
Figure 6.
Figure 6.
Functional avidities of the different Vß subfamilies specifically expanded in the two culture conditions. Avidities of specific Vß subfamilies amplified in the control condition (dotted lines) or in the presence of anti-PD-1 Ab (solid lines) were evaluated by measuring IFNγ (left panel), TNF-α production (middle panel) and CD107a membrane expression (right panel) in response to T2 cells loaded with a range of Melan-AA27L peptide, at an E:T ratio of 1:2. Cytokine production and CD107a membrane expression were evaluated by double staining with specific anti-Vß antibodies and intracellular or membrane labeling.

References

    1. Kamphorst AO, Ahmed R. Manipulating the PD-1 pathway to improve immunity. Curr Opin Immunol 2013; 25:381-8; PMID:23582509; http://dx.doi.org/10.1016/j.coi.2013.03.003 - DOI - PMC - PubMed
    1. Moll M, Kuylenstierna C, Gonzalez VD, Andersson SK, Bosnjak L, Sonnerborg A, Quigley MF, Sandberg JK. Severe functional impairment and elevated PD-1 expression in CD1d-restricted NKT cells retained during chronic HIV-1 infection. Eur J Immunol 2009; 39:902-11; PMID:19197939; http://dx.doi.org/10.1002/eji.200838780 - DOI - PMC - PubMed
    1. Riley JL. PD-1 signaling in primary T cells. Immunol Rev 2009; 229:114-25; PMID:19426218; http://dx.doi.org/10.1111/j.1600-065X.2009.00767.x - DOI - PMC - PubMed
    1. Nishimura H, Nose M, Hiai H, Minato N, Honjo T. Development of lupus-like autoimmune diseases by disruption of the PD-1 gene encoding an ITIM motif-carrying immunoreceptor. Immunity 1999; 11:141-51; PMID:10485649; http://dx.doi.org/10.1016/S1074-7613(00)80089-8 - DOI - PubMed
    1. Nishimura H, Okazaki T, Tanaka Y, Nakatani K, Hara M, Matsumori A, Sasayama S, Mizoguchi A, Hiai H, Minato N et al.. Autoimmune dilated cardiomyopathy in PD-1 receptor-deficient mice. Science 2001; 291:319-22; PMID:11209085; http://dx.doi.org/10.1126/science.291.5502.319 - DOI - PubMed

LinkOut - more resources