. 2016 Mar 3;18(3):368-81.
doi: 10.1016/j.stem.2016.02.001.

Expandable Cardiovascular Progenitor Cells Reprogrammed from Fibroblasts

Affiliations

Expandable Cardiovascular Progenitor Cells Reprogrammed from Fibroblasts

Yu Zhang et al. Cell Stem Cell. .

Abstract

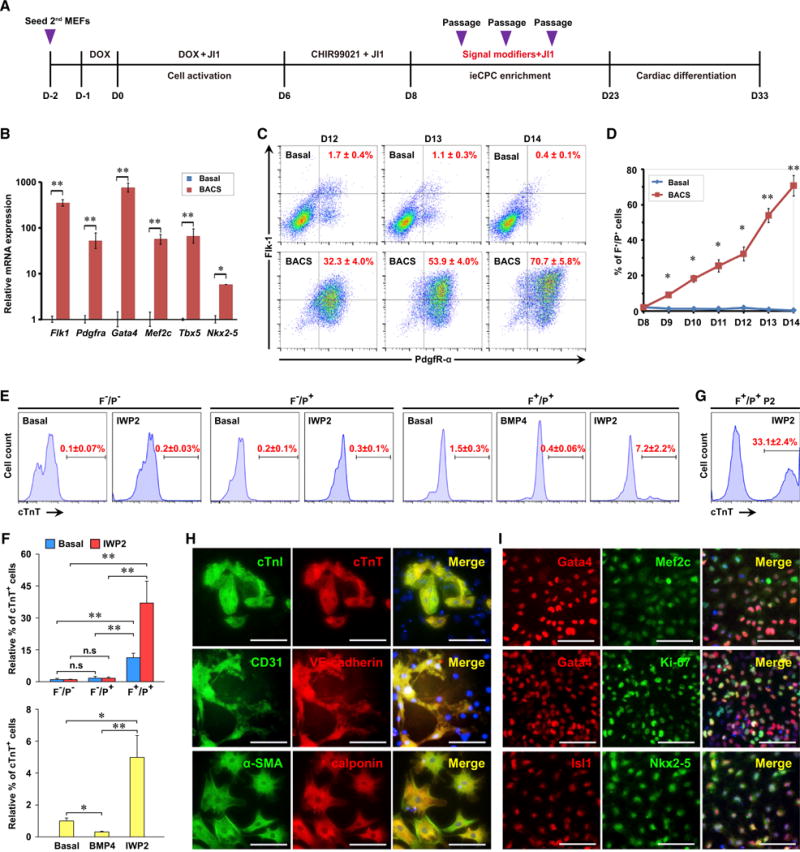
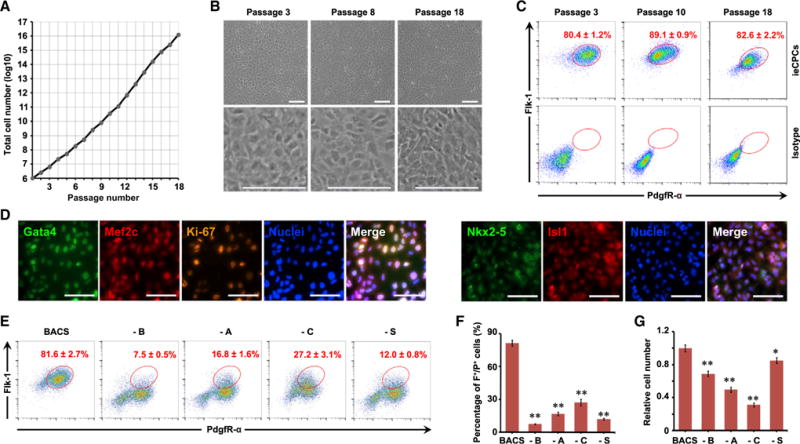
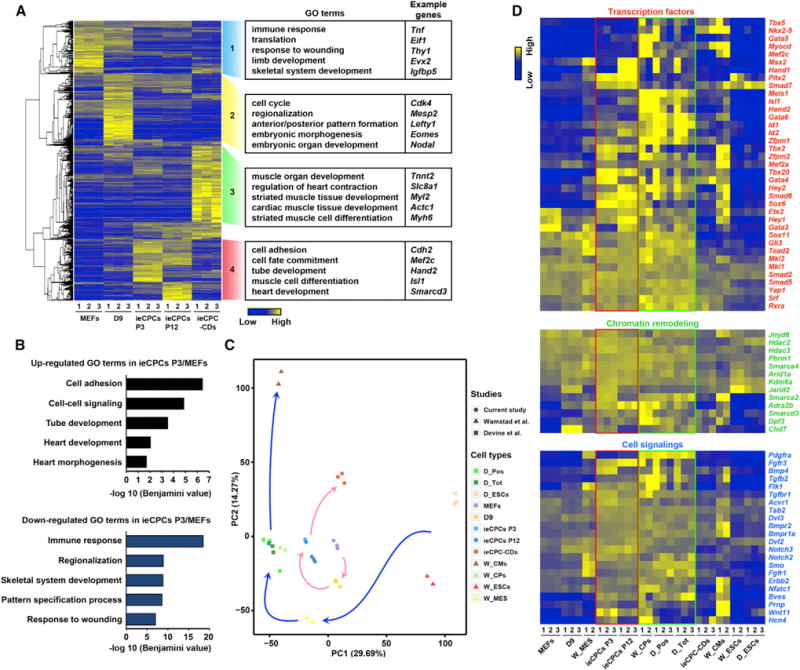
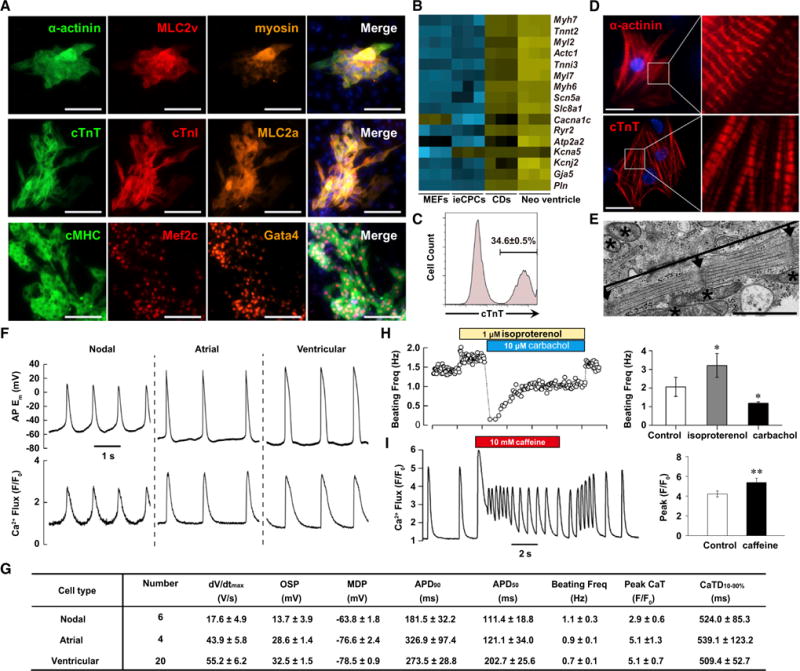
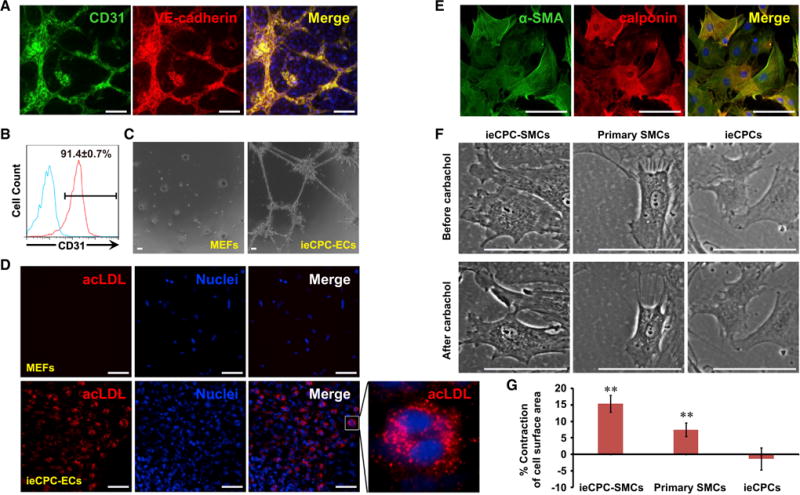
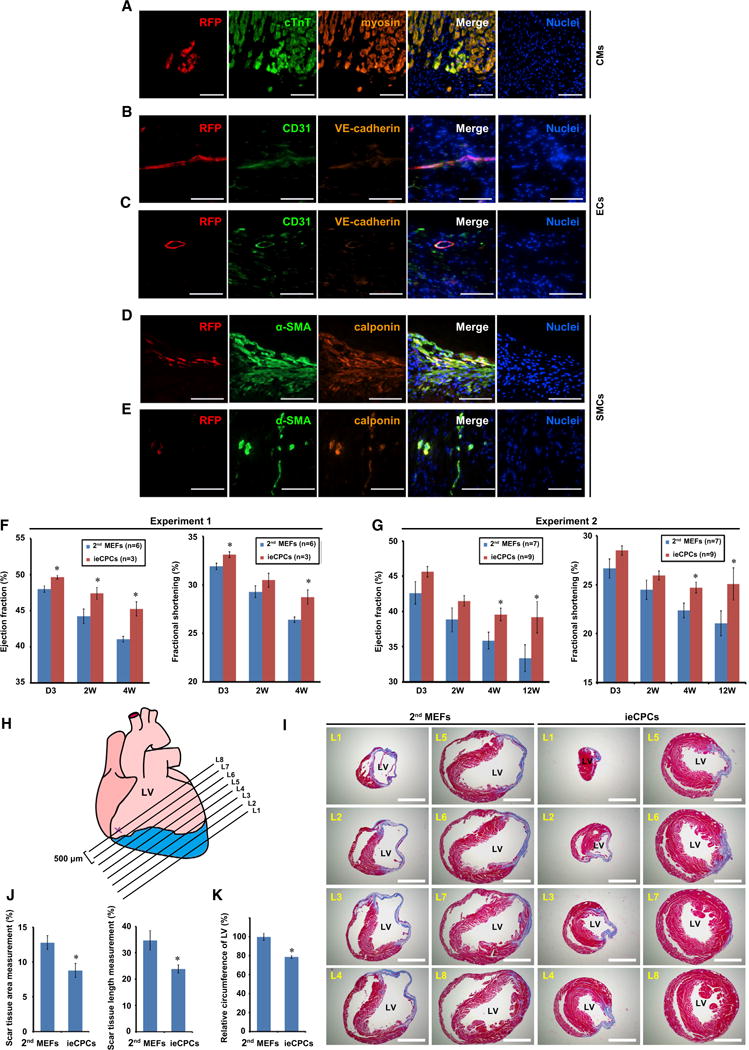
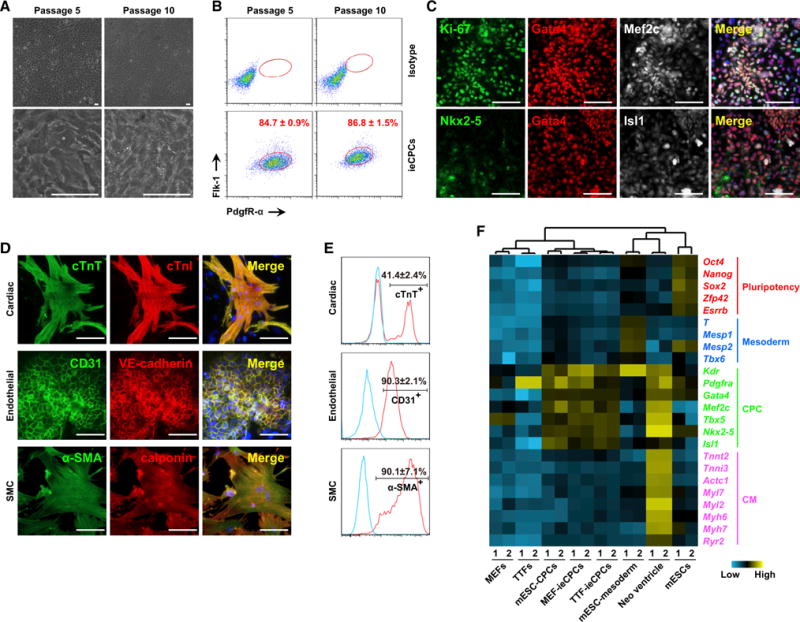
Stem cell-based approaches to cardiac regeneration are increasingly viable strategies for treating heart failure. Generating abundant and functional autologous cells for transplantation in such a setting, however, remains a significant challenge. Here, we isolated a cell population with extensive proliferation capacity and restricted cardiovascular differentiation potentials during cardiac transdifferentiation of mouse fibroblasts. These induced expandable cardiovascular progenitor cells (ieCPCs) proliferated extensively for more than 18 passages in chemically defined conditions, with 10(5) starting fibroblasts robustly producing 10(16) ieCPCs. ieCPCs expressed cardiac signature genes and readily differentiated into functional cardiomyocytes (CMs), endothelial cells (ECs), and smooth muscle cells (SMCs) in vitro, even after long-term expansion. When transplanted into mouse hearts following myocardial infarction, ieCPCs spontaneously differentiated into CMs, ECs, and SMCs and improved cardiac function for up to 12 weeks after transplantation. Thus, ieCPCs are a powerful system to study cardiovascular specification and provide strategies for regenerative medicine in the heart.


Figures

Figure 1
Figure 1. Generation and Characterization of ieCPCs
(A) Schematic of hypothesis-driven screening for conditions that expand putative ieCPCs. D, day; DOX, doxycycline; JI1, Jak inhibitor 1. (B) Expression of CPC markers on day 14 detected by qPCR. (C and D) Representative (C) and quantitative (D) flow cytometric analysis of the percentage of Flk-1+/PdgfR-α+ (F+/P+) cells treated with BACS. Basal ieCPC medium without BACS served as the control. (E and F) Representative (E) and quantitative (F) flow cytometric analysis of cTnT in cells differentiated from freshly isolated Flk-1/PdgfR-α (F/P), Flk-1/PdgfR-α+ (F/P+), and F+/P+ cells treated with either basal differentiation medium, BMP4, or IWP2. (G) Flow cytometric analysis of cTnT in cells differentiated from F+/P+ cells at passage 2 treated with IWP2. (H) Immunofluorescence analyses of CM markers cTnI and cTnT, EC markersCD31 and VE-cadherin, and SMC markers α-SMA and calponin in ieCPCs cultured in basal differentiation medium for 10 days. (I) Immunofluorescence analyses of Gata4, Mef2c, Isl1, Nkx2-5, Gata4, and Ki-67 in purified F+/P+ cells. Scale bars represent 100 μm. Data are mean ± SE, n ≥ 3. *p < 0.05; **p < 0.01; n.s, p > 0.05. See also Figures S1 and S2.
Figure 2
Figure 2. Isolated ieCPCs Expand Long Term in Chemically Defined Conditions
(A) Growth curves of ieCPCs during long-term expansion with BACS. (B) Representative images showing the typical morphology of ieCPCs at passages 3, 8, and 18. (C) Percentage of F+/P+ cells detected by flow cytometry at passages 3, 10, and 18. (D) Immunofluorescence analyses of Gata4, Mef2c, Ki-67, Nkx2-5, and Isl1 in ieCPCs at passage 15. (E–G) Representative (E) and quantitative (F) results of the percentage of F+/P+ cells detected by flow cytometry and cell number (G) after culturing with BACS or removing individual components. Data were collected after three passages (n = 3). –, omit; A, Activin A; B, BMP4; C, CHIR99021; S, SU5402. Scale bars represent 100 μm. Data are mean ± SE. *p < 0.05; **p < 0.01. See also Figure S3.
Figure 3
Figure 3. ieCPCs Acquire Transcriptional Signatures of Developing CPCs
(A) Transcriptome analysis revealing differences in gene expression among passage 3 (P3) and passage 12 (P12) ieCPCs, their parental MEFs, cells at reprogramming D9 (D9), and ieCPC cardiac derivatives (ieCPC-CDs) detected by RNA-seq. (B) GO analyses of upregulated and downregulated genes in ieCPCs P3/MEFs. (C) Principal-component (PC) analysis of the global gene expression profile across all tested cell types. CPs, cardiac progenitors; D_, Devine et al. (2014); MES, mesoderm; Pos and Tot, CPCs with or without purification with a Smarcd3-GFP+ reporter, respectively; W_, Wamstad et al. (2012). (D) Expression of CPC-related marker genes in all tested samples detected by RNA-seq. See also Figure S4.
Figure 4
Figure 4. ieCPCs Expanded Long Term Efficiently Differentiate into Functional CMs In Vitro
(A) Immunofluorescence analyses of multiple CM markers in ieCPC-CMs. Scale bars represent 100 μm. (B) Heatmap showing expression of key CM transcripts in MEFs, ieCPCs, ieCPC-CDs (CDs), and primary neonatal ventricle (Neo ventricle). (C) Flow cytometric analyses of ieCPC-CMs expressing cTnT after 10 days of differentiation from ieCPCs at late passages (P10–P15). (D) Immunofluorescence analyses of α-actinin and cTnT in ieCPC-CMs. Right panels show boxed areas in left panels at higher magnification. Scale bars represent 20 μm. (E) Transmission electron microscopy of ieCPC-CMs. Arrows, Z-bands; brackets between two arrows, sarcomeric units; asterisks, mitochondria. The scale bar represents 1 μm. (F) Representative traces of simultaneous APs (identified as changes in membrane potential [Em]) and Ca2+ transients (Fluo-4 fluorescence expressed relative to baseline [F/F0]) in ieCPC-CMs. (G) Tabulated parameters describing APs: maximum upstroke velocity (dV/dtmax); overshoot potential (OSP); minimum diastolic potential (MDP); APD50 and APD90; and Ca2+ transients: peak relative fluorescence (Peak CaT) and Ca2+-transient duration from 10% of the rising phase to 90% decay (CaTD10%–90%). (H) Typical effects of isoproterenol and carbachol on beating frequency in ieCPC-CMs (*p < 0.05, n = 6). (I) Caffeine-induced release of Ca2+ from sarcoplasmic reticulum in ieCPC-CMs (**p < 0.01, n = 10). Data are mean ± SE. See also Figure S5 and Movie S1.
Figure 5
Figure 5. ieCPCs Expanded Long Term Efficiently Differentiate into Functional ECs and SMCs In Vitro
(A) Immunofluorescence analyses of EC markers in ieCPC-ECs. (B) Flow cytometric analyses of CD31 expression after 10 days of EC differentiation from ieCPCs at late passages. Blue line indicates isotype control. (C and D) ieCPC-ECs, but not control 2nd MEFs, form a capillary-like network on a thin layer of Matrigel (C) and take up ac-LDL (D). (E) Immunofluorescence analyses of SMC markers in ieCPC-SMCs. (F) ieCPC-SMCs, but not control ieCPCs, display similar contractile ability as primary SMCs in response to 100 μM carbachol. (G) Quantitative results of cell surface area reflecting the contraction of each cell type in (F), summarized from 29 ieCPC-SMCs, 28 primary SMCs, and 28 ieCPCs. Data are means ± SE. **p < 0.01. Scale bars represent 100 μm. See also Figure S5.
Figure 6
Figure 6. ieCPCs Give Rise to CMs, ECs, and SMCs In Vivo and Improve Cardiac Function after MI
(A–E) Immunofluorescence analyses of RFP and CM (A), EC (B and C), and SMC (D and E) markers in tissue sections collected 2 weeks after transplanting RFP-labeled ieCPCs at passage 10 into infarcted hearts of immunodeficient mice. Scale bars represent 100 μm. (F and G) Ejection fraction and fractional shortening of the left ventricle (LV) quantified by echocardiography. Results from two independent experiments were shown. D, days; W, weeks. (H–J) Cardiac fibrosis was evaluated at eight levels (L1–L8) by Masson’s trichrome staining 12 weeks after coronary ligation. The ligation site is marked as X. Sections of representative hearts are shown in (I) with quantification in (J). Scar tissue (%) = (the sum of fibrotic area or length at L1–L8/the sum of LV area or circumference at L1-L8) × 100. Scale bars represent 500 μm. (K) Quantification of LV circumference of mouse hearts 12 weeks after transplantation of 2nd MEFs or ieCPCs. Data were summarized from 48 sections for each group. Data are mean ± SE. *p < 0.05. See also Figure S6.
Figure 7
Figure 7. BACS Captures and Expands CPCs Derived from mESCs
(A) Representative images showing the typical morphology of mESC-CPCs cultured in BACS at passages 5 and 10. (B) Percentage of F+/P+ cells detected by flow cytometry at passages 5 and 10. (C) Immunofluorescence analyses of Gata4, Mef2c, Ki-67, Nkx2-5, and Isl1 in mESC-CPCs at passage 10. (D) Immunofluorescence analyses of CM, EC, and SMC markers in mESC-CPCs cultured in CM-, EC-, and SMC-specific differentiation conditions for 10 days. (E) Flow cytometric analyses of cTnT, CD31, and α-SMA in mESC-CPCs cultured in the same differentiation conditions as in (D). Blue lines indicate isotype controls. (F) Hierarchical clustering analysis ofindicated celltypes on the basis ofexpression of pluripotent, mesodermal, CPC-, and CM-specific markers detected by qPCR. Scale bars represent 100 μm. See also Figure S7 and Movie S3.

Comment in

References

    1. Birket MJ, Ribeiro MC, Verkerk AO, Ward D, Leitoguinho AR, den Hartogh SC, Orlova VV, Devalla HD, Schwach V, Bellin M, et al. Expansion and patterning of cardiovascular progenitors derived from human pluripotent stem cells. Nat Biotechnol. 2015;33:970–979. - PubMed
    1. Blin G, Nury D, Stefanovic S, Neri T, Guillevic O, Brinon B, Bellamy V, Rücker-Martin C, Barbry P, Bel A, et al. A purified population of multipotent cardiovascular progenitors derived from primate pluripotent stem cells engrafts in postmyocardial infarcted nonhuman primates. J Clin Invest. 2010;120:1125–1139. - PMC - PubMed
    1. Bruneau BG. Signaling and transcriptional networks in heart development and regeneration. Cold Spring Harb Perspect Biol. 2013;5:a008292. - PMC - PubMed
    1. Burridge PW, Keller G, Gold JD, Wu JC. Production of de novo cardiomyocytes: human pluripotent stem cell differentiation and direct reprogramming. Cell Stem Cell. 2012;10:16–28. - PMC - PubMed
    1. Cao N, Liang H, Huang J, Wang J, Chen Y, Chen Z, Yang HT. Highly efficient induction and long-term maintenance of multipotent cardiovascular progenitors from human pluripotent stem cells under defined conditions. Cell Res. 2013;23:1119–1132. - PMC - PubMed

Publication types

MeSH terms