

T-Lymphocytes Traffic into the Brain across the Blood-CSF Barrier: Evidence Using a Reconstituted Choroid Plexus Epithelium
- PMID: 26942913
- PMCID: PMC4778949
- DOI: 10.1371/journal.pone.0150945
T-Lymphocytes Traffic into the Brain across the Blood-CSF Barrier: Evidence Using a Reconstituted Choroid Plexus Epithelium
Abstract
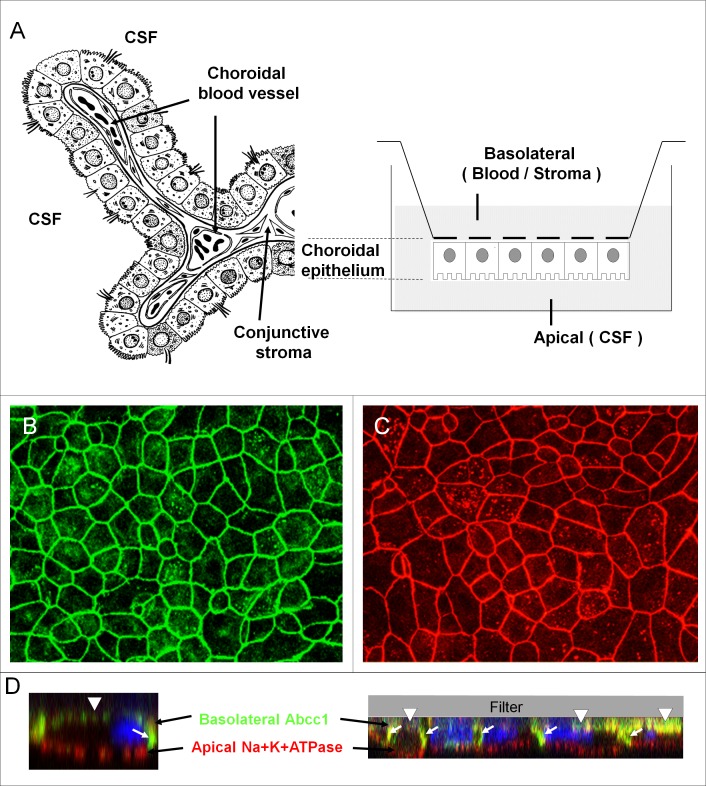
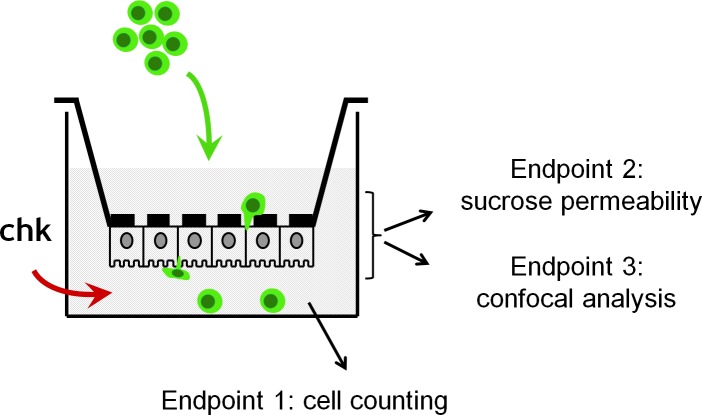
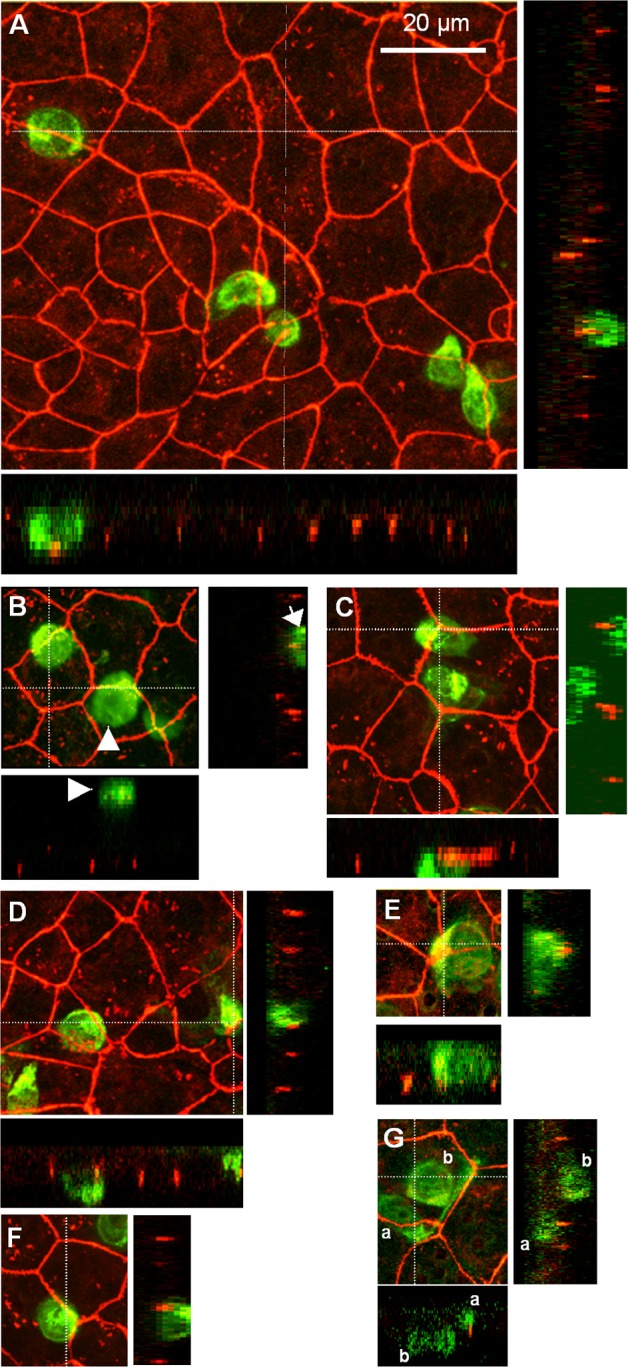
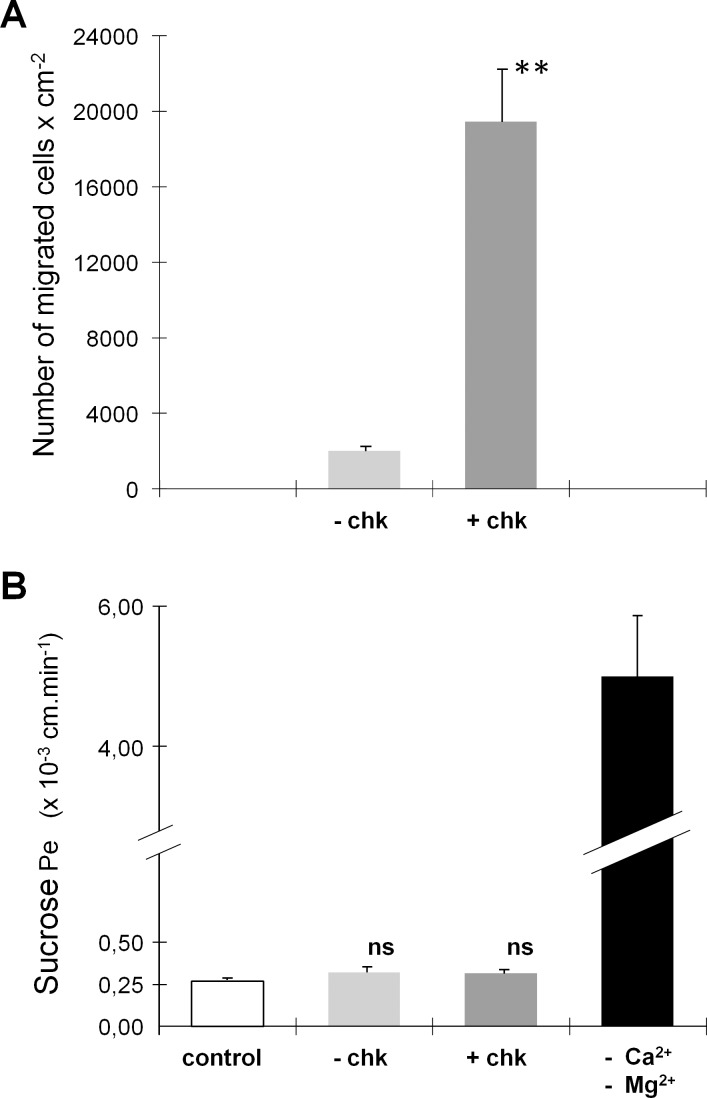
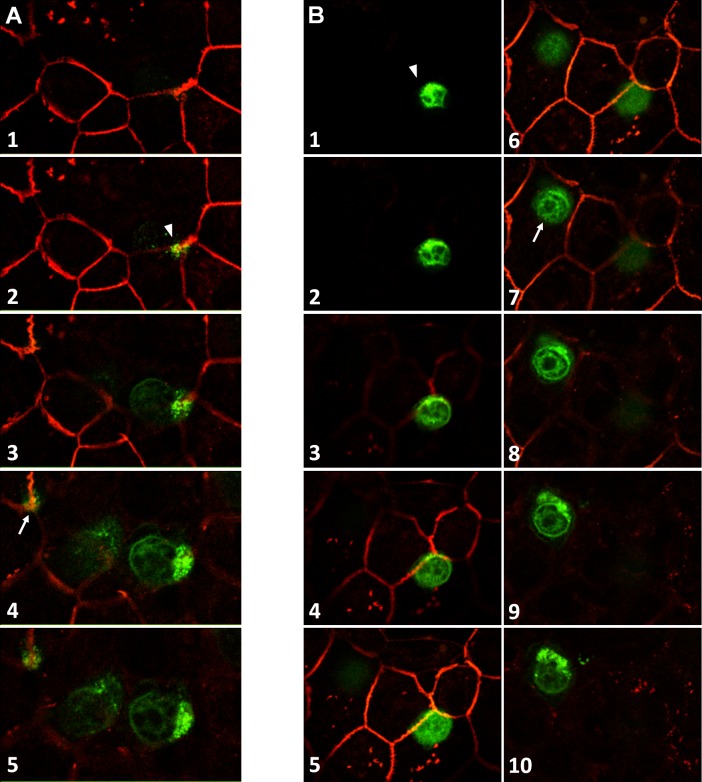
An emerging concept of normal brain immune surveillance proposes that recently and moderately activated central memory T lymphocytes enter the central nervous system (CNS) directly into the cerebrospinal fluid (CSF) via the choroid plexus. Within the CSF space, T cells inspect the CNS environment for cognate antigens. This gate of entry into the CNS could also prevail at the initial stage of neuroinflammatory processes. To actually demonstrate T cell migration across the choroidal epithelium forming the blood-CSF barrier, an in vitro model of the rat blood-CSF barrier was established in an "inverse" configuration that enables cell transmigration studies in the basolateral to apical, i.e. blood/stroma to CSF direction. Structural barrier features were evaluated by immunocytochemical analysis of tight junction proteins, functional barrier properties were assessed by measuring the monolayer permeability to sucrose and the active efflux transport of organic anions. The migratory behaviour of activated T cells across the choroidal epithelium was analysed in the presence and absence of chemokines. The migration pathway was examined by confocal microscopy. The inverse rat BCSFB model reproduces the continuous distribution of tight junction proteins at cell margins, the restricted paracellular permeability, and polarized active transport mechanisms, which all contribute to the barrier phenotype in vivo. Using this model, we present experimental evidence of T cell migration across the choroidal epithelium. Cell migration appears to occur via a paracellular route without disrupting the restrictive barrier properties of the epithelial interface. Apical chemokine addition strongly stimulates T cell migration across the choroidal epithelium. The present data provide evidence for the controlled migration of T cells across the blood-CSF barrier into brain. They further indicate that this recruitment route is sensitive to CSF-borne chemokines, extending the relevance of this migration pathway to neuroinflammatory and neuroinfectious disorders which are typified by elevated chemokine levels in CSF.
Conflict of interest statement
Figures
Similar articles
-
Impairment of blood-cerebrospinal fluid barrier properties by retrovirus-activated T lymphocytes: reduction in cerebrospinal fluid-to-blood efflux of prostaglandin E2.J Neurochem. 2005 Sep;94(6):1580-93. doi: 10.1111/j.1471-4159.2005.03309.x. Epub 2005 Jul 18. J Neurochem. 2005. PMID: 16026393
-
Modeling immune functions of the mouse blood-cerebrospinal fluid barrier in vitro: primary rather than immortalized mouse choroid plexus epithelial cells are suited to study immune cell migration across this brain barrier.Fluids Barriers CNS. 2016 Jan 29;13:2. doi: 10.1186/s12987-016-0027-0. Fluids Barriers CNS. 2016. PMID: 26833402 Free PMC article.
-
Immune surveillance of the human central nervous system (CNS): different migration pathways of immune cells through the blood-brain barrier and blood-cerebrospinal fluid barrier in healthy persons.Cytometry A. 2006 Mar;69(3):147-51. doi: 10.1002/cyto.a.20225. Cytometry A. 2006. PMID: 16479603 Review.
-
Human CD4+ T cell subsets differ in their abilities to cross endothelial and epithelial brain barriers in vitro.Fluids Barriers CNS. 2020 Feb 3;17(1):3. doi: 10.1186/s12987-019-0165-2. Fluids Barriers CNS. 2020. PMID: 32008573 Free PMC article.
-
Usefulness and limitation of primary cultured porcine choroid plexus epithelial cells as an in vitro model to study drug transport at the blood-CSF barrier.Adv Drug Deliv Rev. 2004 Oct 14;56(12):1859-73. doi: 10.1016/j.addr.2004.07.012. Adv Drug Deliv Rev. 2004. PMID: 15381337 Review.
Cited by
-
Integrins and the Metastasis-like Dissemination of Acute Lymphoblastic Leukemia to the Central Nervous System.Cancers (Basel). 2023 Apr 27;15(9):2504. doi: 10.3390/cancers15092504. Cancers (Basel). 2023. PMID: 37173970 Free PMC article. Review.
-
Effects of a Small-Molecule Perforin Inhibitor in a Mouse Model of CD8 T Cell-Mediated Neuroinflammation.Neurol Neuroimmunol Neuroinflamm. 2023 Apr 20;10(4):e200117. doi: 10.1212/NXI.0000000000200117. Print 2023 Jul. Neurol Neuroimmunol Neuroinflamm. 2023. PMID: 37080596 Free PMC article.
-
T cells establish and maintain CNS viral infection in HIV-infected humanized mice.J Clin Invest. 2018 Jul 2;128(7):2862-2876. doi: 10.1172/JCI98968. Epub 2018 Jun 4. J Clin Invest. 2018. PMID: 29863499 Free PMC article.
-
The Choroid Plexus Functions as a Niche for T-Cell Stimulation Within the Central Nervous System.Front Immunol. 2018 May 16;9:1066. doi: 10.3389/fimmu.2018.01066. eCollection 2018. Front Immunol. 2018. PMID: 29868025 Free PMC article.
-
CD45RA, CD8β, and IFNγ Are Potential Immune Biomarkers of Human Cognitive Function.Front Immunol. 2020 Nov 25;11:592656. doi: 10.3389/fimmu.2020.592656. eCollection 2020. Front Immunol. 2020. PMID: 33324408 Free PMC article.
References
-
- Ransohoff RM, Kivisakk P, Kidd G (2003) Three or more routes for leukocyte migration into the central nervous system. Nat Rev Immunol 3: 569–581. - PubMed
-
- Giunti D, Borsellino G, Benelli R, Marchese M, Capello E, Valle MT, et al. (2003) Phenotypic and functional analysis of T cells homing into the CSF of subjects with inflammatory diseases of the CNS. J Leukoc Biol 73: 584–590. - PubMed
-
- Provencio JJ, Kivisakk P, Tucky BH, Luciano MG, Ransohoff RM (2005) Comparison of ventricular and lumbar cerebrospinal fluid T cells in non-inflammatory neurological disorder (NIND) patients. J Neuroimmunol 163: 179–184. - PubMed
Publication types
MeSH terms
Substances
LinkOut - more resources
Full Text Sources
Other Literature Sources
Miscellaneous
