. 2016 Mar 4;11(3):e0149998.
doi: 10.1371/journal.pone.0149998. eCollection 2016.

Analysis of Lung Microbiota in Bronchoalveolar Lavage, Protected Brush and Sputum Samples from Subjects with Mild-To-Moderate Cystic Fibrosis Lung Disease

Affiliations

Analysis of Lung Microbiota in Bronchoalveolar Lavage, Protected Brush and Sputum Samples from Subjects with Mild-To-Moderate Cystic Fibrosis Lung Disease

Deborah A Hogan et al. PLoS One. .

Abstract

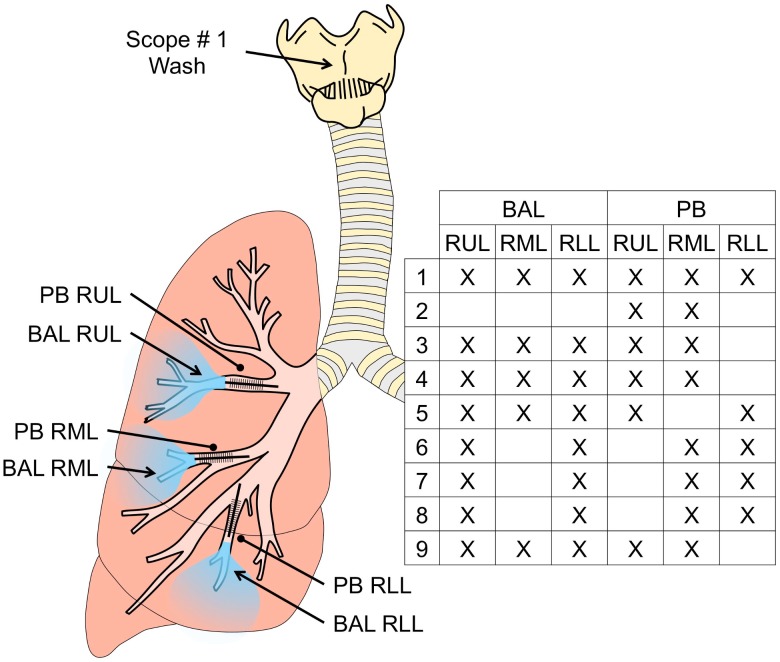
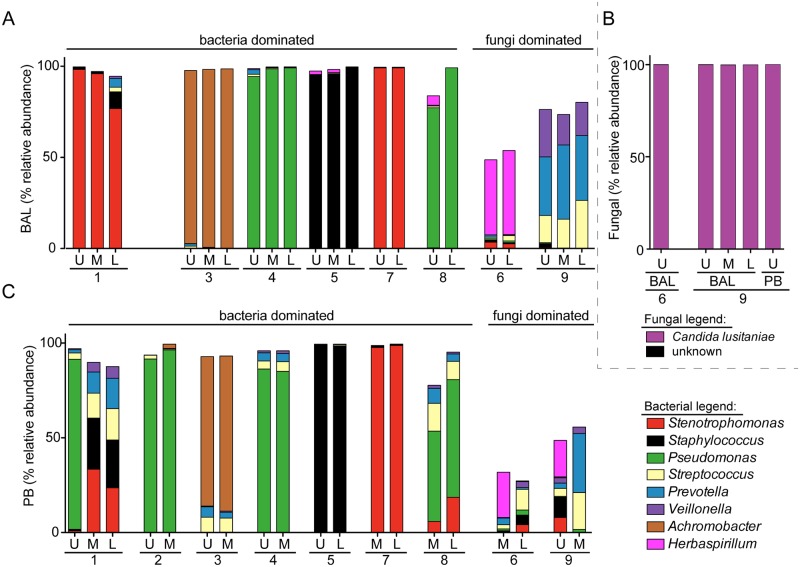
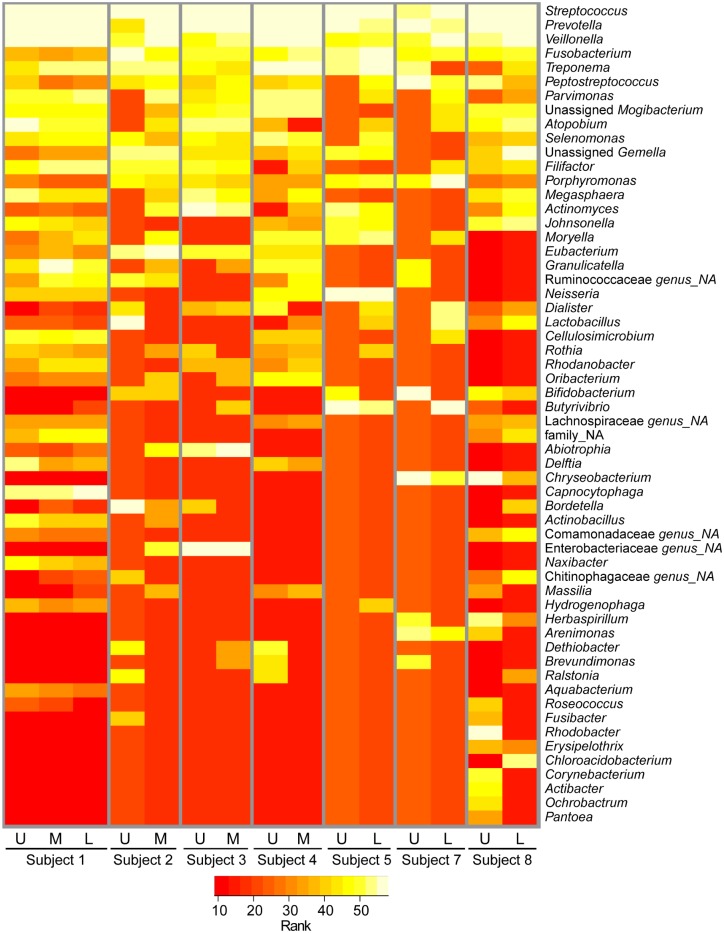
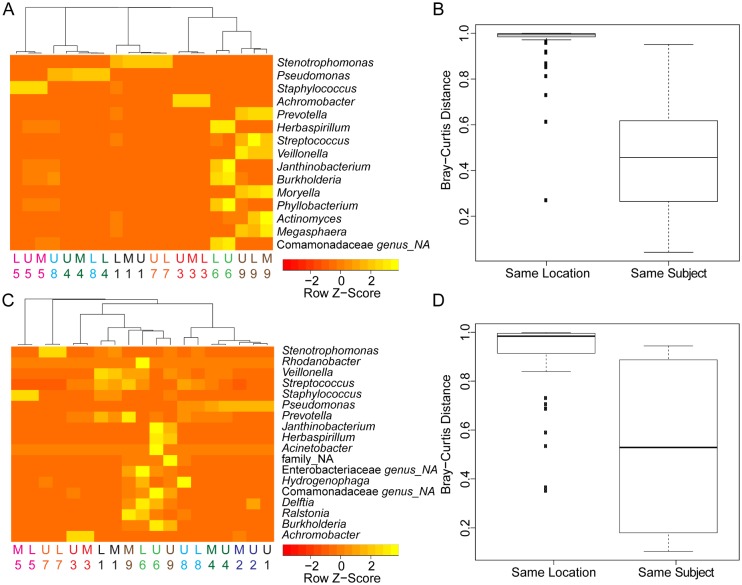
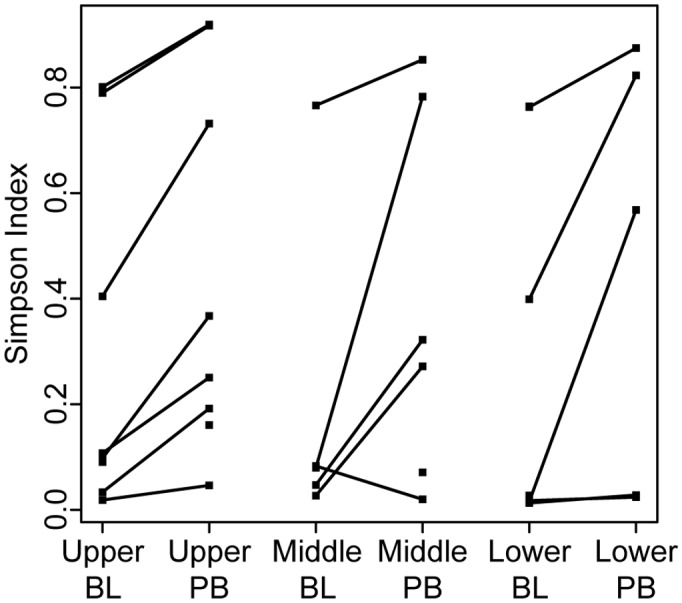
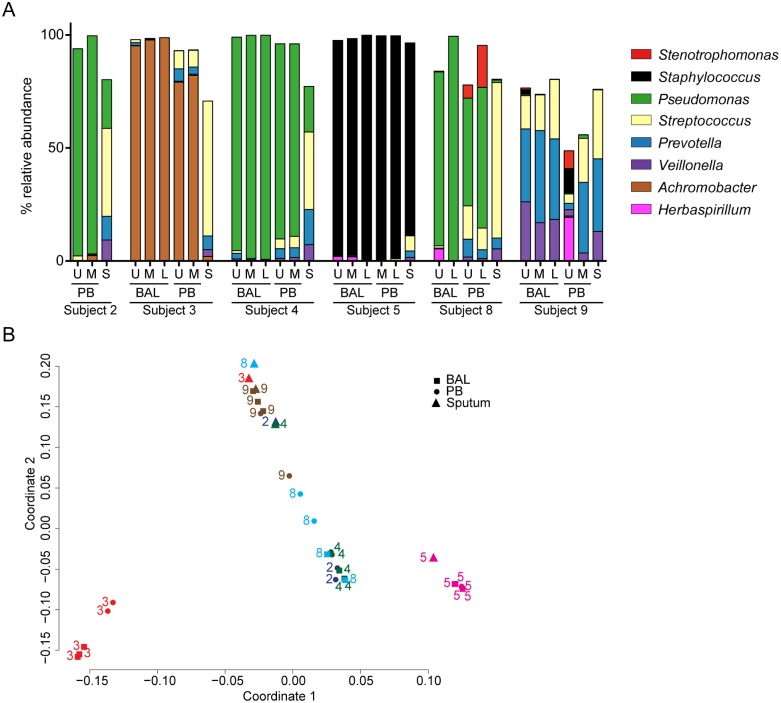
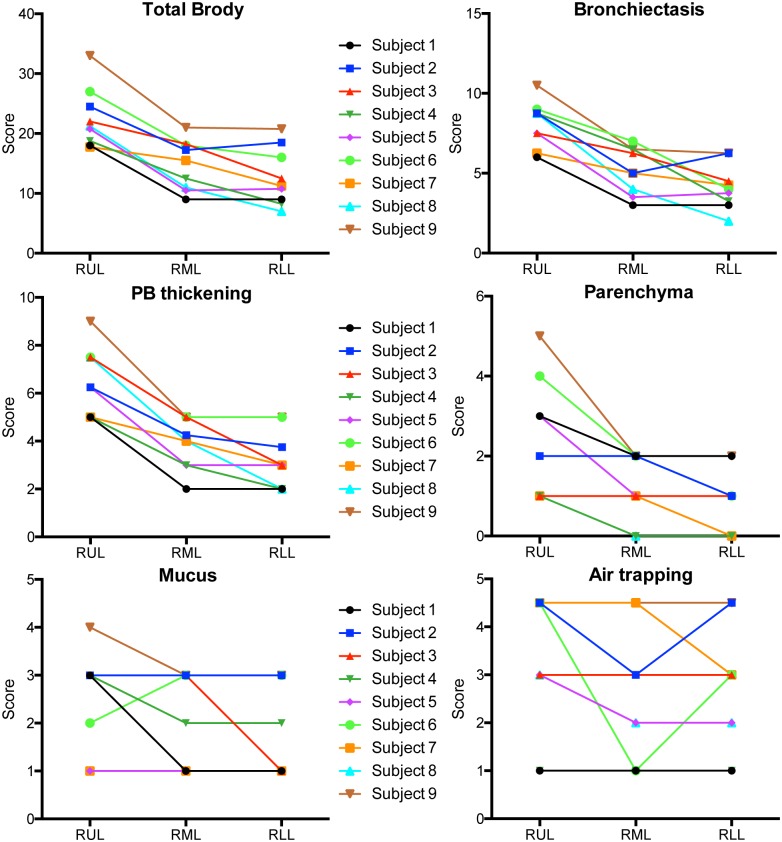
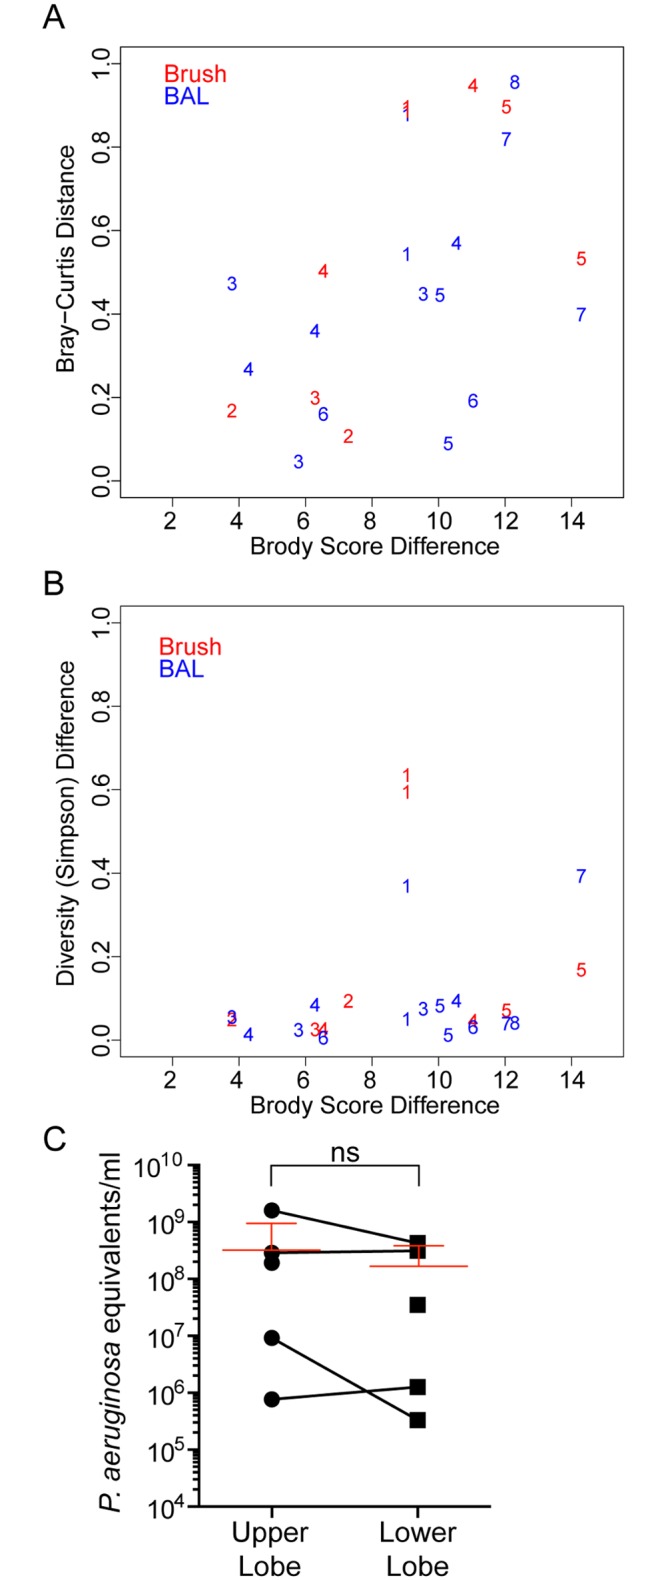
Individuals with cystic fibrosis (CF) often acquire chronic lung infections that lead to irreversible damage. We sought to examine regional variation in the microbial communities in the lungs of individuals with mild-to-moderate CF lung disease, to examine the relationship between the local microbiota and local damage, and to determine the relationships between microbiota in samples taken directly from the lung and the microbiota in spontaneously expectorated sputum. In this initial study, nine stable, adult CF patients with an FEV1>50% underwent regional sampling of different lobes of the right lung by bronchoalveolar lavage (BAL) and protected brush (PB) sampling of mucus plugs. Sputum samples were obtained from six of the nine subjects immediately prior to the procedure. Microbial community analysis was performed on DNA extracted from these samples and the extent of damage in each lobe was quantified from a recent CT scan. The extent of damage observed in regions of the right lung did not correlate with specific microbial genera, levels of community diversity or composition, or bacterial genome copies per ml of BAL fluid. In all subjects, BAL fluid from different regions of the lung contained similar microbial communities. In eight out of nine subjects, PB samples from different regions of the lung were also similar in microbial community composition, and were similar to microbial communities in BAL fluid from the same lobe. Microbial communities in PB samples were more diverse than those in BAL samples, suggesting enrichment of some taxa in mucus plugs. To our knowledge, this study is the first to examine the microbiota in different regions of the CF lung in clinically stable individuals with mild-to-moderate CF-related lung disease.


Conflict of interest statement

Competing Interests: The authors have declared that no competing interests exist.

Figures

Fig 1
Fig 1. Regional sampling of the cystic fibrosis lung.
PB samples were obtained from two or three tertiary bronchi of the right lung followed by sequential BAL sampling of the right upper lobe (RUL), right middle lobe (RML), and/or the right lower lobe (RLL). Specific sampling sites for each subject are shown within the Fig. For two subjects, a scope wash was also obtained prior to the lavage using a separate bronchoscope that was advanced to the glottis, removed, then washed through the suction channel to recover microbes for analysis.
Fig 2
Fig 2. Analysis of the relative abundance of bacteria and fungi in BAL and PB samples from different lobes of the right lung.
A. Relative abundance of bacterial genera in BAL samples from the upper (U), middle (M) and lower (L) lobes of the right lung in all subjects except for subject 2. Clinical microbiology reports found bacterial pathogens in the RUL BAL in subjects 1, 2, 3, 4, 5, 7 and 8 (listed in Table 1), and these are considered to be “bacteria dominated”. Clinical microbiology analysis of all subjects found predominantly Candida lusitaniae in the BAL fluid of subjects 6 and 9 and few if any bacteria, and these are therefore considered to be “fungi dominated”. The legend indicating the colors used to indicate the different genera in panels A and C is shown on the lower right. The taxa that made up 85% of all reads across all BAL and PB samples from “bacteria dominated” subjects are shown (data in S2 Table). B. Relative abundance of the fungal taxa in a subset of samples from subjects 6 and 9. Candida lusitaniae accounted for >99% of reads in these samples. C. Relative abundance of bacterial genera in PB samples from the upper (U), middle (M) and lower (L) lobes of the right lung.
Fig 3
Fig 3. Rank abundance analysis of the less abundant taxa in PB samples.
In this analysis, the known CF associated pathogens Stenotrophomonas, Staphylococcus, Pseudomonas, Haemophilus and Achromobacter were removed from the PB sample data to allow for a focus on the minor taxa (as described in the Methods). Rank abundance of the remaining taxa in those samples from the upper (U), middle (M) and lower (L) lobes of the right lungs of different subjects is shown. More abundant taxa are in yellow and less abundant taxa are in red as shown in the legend. Not all taxa are present in all samples and ranking all taxa across all samples resulted in the assignment of a rank within a sample even if a taxon is not present. This could lead to a visual effect, which suggest that some taxa are more abundant in a sample compared to others, even if they were undetected. For detailed information see S2 Table.
Fig 4
Fig 4. Analysis of relationships between the microbiota and location within the right lung.
A. Cluster analysis of the relative abundance of BAL-associated taxa that accounted for more than 5% in any one sample. The numbers and colors indicate the subject. Genus was assigned in VAMPS except for taxa in the family Comamonadaceae for which a single genus could not be assigned (NA). B. Bray-Curtis distance analysis of BAL samples from the same location in different subjects (Same location), and samples from the different locations in the same subject (Same Subject) demonstrated that samples from the same subject are less different than samples from the same lobe in different subjects (*** P < 0.001, Wilcoxon Rank Sum Test). A Bray-Curtis Distance of 1 indicates essentially no relatedness, and a value of 0 indicates completely related. C. Cluster analysis of the relative abundance of PB-associated taxa that accounted for more than 5% in any one sample. The numbers and colors represent subject number. Taxonomic assignments were made using VAMPS. “NA” indicates that the indicated taxonomic level was not assigned. D. Bray-Curtis distance analysis found that PB samples from the same location in different subjects (Same Location) were more distant than samples from the different locations in the same subject (Same Subject) (*** P < 0.001, Wilcoxon Rank Sum Test). In B and D, the center line is the median, the box is interquartile range, and the whisker is 1.5 times the interquartile range from the median.
Fig 5
Fig 5. Bacterial Simpson Diversity Index for BAL- and PB-associated microbiota in the different lobes of the right lung.
The diversity, as measured by Simpson Diversity Index, was calculated for each sample. When both a BAL (labeled BL) and PB sample was available from the lobe of a subject, their diversity values are connected with a line. The data used in this analysis are in S2 Table.
Fig 6
Fig 6. Comparison of sputum microbiota to regional PB and BAL fluid microbiota in samples from the same subject.
A. Relative bacterial genus abundance in BAL and PB in the upper (U), middle (M) and lower (L) lobes of the right lung and in sputum. Data from the six subjects capable of providing a spontaneously expectorated sputum sample within 2 h of the bronchoscopy procedure are shown. B. Using the complete taxonomic data from the six subjects that provided a spontaneously expectorated sputum sample, a principal component analysis (PCA) was performed (see Methods for details). The numbers and colors indicate the subjects and the squares indicate BAL samples, the circles are from PB samples and the triangles show the sputum samples.
Fig 7
Fig 7. Scores of the single components for the Brody score to assess lung damage.
The total Brody score is a composite of the evaluation of changes in bronchiectasis, peribronchial wall thickening (PB thickening), mucus plugging (Mucus), air trapping and parenchymal involvement (Parenchyma) in the lung of CF subjects.
Fig 8
Fig 8. Relationship between lung damage and microbiota.
A. Brody scores, a measure of lung damage, were calculated by a thoracic radiologist from a recent CT scan (data in S1 Table and Fig 7). The difference in Brody score between different lobes within a subject was calculated versus the difference in microbiota, determined as Bray-Curtis distance, is plotted for both BAL (red) or PB (blue) samples. The numbers indicate the data points from each of the subjects. B. A similar analysis as that shown in A, except that the Brody score difference between lobes within a subject is plotted against the difference in microbiota diversity, measured as the difference in Simpsons Diversity Index, in BAL or PB samples in the lobes being compared. C. Quantification of the amount of bacterial DNA in BAL fluid from the right upper lobe and right lower lobe. The red lines indicate the mean of all samples including error bars.

References

    1. de Jong PA, Lindblad A, Rubin L, Hop WC, de Jongste JC, Brink M, et al. (2006) Progression of lung disease on computed tomography and pulmonary function tests in children and adults with cystic fibrosis. Thorax 61: 80–85. - PMC - PubMed
    1. Li Z, Sanders DB, Rock MJ, Kosorok MR, Collins J, Green CG, et al. (2012) Regional differences in the evolution of lung disease in children with cystic fibrosis. Pediatr Pulmonol 47: 635–640. 10.1002/ppul.21604 - DOI - PMC - PubMed
    1. Simanovsky N, Cohen-Cymberknoh M, Shoseyov D, Gileles-Hillel A, Wilschanski M, Kerem E, et al. (2013) Differences in the pattern of structural abnormalities on CT in patients with cystic fibrosis and pancreatic sufficiency or insufficiency. Chest. - PubMed
    1. Regamey N, Jeffery PK, Alton EW, Bush A, Davies JC (2011) Airway remodelling and its relationship to inflammation in cystic fibrosis. Thorax 66: 624–629. 10.1136/thx.2009.134106 - DOI - PubMed
    1. Meyer KC, Sharma A (1997) Regional variability of lung inflammation in cystic fibrosis. Am J Respir Crit Care Med 156: 1536–1540. - PubMed

Publication types