. 2016 Apr 19;7(16):21786-98.
doi: 10.18632/oncotarget.7846.

Pin1 is required for sustained B cell proliferation upon oncogenic activation of Myc

Affiliations

Pin1 is required for sustained B cell proliferation upon oncogenic activation of Myc

Luana D'Artista et al. Oncotarget. .

Abstract

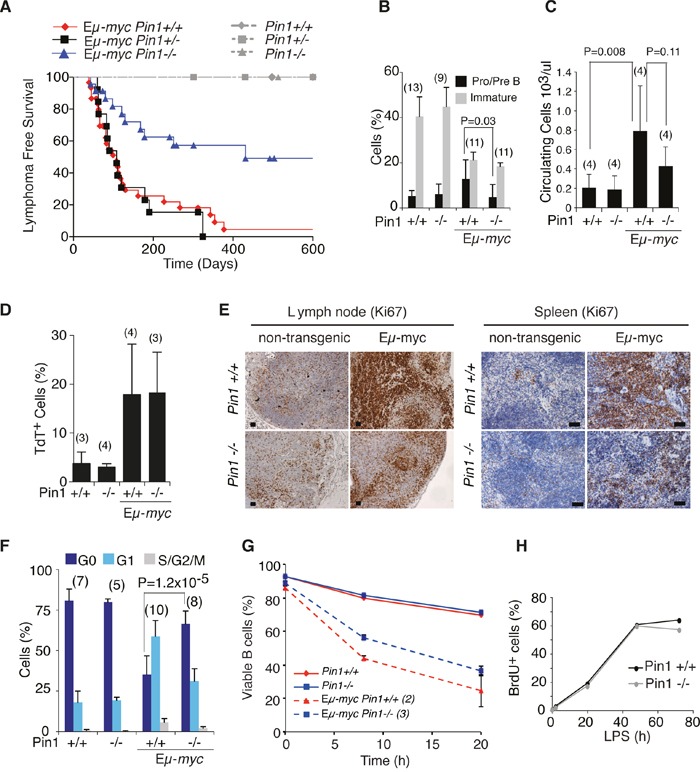
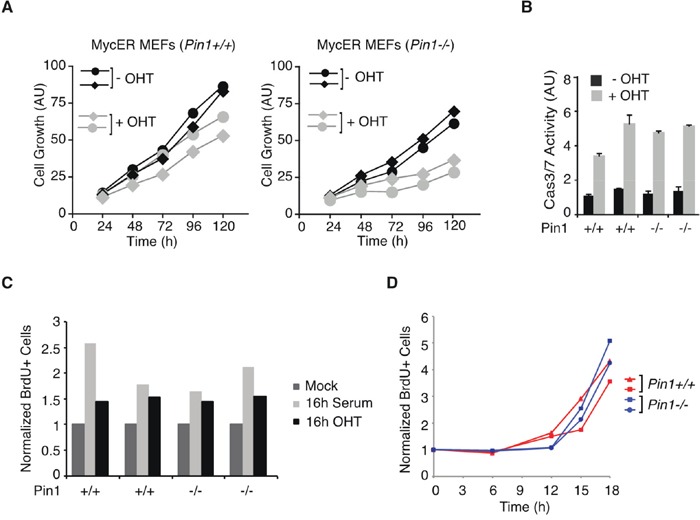
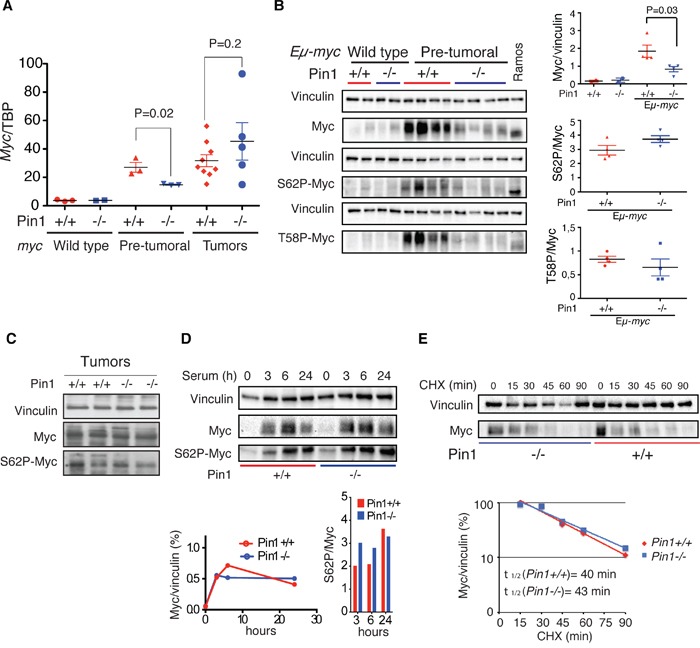
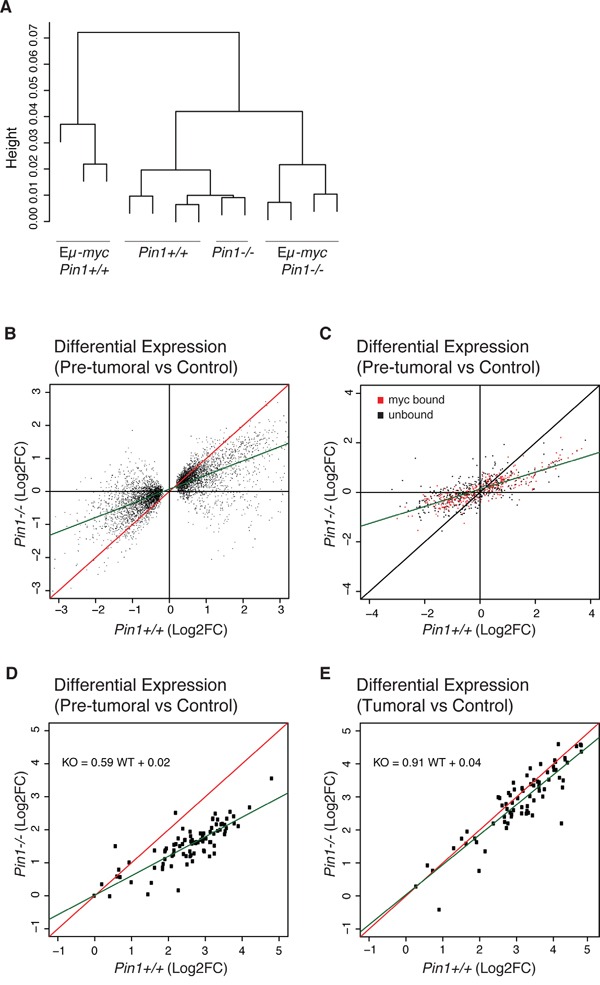
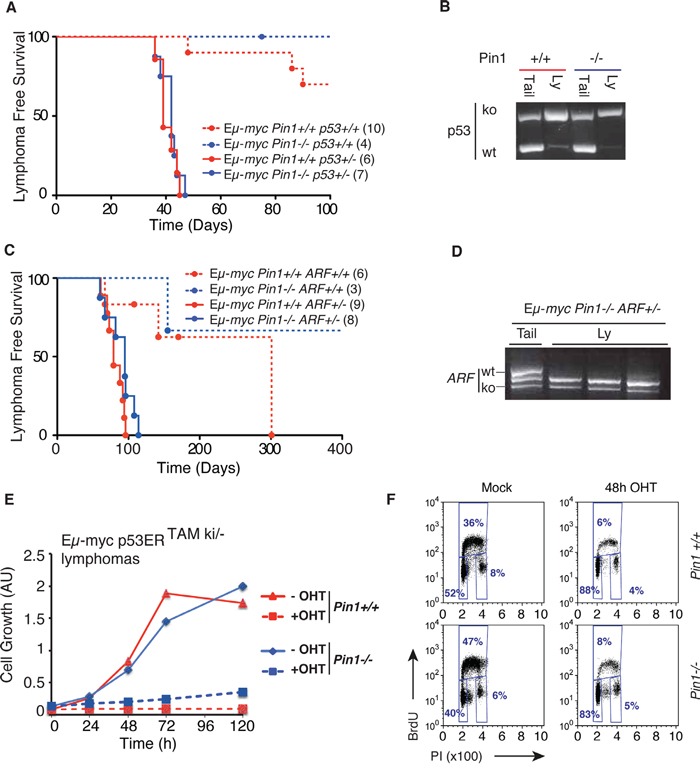
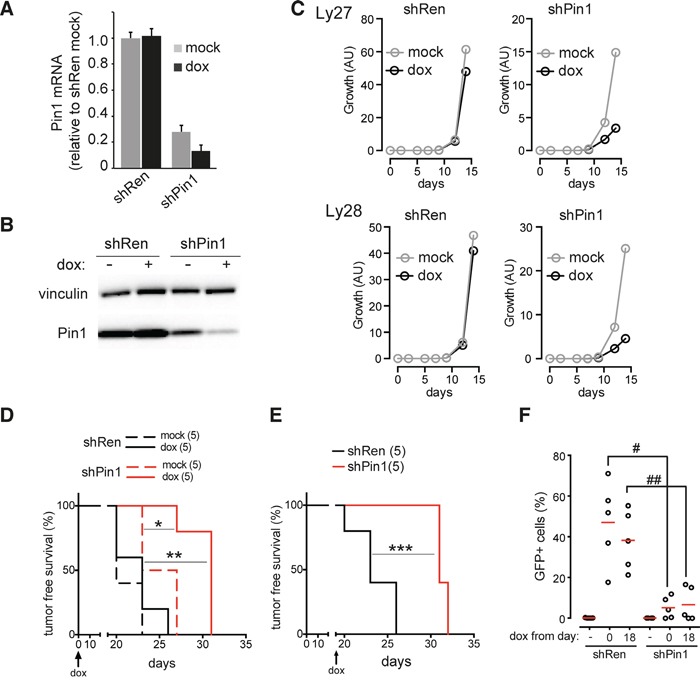
The c-myc proto-oncogene is activated by translocation in Burkitt's lymphoma and substitutions in codon 58 stabilize the Myc protein or augment its oncogenic potential. In wild-type Myc, phosphorylation of Ser 62 and Thr 58 provides a landing pad for the peptidyl prolyl-isomerase Pin1, which in turn promotes Ser 62 dephosphorylation and Myc degradation. However, the role of Pin1 in Myc-induced lymphomagenesis remains unknown. We show here that genetic ablation of Pin1 reduces lymphomagenesis in Eμ-myc transgenic mice. In both Pin1-deficient B-cells and MEFs, the proliferative response to oncogenic Myc was selectively impaired, with no alterations in Myc-induced apoptosis or mitogen-induced cell cycle entry. This proliferative defect wasn't attributable to alterations in either Ser 62 phosphorylation or Myc-regulated transcription, but instead relied on the activity of the ARF-p53 pathway. Pin1 silencing in lymphomas retarded disease progression in mice, making Pin1 an attractive therapeutic target in Myc-driven tumors.

Keywords: Pin1; c-myc; lymphoma; proliferation.


Conflict of interest statement

The Authors declare no competing financial interests.

Figures

Figure 1
Figure 1. Lymphomagenesis and pre-tumoral analysis of Eμ-myc Pin1−/− mice
A. Lymphoma-free survival in cohorts of Eμ-myc or control mice of the indicated Pin1 genotypes. The Median survival was 108 days for Eμ-myc Pin1+/+ (N=30), 431 days for Eμ-myc Pin1−/− (N=23), and 108 days for Eμ-myc Pin1+/− (N=13). P-values were calculated with the log-rank (Mantel-Cox) test: P = 0.001 for Eμ-myc Pin1−/− vs. Eμ-myc Pin1+/+; P = 0.002 for Eμ-myc Pin1 −/− vs. Eμ-myc Pin1+/−; P = 0.7287 for Eμ-myc Pin1+/+ vs. Eμ-myc Pin1+/−. No lymphomas arose in non-transgenic mice, regardless of their Pin1 genotype. In B-F, six weeks old Eμ-myc pre-tumoral mice and age matched non-transgenic mice were analyzed. B. Flow cytometric analysis of circulating B cell populations. Pro/Pre B lymphocytes are defined as B220+IgM, Immature B lymphocytes as B220+IgM+ cells. C. Numbers of circulating lymphocytes in the peripheral blood of mice of the indicated genotypes, determined with a Hematological analyzer (Beckman Coulter). D. Percentage of apoptotic cells among splenic B220+ lymphocytes of the indicated genotypes, as assessed by Tunel assay. E. Sections of the indicated genotypes were stained with the proliferation marker Ki67. 3-4 mice of each genotype were analyzed. Representative sections are shown. Scale bars: 100 μm. F. Cell cycle distribution of circulating B cells, analyzed as described in Supplementary Figure 1E. G. Viability of splenic B cells purified from healthy Eμ-myc or non-transgenic mice, cultured in the absence of cytokines. After 8 and 20 hours, cells were stained with Propidium Iodide (PI) to exclude dead cells. The percentage of viable PI negative cells, measured by flow cytometry is reported. H. Cell cycle entry and proliferation of purified B cells cultured in vitro in the presence of LPS, as assessed by continuous labeling with BrdU. In B-D, F, average values and standard deviations are reported, based on the numbers of samples indicated in above the bars. P-values were calculated using Student's t-test.
Figure 2
Figure 2. Pin1 is required for Myc driven proliferation in MEFs
A. Growth of MycER-expressing MEFs [54] cultured in the presence or absence of OHT. Each curve represent independent low passage MEFs isolates of the indicated genotypes. (AU) arbitrary units. Although population doublings were already reduced upon OHT treatment in wild-type MEFs due to Myc-induced apoptosis, sustained MycER activation markedly reduced the expansion of Pin1−/− cultures [27, 30]. B. Apoptosis in MycER-expressing MEFs assessed by Caspase 3/7 activity. In A., B. data represent the average of a triplicate measure expressed as arbitrary units (AU). C. Serum-starved MycER-expressing MEFs cells were stimulated with either 20% serum or OHT, as indicated. After 16 hours MEFs were pulse-labeled with BrdU for 20 min. The percentage of BrdU-positive cells was determined by FACS. D. Cell cycle entry and proliferation of MEFs upon serum release, as assessed by continuous labeling with BrdU. In C., D. values represent the average from two independent samples.
Figure 3
Figure 3. Loss of Pin1 does not affect Myc protein stability in B cells and MEFs
A. c-myc mRNA levels normalized to the TBP mRNA (TATA Box Binding Protein) in control, pre-tumoral splenic B cells and Eμ-myc tumors of the reported Pin1 genotype, as assessed by RT-qPCR. B. Immunoblot analysis of total (Myc), Ser 62-phosphorylated Myc (S62P-Myc) and Thr 58-phosphorylated Myc (T58P-Myc) in B220+ cells purified from spleens of the indicated genotype. Vinculin is shown as loading control. Relative densitometric analysis was performed using the Image Lab 5.0 software. The levels of total Myc normalized to Vinculin, and of S62P-Myc and T58P-Myc normalized to total Myc are reported on the right. In A., B. P-values were calculated using Student's t-test. C. Immunoblot analysis of total Myc and S62P-Myc in Eμ-myc tumors of the reported Pin1 genotype. D. Immunoblot analysis of endogenous Myc in quiescent MEFs (0h) or the same cells stimulated with 20% serum for the indicated times. Relative quantifications, performed as described in B, are reported at the bottom, for either total Myc (left) or S62P-Myc (right). E. Stability of endogenous Myc in asynchronous proliferating Pin1+/+ and Pin1−/− MEFs. Lysates were prepared at the indicated times after treatment of the cells with cycloheximide (CHX) and immunoblotted for total Myc and vinculin. The quantifications of the immunoblot and calculated Myc half-lives are shown at the bottom. Two independent MEF populations of each genotype were analyzed. One representative experiment is shown.
Figure 4
Figure 4. Gene-expression profiling in Eμ-myc Pin1−/− B cells
Total RNA from control and pre-tumoral Eμ-myc B cells of the indicated Pin1 genotypes was profiled by RNA-seq. A. Unsupervised hierarchical clustering of the sequenced samples. B. Fold-change values (log2FC) for differentially expressed genes (DEGs) in the Pin1−/− relative to the Pin1+/+ background. The DEGs shown here were first defined based on their deregulation in Eμ-myc B relative to control B cells in the Pin1+/+ background (see Methods). C. 754 genes covering the whole expression range and regulatory patterns in Eμ-myc B cells [40] were analyzed by NanoString and reported as in B. The data are based on the average of 3 biological replicates for each genotype. 361 genes previously classified as Myc-bound in pre-tumoral B cells [40] are represented in red, and 393 unbound genes in black. D., E. NanoString analysis of 80 genes that are amongst the most strongly induced in pre-tumoral B cells and are all bound by Myc in their promoter regions [40]: D. and E. show the fold-changes in pre-tumoral B cells and lymphomas, respectively, both relative to control B cells. The green lines in B., C., D. represent the linear regression of the data.
Figure 5
Figure 5. Delayed lymphomagenesis in the Pin1−/− background requires Arf/p53 activity
A. Lymphoma-free survival in cohorts of Eμ-myc or control mice of the indicated Pin1 and p53 genotypes. The median survival was 39 days for Eμ-myc Pin1+/+p53+/− and 42 days for Eμ-myc Pin1−/−p53+/− mice (P=0.5959, Log-Rank, Mantel-Cox). Numbers within brackets indicate sizes of each cohort. B. Lymphomas arising in Eμ-mycp53+/− mice show p53 loss of heterozygosis (LOH) in either Pin1+/+ or Pin1−/− background, as shown by RT-PCR. One example of each is shown. Three Eμ-myc p53+/−Pin1−/− tumors were analyzed with the same outcome. C. Same as A. with the indicated Pin1 and ARF genotypes. Calculated Median survival was 79 days for Eμ-myc Pin1+/+ARF+/− and 95 days for Eμ-myc Pin1−/−ARF+/− mice (P=0.0959, Log-Rank, Mantel-Cox). Note that in both A. and C., Eμ-myc Pin1−/− mice with functional p53 and Arf show delayed lymphomagenesis relative to their Pin1+/+ counterparts, validating the results shown in Figure 1A. D. Lymphomas arising in Eμ-mycPin1−/−ARF+/− mice show ARF loss of heterozygosis (LOH). Three tumors and one tail from Eμ-myc Pin1−/−ARF+/− mice were analyzed by RT-PCR. E. Growth curves of Eμ-myc p53ERTAMki/− lymphomas overexpressing the anti-apoptotic protein Bcl2. Cells were cultured either in the presence (100 nM) or absence (Mock) of OHT. Cell growth was assessed with the Cell Titer Glo assay. F. Cell cycle analysis of Bcl2-expressing Eμ-myc p53ERTAMki/− lymphomas 48 hours after OHT administration.
Figure 6
Figure 6. Pin1 silencing impairs tumor growth and dissemination
A. RT-qPCR of Pin1 mRNA. B. Immunoblot analysis of Pin1 protein levels, respectively, in a primary Eμ-myc lymphoma infected with conditional shRNAs targeting either Pin1 (shPin1) or renilla luciferase (shRen). The shRNAs were induced by supplementing cells with 1 μg/mL doxycycline for 24 hours. The mRNA data represent the averages ±s.d. of three technical replicates, all normalized to the housekeeper TBP and to the mock-treated shRen lymphoma. Vinculin was used as a loading control. C. Growth of two independent primary lymphoma populations (Ly27 and Ly28) infected with either shRen or shPin1, and cultured with (dox) or without (mock) doxycycline. D., E. Tumor-free survival in mice transplanted with an shRen or shPin1-bearing lymphoma (Ly28). Doxycycline was administered either continuously from the time of transplantation (D.) or following detection of tumor masses, 18 days after transplantation (E.). F. Dot plot showing the residual percentage of GFP-positive B220+ tumor cells detected in the tumor-infiltrated lymph nodes of animals transplanted with shPin1 or shRen lymphomas. Red bars indicate the average values. As in D., E., Mice were fed with doxycycline starting from days 0 or 18, as indicated. GFP serves as a marker for the doxycycline-dependent induction of the shRNAs. * p=0.014; ** p=0.0022; *** p=0.0026 (Log-rank, mantle-cox); # p=0.002, ## p=0.003 (t-test).

References

    1. Lu KP, Hanes SD, Hunter T. A human peptidyl-prolyl isomerase essential for regulation of mitosis. Nature. 1996;380:544–547. - PubMed
    1. Yaffe MB, Schutkowski M, Shen M, Zhou XZ, Stukenberg PT, Rahfeld JU, Xu J, Kuang J, Kirschner MW, Fischer G, Cantley LC, Lu KP. Sequence-specific and phosphorylation-dependent proline isomerization: a potential mitotic regulatory mechanism. Science. 1997;278:1957–1960. - PubMed
    1. Ranganathan R, Lu KP, Hunter T, Noel JP. Structural and functional analysis of the mitotic rotamase Pin1 suggests substrate recognition is phosphorylation dependent. Cell. 1997;89:875–886. - PubMed
    1. Lu KP, Zhou XZ. The prolyl isomerase PIN1: a pivotal new twist in phosphorylation signalling and disease. Nat Rev Mol Cell Biol. 2007;8:904–916. - PubMed
    1. Sears R, Nuckolls F, Haura E, Taya Y, Tamai K, Nevins JR. Multiple Ras-dependent phosphorylation pathways regulate Myc protein stability. Genes Dev. 2000;14:2501–2514. - PMC - PubMed

MeSH terms

Substances