. 2016 Mar 15;7(11):11817-37.
doi: 10.18632/oncotarget.7857.

Cancer therapeutic approach based on conformational stabilization of mutant p53 protein by small peptides

Affiliations

Cancer therapeutic approach based on conformational stabilization of mutant p53 protein by small peptides

Perry Tal et al. Oncotarget. .

Abstract

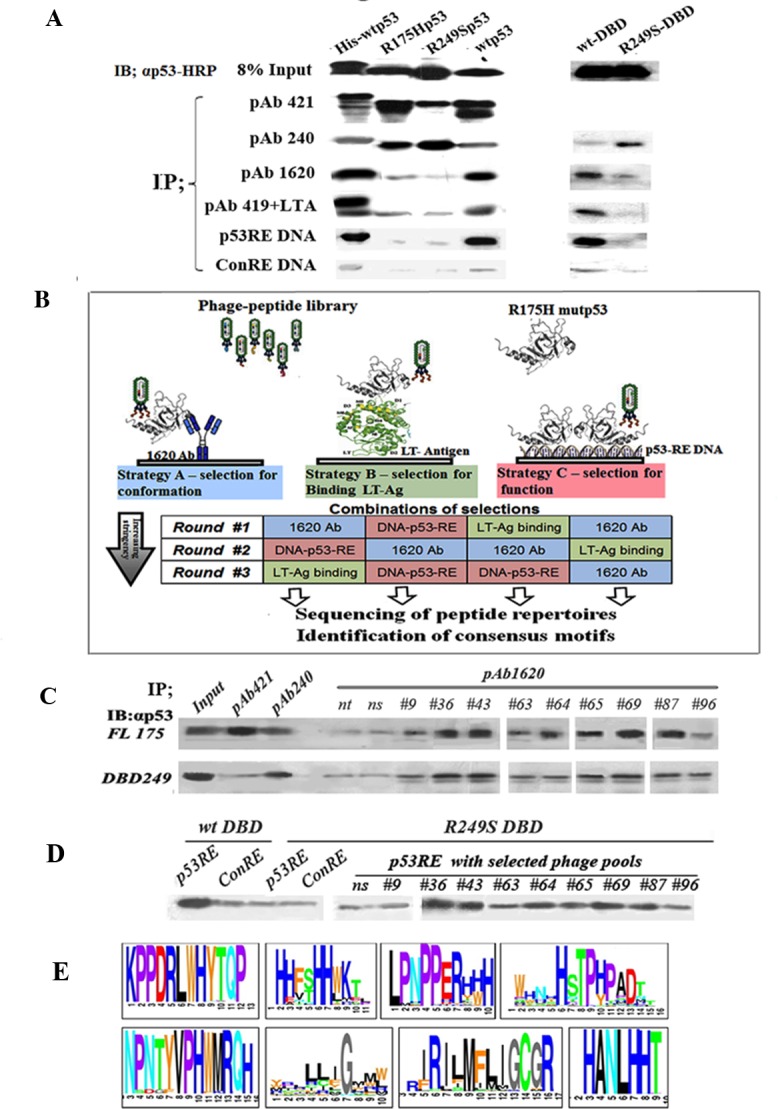
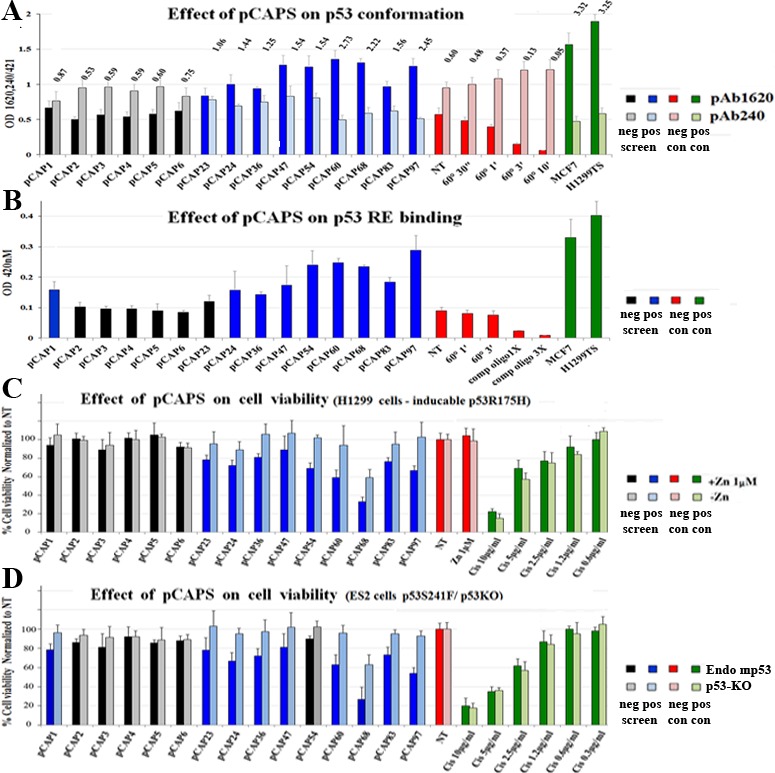
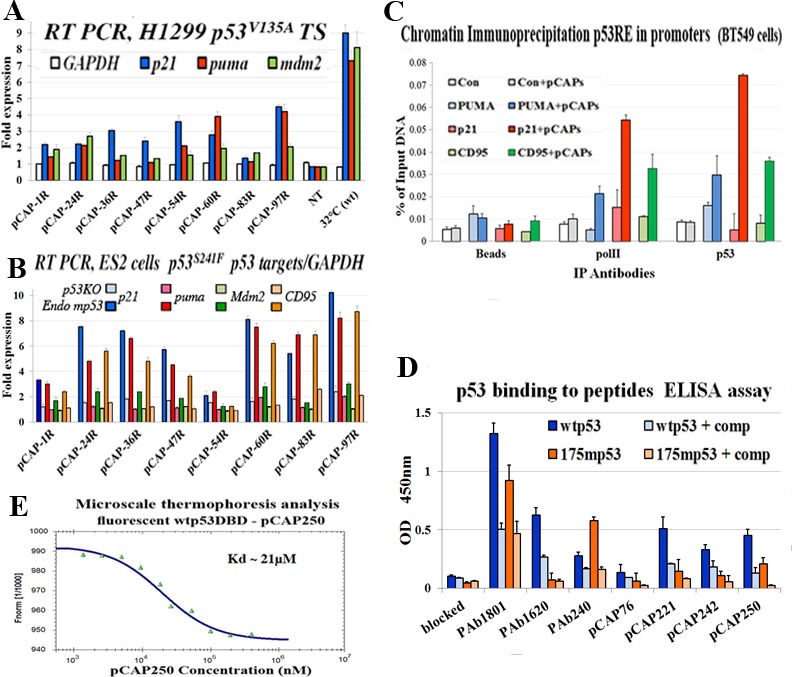
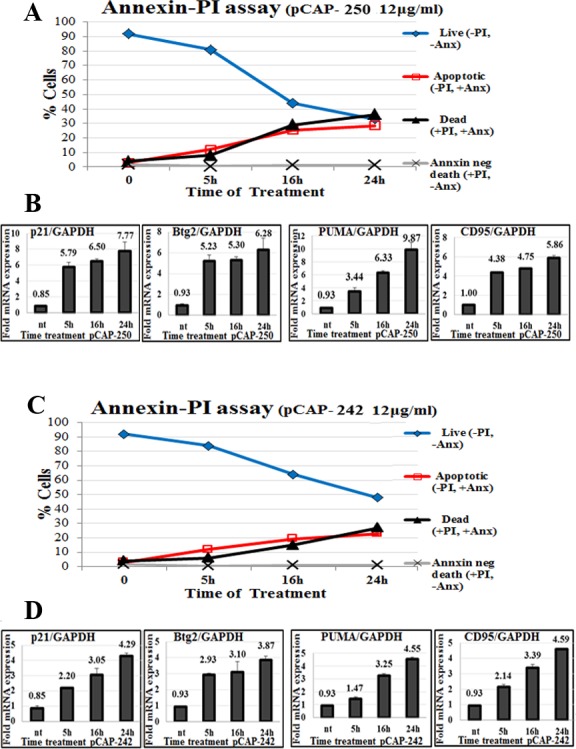
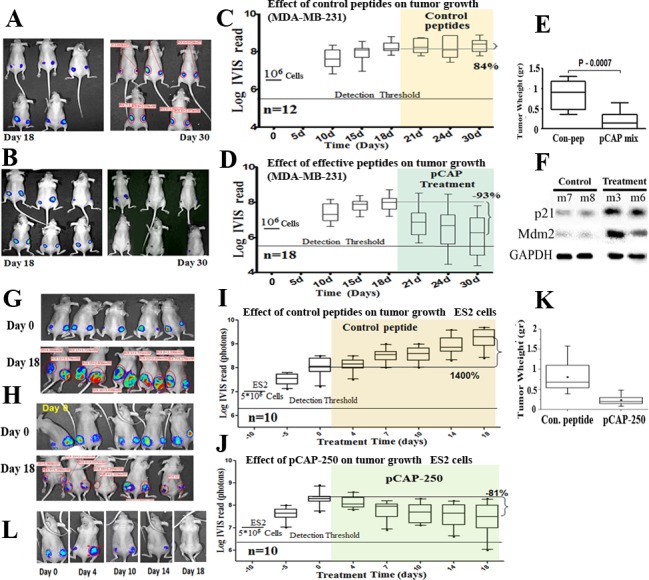
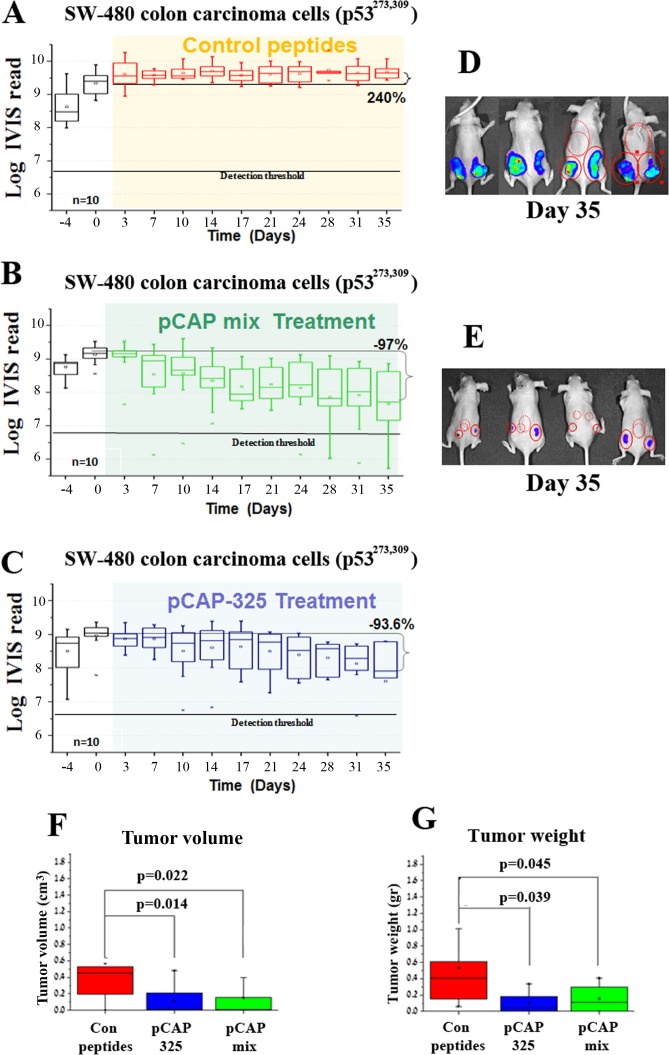
The p53 tumor suppressor serves as a major barrier against malignant transformation. Over 50% of tumors inactivate p53 by point mutations in its DNA binding domain. Most mutations destabilize p53 protein folding, causing its partial denaturation at physiological temperature. Thus a high proportion of human tumors overexpress a potential potent tumor suppressor in a non-functional, misfolded form. The equilibrium between the properly folded and misfolded states of p53 may be affected by molecules that interact with p53, stabilizing its native folding and restoring wild type p53 activity to cancer cells. To select for mutant p53 (mutp53) reactivating peptides, we adopted the phage display technology, allowing interactions between mutp53 and random peptide libraries presented on phages and enriching for phage that favor the correctly folded p53 conformation. We obtained a large database of potential reactivating peptides. Lead peptides were synthesized and analyzed for their ability to restore proper p53 folding and activity. Remarkably, many enriched peptides corresponded to known p53-binding proteins, including RAD9. Importantly, lead peptides elicited dramatic regression of aggressive tumors in mouse xenograft models. Such peptides might serve as novel agents for human cancer therapy.

Keywords: conformation; p53; peptides; pre-clinical; reactivation.


Conflict of interest statement

CONFLICTS OF INTEREST

The authors are supported by a Center of Excellence of the Flight Attendant Medical Research Institute (FAMRI) and by an Israel Science Foundation (ISF) Center of Excellence. The terms of this arrangement have been reviewed and approved by the Weizmann Institute of Science in accordance with its policy on objectivity in research.

Figures

Figure 1
Figure 1. Outline of experimental rationale, calibration of conditions
A. IP-Western analysis of the binding of WTp53 and mutp53 to various markers distinguishing between WT and mutp53 conformations. 50ng of each purified protein was subjected for immunoprecipitation with a subset of different antibodies and proteins shown to bind differentially WTp53 or mutp53: PAb421 (binds both WT and mutant), PAb1620 (WT specific), PAb240 (mutant specific), PAb419+LTag (WT specific), biotinilated-p53RE DNA oligo (WT specific), and a control oligo mutated at two bases. Immunoprecipitated material was subjected to Western blotting using αp53-HRP as second antibody. B. Schematic diagram representing the protocol for identification, screening and selection of mutp53 reactivating peptides. The protocol consists of various selection strategies, at increasing stringencies, for screening and identifying mutp53 reactivating peptides, by utilizing phage display. Strategy A (left): Conformation-based selection: selection of peptides presented by a phage, which can bind a mutp53 protein bound to immobilized WTp53 conformation-specific antibody (PAb1620), thereby enabling selection of a bound phage capable of stabilizing WTp53 conformation. Strategy B (middle): selection according to binding: selection of peptides, which can bind a mutp53 protein bound to immobilized LT-antigen. Strategy C (right): selection according to function: selection of peptides binding to immobilized WTp53-p53RE DNA complex. C. Western blot analysis of IP with PAb1620 antibody of purified either p53R175H (upper panel) or p53R249S-DBD (lower panel) in the presence of selected phage pools. Non-selected phage (ns) and no phage (nt) were used as controls. Incubation was for 3 hours at 4°C. Bound p53 in the immunoprecipitate (IP) was analyzed by Western blot using antibody against p53 (αp53). “In” stands for 10% of the IP input material, loaded directly on the gel. D. Western blot analysis of IP experiments of streptavidin-coated beads bound either to p53RE-DNA or control-RE-DNA oligonucleotides labeled with biotin were incubated with purified WTp53-DBD or mutant p53R249S-DBD in the presence of phage selected by phage display. Non selected phage (ns) were used as control. Incubation was for 3 hours at 4°C. E. A schematic illustration of several consensus peptide motifs identified as described.
Figure 2
Figure 2. Screening for functional peptides
A. Bar graph demonstrating representative ELISA experiments for determining the effect of selected peptides on the conformation of mutp53 in H1299-p53R175H cell extract, as determined by immunoassay. Cell extracts were added to ELISA plates coated with the indicated antibodies to allow mutp53 to react with the peptides and antibodies. αp53-HRP Ab was used for assessment of p53 levels. Numbers represent ratio of absorbance between the PAb1620 and PAb240 samples. All reads were normalized to the control PAb241 reading of each extract. MCF7 (WTp53) and H1299-mutp53A135V (tsp53) cells were used as positive controls for the WTp53 conformation (1620/240 ratio equals or exceeds 5:1). B. - Bar graph demonstrating representative ELISA experiments of determining the effect of selected peptides on the DNA binding activity of mutp53 in H1299-p53R175H cell extract. 96 well plates were coated with anti-p53 antibody, cell extracts containing p53 were reacted with oligonucleotides that contain a p53RE consensus binding site, labeled with biotin, in the presence or absence (NT) of test peptides. Streptavidin-HRP is used to quantify the amount of oligos in the well. TMB assay was performed to determine bound mutp53 levels (450nm). MCF7 and the H1299-mutp53A135V(TS) cells serve as positive controls for WTp53. C.and D. - Bar graphs illustrating the effect of various selected peptides on mut-p53 dependent expression on cell viability. C represents H1299 p53-null (light blue bars) and H1299 stably overexpressing mutp53R175H (blue bars). D, ES2 cells expressing endogenous mutp53 (blue bars) and ES2 cells knocked out for p53 by CRISPR construct (light blue bars). Cell lines were treated with selected peptides, Cis-platinum was used as positive control for cell death. 48 hours after treatment, cells were washed with PBS, and the remaining attached cells were stained with Crystal violet and washed 4 times with PBS. Stained cells were dissolved in 10% acetic acid and plates were taken for optical density measurement at 595nM.
Figure 3
Figure 3. Peptides binding to p53 and their effect on the expression of p53 target genes
A. - Bar graph illustrating the effect of selected peptides on activation of mutp53 by measuring transactivation of p53 target genes as determined by qRT-PCR. H1299 cells stably transfected with mutp53 (ts) A135V were used. The indicated peptides were added directly to the medium at a concentration of 5ug/ml and cells were then either moved to 32°C or returned to 37°C. 18 hours later cells were harvested, extracted for RNA, cDNA was synthesis subjected to qrt time PCR analysis. The expression level of 3 representative p53 target genes, p21, PUMA and Mdm2, were examined. The figure illustrates the relative fold induction of transcription of the cells treated with the selected peptides as compared to non-treated cells. B. - Bar graph illustrating the effect of selected peptides on activation of mutp53 by measuring transactivation of p53 target genes as determined by qRT-PCR. ES2and ES2-p53KO cells were treated with indicated peptides 5ug/ml, for 18 hours. Cells were harvested, and cDNA was subjected to qRT-PCR analysis. Expression of 4 representative p53 target genes, p21, PUMA, Mdm2 and CD95, was examined. The figure illustrates the relative fold induction of transcription in cells treated with the selected peptides compared to non-treated cells. C. - Binding of mutp53 to promoters of representative p53 target genes in live cells, assessed by chromatin immunoprecipitation. BT-549 breast cancer cells endogenously expressing mutant p53R249S were treated for 5 hours with a mix of 3 pCAPs - 250, 242 and 325. Cells treated with a mix of inert peptides served as a negative control. DNA cross-linked p53 was immunoprecipitated, and binding to the p53 responsive elements of the PUMA, p21, CD95 and MDM2 gene promoters was quantified by qPCR. Results were normalized to input total DNA. Cell extracts immunoprecipitated with beads without antibody (beads) served as negative controls. A genomic segment containing no p53RE served as negative control (white and gray bars). D. - ELISA analysis of the binding of WTp53 and mutp53 to lead peptides. Peptides were conjugated to the bottoms of the wells of 96 well plates, employing a commercial conjugation kit (TAKARA). Control wells were coated with the αp53 monoclonal antibodies PAb1801, PAb1620 and PAb240. Recombinant WTp53 or mutp53R175H was added to the wells and incubated with the bound peptides or antibodies. Where indicated, soluble peptides were added as competitors (+ comp), to confirm the specificity of the binding to p53. pCAP-76 served as a negative control peptide. After removal of recombinant protein, plates were washed and incubated with αp53-HRP followed by TMB and optical density determination. Results are presented as relative absorbance at 450nm. E. - Microscale thermophoresis (MST) analysis of the binding of fluorescently labeled WTp53 DBD and pCAP-250. See Materials and Methods for details.
Figure 4
Figure 4. Peptides trigger apoptosis in correlation to activation of WTp53 target genes
A., C. - Apoptosis of ES2 cells treated with peptides. At the indicated time points, peptides were added directly to the medium of growing ES2 cells at a concentration of 12ug/ml. Cells were harvested and stained with Annexin FITC to detect apoptotic cells, and PI (propidium iodide) staining for dead cells. Stained cells were then analyzed by flow cytometry. A total of 10,000 cells were counted for each sample. B., D. - Expression of p53 target genes p21, PUMA, BTG2 and CD95 in ES2 cells following peptide treatment. Either pCAP-242 (figure 4D) or pCAP-250 (Figure 4B) was added directly to the medium at a concentration of 12μg/ml. At the indicated time points cells were harvested and RNA subjected to qRT-PCR analysis.
Figure 5
Figure 5. Effect of lead peptides on tumor growth in vivo; breast and ovarian cancer models
A.-D. - Effect of indicated peptides in a mouse breast cancer xenograft model.106 MDA-MB-231 breast cancer cells, expressing endogenous mutp53 and stably expressing luciferase, were injected into the hips of nude mice. When tumors reached visible size, mice were treated by intra-tumoral injection, three times a week, with either a mixture of 3 control peptides that showed no phenotype in vitro (pCAPs 76, 77 and 12; 2μg of each peptide) or a mixture of 3 test peptides that exhibited mutp53-reactivating ability (pCAPs D60R, 24R and 174; 2μg of each peptide). A. - Live imaging of control group mice at the beginning of treatment (day 18) and at termination of the experiment (day 30). B. - Live imaging of mice treated with effective peptide mix at the beginning of treatment (day 18) and at termination of the experiment (day 30). C. - (control group mice) and D. (effective pCAP mix group): Logarithmic scale box-plot showing the luciferase readings in tumors as a function of time; average (horizontal line), standard deviation (box), highest and lowest reads (error bars) are shown, before (until day 18) and after initiation of treatment. The background threshold detection level of the IVIS system in this experiment was about 5×10⁶ photons. E. - Box-plot of excised tumor weights at termination of the experiment. Average weight (horizontal line), standard deviation (box), highest and lowest reads are shown.F. - Western blot analysis of two p53 target gene products, p21 and MDM2. Part of the excised tumors of mice #7 and #8 treated with control peptides and mouse #3 treated with effective peptide mix were homogenized and lysed. Protein concentration was determined using Bio-Rad reagent. 50μg protein of each sample was loaded and subjected to Western blot analysis with antibodies against p21 and MDM2. G.-K. - In-vivo effect of indicated peptides in a mouse xenograft model. 5*105 ES2 cells expressing luciferase were injected into the hips of nude mice. Bioluminescence was measured. 10 days after injection, mice were randomly divided to 2 groups and injected intratumorally, three times a week, with either a mixture of 2 control peptides (pCAPs 76 and 12; 5μg of each peptide) or pCAP-250 (10μg). G., H. - Live imaging of control group mice and pCAP-250 treated mice, respectively, at the beginning of treatment (day 0) and at termination of experiment (day 18). I. (control mice) and J. (effective pCAP-250 group): box-plot showing the luciferase readings in tumors as a function of time; average (horizontal line), standard deviation (box), highest and lowest reads are shown, before (until day 0) and after initiation of treatment. The background threshold detection level of the IVIS system was about 5×10⁶ photons. K. - Box-plot of excised tumor weights at termination of the experiment. Average weight (horizontal line), standard deviation (box), highest and lowest reads are shown.L. - Live imaging of a single mouse treated with pCAP-250 over the indicated time points.
Figure 6
Figure 6. Effect of lead peptides on tumor progression in vivo; colon cancer xenograft model
In vivo effect of the indicated peptides in a mouse xenograft model of SW-480 colon cancer cells. 106 cells were injected and tumors were allowed to establish for 10 days. Mice were then randomly divided into 3 groups and injected intratumorally, three times a week, with either a mixture of 3 control peptides (pCAPs 76, 77 and 12; 2μg of each peptide), a mixture of 3 test peptides that exhibited mutp53-reactivating ability (pCAPs 250, 308 and 325; 2μg of each peptide) or pCAP-325 (6μg). A.-C. - Logarithmic scale graph demonstrating the average luciferase readings in tumors as a function of time, before and after initiation of treatment (colored background). D., E. - Box plot of tumor volume and weight, respectively.

References

    1. Levine JA. p53, the cellular gatekeeper for growth and division. Cell. 1997;88:323–331. - PubMed
    1. Vousden KH, Lu X. Live or let die: the cell's response to p53. Nat Rev Cancer. 2002;2:594–604. - PubMed
    1. el-Deiry WS, Kern SE, Pietenpol JA, Kinzler KW, Vogelstein B. Definition of a consensus binding site for p53. Nat Genet. 1992;1:45–49. - PubMed
    1. Jordan JJ, Menendez D, Inga A, Noureddine M, Bell DA, Resnick MA. Noncanonical DNA motifs as transactivation targets by wild type and mutant p53. PLoS Genet. 2008;4:e1000104. - PMC - PubMed
    1. Veprintsev DB, Fersht AR. Algorithm for prediction of tumour suppressor p53 affinity for binding sites in DNA. Nucleic Acids Res. 2008;36:1589–1598. - PMC - PubMed

MeSH terms