. 2016 Mar 4:5:e08714.
doi: 10.7554/eLife.08714.

Genomic epidemiology of artemisinin resistant malaria

Collaborators

Genomic epidemiology of artemisinin resistant malaria

MalariaGEN Plasmodium falciparum Community Project. Elife. .

Abstract

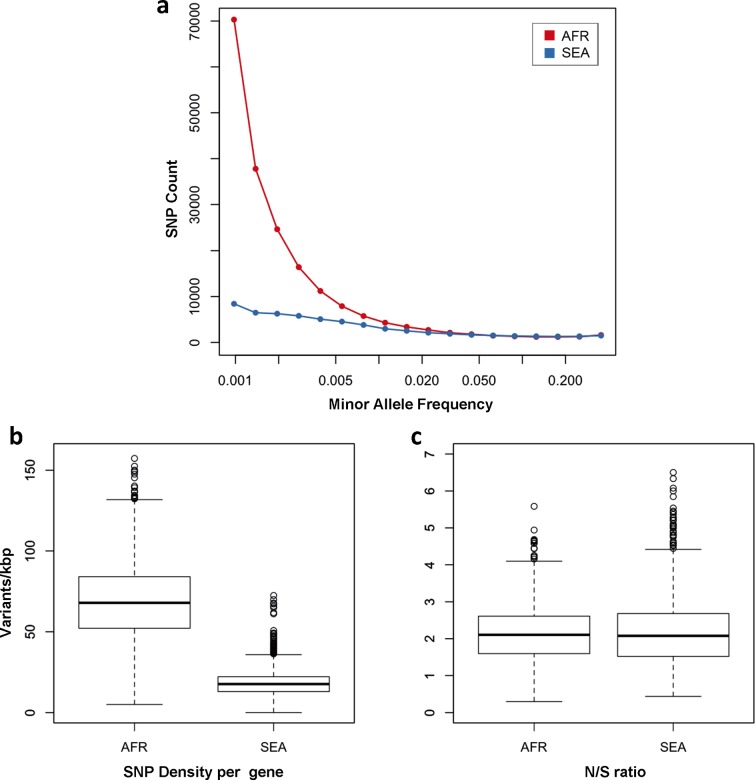
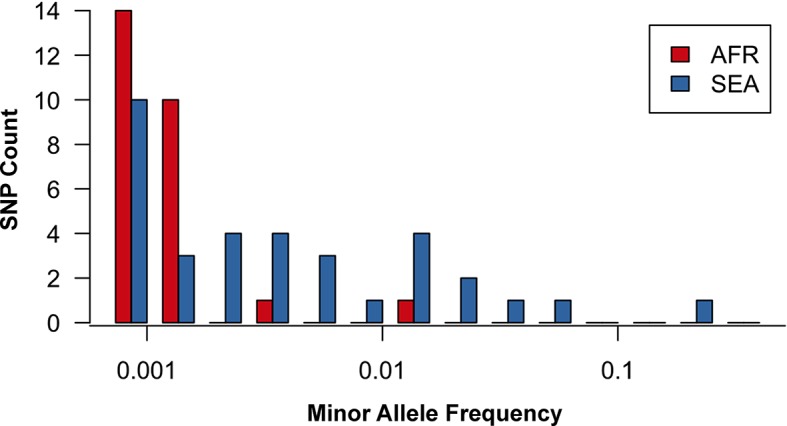
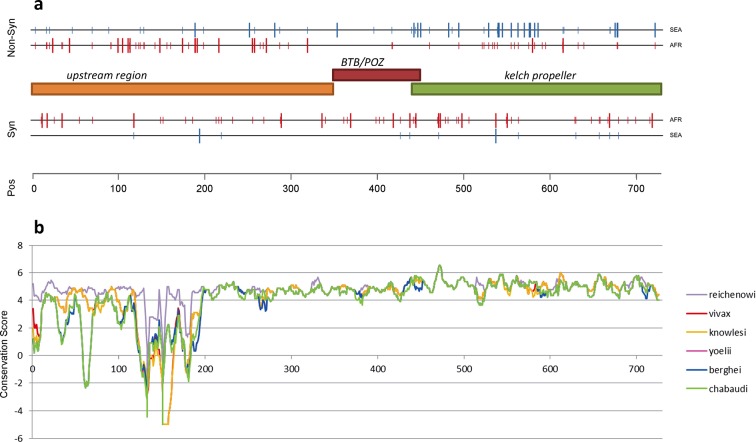
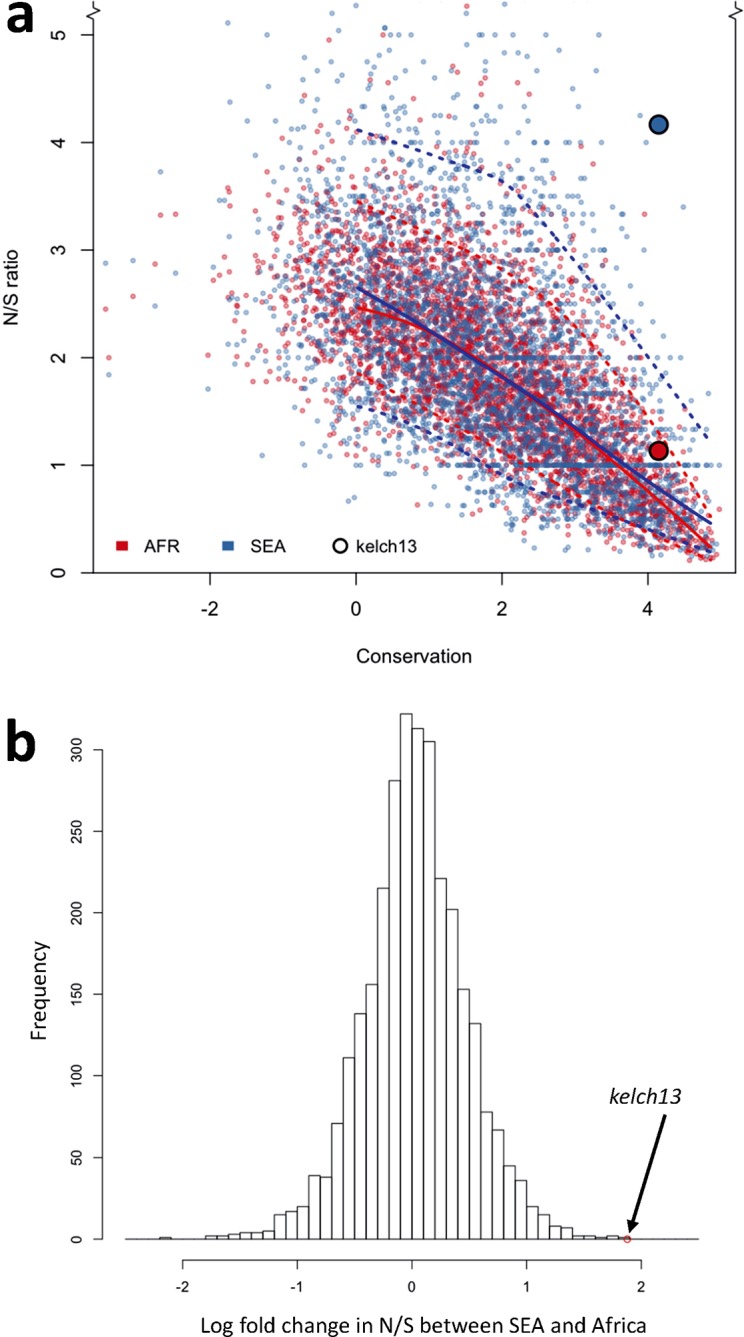
The current epidemic of artemisinin resistant Plasmodium falciparum in Southeast Asia is the result of a soft selective sweep involving at least 20 independent kelch13 mutations. In a large global survey, we find that kelch13 mutations which cause resistance in Southeast Asia are present at low frequency in Africa. We show that African kelch13 mutations have originated locally, and that kelch13 shows a normal variation pattern relative to other genes in Africa, whereas in Southeast Asia there is a great excess of non-synonymous mutations, many of which cause radical amino-acid changes. Thus, kelch13 is not currently undergoing strong selection in Africa, despite a deep reservoir of variations that could potentially allow resistance to emerge rapidly. The practical implications are that public health surveillance for artemisinin resistance should not rely on kelch13 data alone, and interventions to prevent resistance must account for local evolutionary conditions, shown by genomic epidemiology to differ greatly between geographical regions.

Keywords: artemisinin; drug resistance; evolutionary biology; genomics; infectious disease; kelch13; malaria; microbiology; plasmodium falciparum.


Conflict of interest statement

GM: Reviewing editor, eLife. The other authors declare that no competing interests exist.

Figures

Figure 1.
Figure 1.. Differentiation between African and Asian genomes.
(A) Neighbour-joining tree showing population structure across all sampling sites, with sample branches coloured according to country groupings (Table 1). Branches with large open tip circle indicate the sample is a kelch13 mutant, while those with a small black symbol are mixed infections (i.e. mixture of wild-type and mutant parasites or two mutant parasites with different mutations). Branches without tip symbols are kelch13 wild type. African kelch13 mutants are, at a genomic level, similar to other African samples. (B) Plot of second principal component (PC2) against the first (PC1), computed from a principal coordinate analysis (PCoA) of all samples in the present study, based on the same pairwise genetic distance matrix used for the tree of Figure 1A. PC1 clearly separates African samples from those collected in SEA, while PC2 is mainly driven by extreme population structure in ESEA. DOI: http://dx.doi.org/10.7554/eLife.08714.006
Figure 2.
Figure 2.. Local origin of African kelch13 mutations.
(A) Chromosome painting (see Materials and methods) of the 52 African kelch13 mutants across the two 250 kbp flanking regions on each side of the kelch13 gene. Each genome chunk is coloured according to the aggregated posterior probabilities that it originated in the African (red) or SEA (blue) population, according to the scale shown. (B) Detail of the flanking regions over a span of approximately 15 kbp, using the same colour scheme. The country of origin is indicated on the left, followed by the proportion of African chunks identified; the kelch13 mutation carried by the sample is shown on the right. Samples are sorted by the proportion of Asian chunks in this window, and the same order was applied to Panel A. Only five samples (lower region of the panel) show strong probability of Asian origin of the chunks closest to kelch13. DOI: http://dx.doi.org/10.7554/eLife.08714.007
Figure 2—figure supplement 1.
Figure 2—figure supplement 1.. Diversity within kelch13-flanking haplotypes in African mutants.
Using the same SNPs utilized in the analysis shown in Figure 2B, we estimated diversity in a 1 kbp sliding window around kelch13 (highlighted in grey), by computing the mean SNP heterozygosity in a random set of 56 African kelch13 wild type genomes. The blue shaded area reports 95% of the distribution of the values over 1000 iterations. We also computed the heterozygosity estimate for the set of 56 African kelch13 mutants (red line), and found it not to be significantly different from those in wild-type parasites, suggesting that no common flanking haplotype is shared among these mutants. DOI: http://dx.doi.org/10.7554/eLife.08714.008
Figure 2—figure supplement 2.
Figure 2—figure supplement 2.. Origin of flanking haplotypes in selected African kelch13 mutants.
Here, chromosome painting is applied to the 15 kbp region around the kelch13 gene (as in Figure 2B) for five samples for which kelch13 was flanked by chunks with >50% probability of Asian origin. Here, the SEA population was divided into two groups: kelch13 wild type (blue) and mutants (yellow), to estimate the likelihood that the haplotype originated in SEA kelch13 mutants. Strong evidence of origin from SEA mutants was only found in two samples: Y483H mutant from Ghana (top row), and a C580Y mutant from Cameroon (bottom row). DOI: http://dx.doi.org/10.7554/eLife.08714.009
Figure 3.
Figure 3.. Number and density of variants in Africa and Southeast Asia.
(a) Allele frequency spectrum for Africa (red) and SEA (blue). Polymorphisms were binned by their minor allele frequency (MAF), and the counts in each bin were plotted against frequency, shown on a logarithmic scale. Although the number of high-frequency variations is consistent between the two regions, samples from Africa possess an excess of low-frequency variations. (b) SNP density per gene: for each gene, the number of variants found in the two regions is normalized by the length of the coding region (in kbp). African samples have on average 3.9 times more mutations than parasites from SEA. (c) Non-synonymous/synonymous ratio per gene: ratios of non-synonymous to synonymous mutations found per gene are similar in the two regions. To reduce artifacts due to small numbers, only genes with at least 10 SNP were considered in both analyses. DOI: http://dx.doi.org/10.7554/eLife.08714.010
Figure 3—figure supplement 1.
Figure 3—figure supplement 1.. Site frequency spectrum for non-synonymous mutations in the KPBD.
Allele frequency spectra for Africa (red) and SEA (blue) of non-synonymous mutations in the KPBD. Polymorphisms were binned by their minor allele frequency (MAF), shown on a logarithmic scale, and the counts in each bin reported. The two populations exhibit dramatically different behaviours with an abundance of medium and high frequency variations in SEA contrasted by an extreme paucity in Africa. DOI: http://dx.doi.org/10.7554/eLife.08714.011
Figure 4.
Figure 4.. Structure of kelch13, positioning of mutations in Africa and Southeast Asia, and sequence conservation.
(a) The amino acid positions of kelch13 polymorphisms observed in Africa (red) and SEA (blue) are shown. Coloured rectangles describe the extents of the resistance domains (BTB/POZ: aa. 349–448; kelch propeller: aa. 443–721) and upstream region, with the locations of non-synonymous changes indicated above, and that of synonymous changes below. Short lines represent singleton/doubleton mutations, while longer lines represent more frequent mutations. (b) Conservation score across amino acid residues of kelch13, derived by applying a CCF53P62 matrix on alignments of the P. falciparum gene coding sequence with its homologues in six other Plasmodium species for which high-quality sequence data were available: P. reichenowi, P. vivax, P. knowlesi, P. yoelii, P. berghei, and P. chabaudi (see Materials and methods). Although the region below position 200 is less conserved, particularly in rodent species (P. yoelii, berghei, and chabaudi), there is remarkably high conservation across all species over the rest of the gene, which includes the KPBD. DOI: http://dx.doi.org/10.7554/eLife.08714.012
Figure 5.
Figure 5.. Genome-wide analysis of N/S ratio.
(a) For each gene with more than 2 synonymous or non-synonymous SNPs, the N/S ratio in Africa (red points) and in SEA (blue points) are plotted against the conservation score of the gene coding sequence. The kelch13 gene values are represented by larger circles. For each region, a solid line show median values, while dotted lines delimit 95% of the genes at varying levels of conservation. This plot is truncated on the y-axis to show more clearly the bulk of the distribution; the full range is shown in Figure 5—figure supplement 2. (b) Histogram showing the distribution of the ratio of N/S ratios in SEA and Africa, for all genes with ≥5 synonymous and ≥5 non-synonymous SNPs on each region. An arrow shows the placement of kelch13. DOI: http://dx.doi.org/10.7554/eLife.08714.015
Figure 5—figure supplement 1.
Figure 5—figure supplement 1.. N/S ratio of well-known drug resistance genes.
This figure shows the same data as Figure 5a, extended by mapping genes known to have undergone selection for antimalarial resistance. For each gene, we show circles marking the N/S ration in Africa (red letter) and SEA (blue letter), paired by a vertical line annotated with a p-value (by Fisher’s exact test) that the two ratios are significantly different. The genes shown are kelch13 (denoted by the letter ‘K’), pfcrt (chloroquine resistance, ‘C’), pfdhfr (pyrimethamine resistance, ‘R’), pfdhps (sulfadoxine resistance, ‘S’), and pfmdr1 (resistance to chloroquine and other drugs, ‘M’). These results are best analyzed in the context of the underlying selective sweeps. For example, the small difference between ratios for the pfmdr1 gene can be explained by the association of the drug resistance phenotype with gene amplification, rather than with non-synonymous changes. Also, the extremely high N/S ratio for pfcrt in SEA is largely due to a paucity of synonymous SNPs, caused by the near-fixation of a very small number of haplotypes in the SEA region, yielding a p-value comparable to that of kelch13. DOI: http://dx.doi.org/10.7554/eLife.08714.016
Figure 5—figure supplement 2.
Figure 5—figure supplement 2.. Genome-wide analysis of high-frequency SNP density.
(a) Plot of the density of frequent (present in 3 or more samples) non-synonymous mutations in Africa (red) and SEA (blue) against conservation, for all genes with more than 2 synonymous or non-synonymous SNPs, showing that kelch13 (larger circle) is consistent with other similarly conserved genes in Africa, but has excess non-synonymous polymorphisms in SEA. (b) An analogous plot for synonymous mutations also shows that kelch13 follows the normal trend among genes in Africa, but has far fewer SNPs than expected in SEA. DOI: http://dx.doi.org/10.7554/eLife.08714.017
Figure 6.
Figure 6.. Structure of the kelch13 propeller domain, showing the position of mutations in Southeast Asia and Africa.
The sequence of the kelch13 propeller domain (amino acids 443–726) is organized according to its 6-blade tertiary structure, with the four β-strands characterizing each blade highlighted in colour. Polymorphisms observed in SEA (top panel) and Africa (bottom panel) are shown by circles above the mutated position. Small circles indicate very rare mutations (singletons and doubletons), while larger circles are used for more frequent mutations. DOI: http://dx.doi.org/10.7554/eLife.08714.018
Figure 6—figure supplement 1.
Figure 6—figure supplement 1.. Characterization of kelch13 mutations in Africa and Southeast Asia.
In these plots, all kelch13 amino acids in the propeller domains, downstream of position 430, are plotted against their Kyte-Doolittle hydrophobicity score (KD, gray). Circle symbols in plot (a) derived amino acid alleles in P. falciparum, coloured according to the conservation score against the ancestral allele (Table 5), derived from the CFF53P62 substitution matrix; lower values indicate more radical substitutions. The remaining plots use the same colouring scheme to show polymorphisms observed in ≥3 samples in Africa (b) or in SEA (c). DOI: http://dx.doi.org/10.7554/eLife.08714.019

Similar articles

Cited by

References

    1. Adams J, Kelso R, Cooley L. The kelch repeat superfamily of proteins: propellers of cell function. Trends in Cell Biology. 2000;10:17–24. doi: 10.1016/S0962-8924(99)01673-6. - DOI - PubMed
    1. Ariey F, Witkowski B, Amaratunga C, Beghain J, Langlois A-C, Khim N, Kim S, Duru V, Bouchier C, Ma L, Lim P, Leang R, Duong S, Sreng S, Suon S, Chuor CM, Bout DM, Ménard S, Rogers WO, Genton B, Fandeur T, Miotto O, Ringwald P, Le Bras J, Berry A, Barale J-C, Fairhurst RM, Benoit-Vical F, Mercereau-Puijalon O, Ménard D. A molecular marker of artemisinin-resistant plasmodium falciparum malaria. Nature. 2014;505:50–55. doi: 10.1038/nature12876. - DOI - PMC - PubMed
    1. Ashley EA, Dhorda M, Fairhurst RM, Amaratunga C, Lim P, Suon S, Sreng S, Anderson JM, Mao S, Sam B, Sopha C, Chuor CM, Nguon C, Sovannaroth S, Pukrittayakamee S, Jittamala P, Chotivanich K, Chutasmit K, Suchatsoonthorn C, Runcharoen R, Hien TT, Thuy-Nhien NT, Thanh NV, Phu NH, Htut Y, Han KT, Aye KH, Mokuolu OA, Olaosebikan RR, Folaranmi OO, Mayxay M, Khanthavong M, Hongvanthong B, Newton PN, Onyamboko MA, Fanello CI, Tshefu AK, Mishra N, Valecha N, Phyo AP, Nosten F, Yi P, Tripura R, Borrmann S, Bashraheil M, Peshu J, Faiz MA, Ghose A, Hossain MA, Samad R, Rahman MR, Hasan MM, Islam A, Miotto O, Amato R, MacInnis B, Stalker J, Kwiatkowski DP, Bozdech Z, Jeeyapant A, Cheah PY, Sakulthaew T, Chalk J, Intharabut B, Silamut K, Lee SJ, Vihokhern B, Kunasol C, Imwong M, Tarning J, Taylor WJ, Yeung S, Woodrow CJ, Flegg JA, Das D, Smith J, Venkatesan M, Plowe CV, Stepniewska K, Guerin PJ, Dondorp AM, Day NP, White NJ, Tracking Resistance to Artemisinin Collaboration (TRAC) Tracking Resistance to Artemisinin Collaboration (TRAC)Tracking Resistance to Artemisinin Collaboration (TRAC) Spread of artemisinin resistance in plasmodium falciparum malaria. New England Journal of Medicine. 2014;371:411–423. doi: 10.1056/NEJMoa1314981. - DOI - PMC - PubMed
    1. Auburn S, Campino S, Clark TG, Djimde AA, Zongo I, Pinches R, Manske M, Mangano V, Alcock D, Anastasi E, Maslen G, MacInnis B, Rockett K, Modiano D, Newbold CI, Doumbo OK, Ouédraogo JB, Kwiatkowski DP, Dimopoulos G. An effective method to purify plasmodium falciparum DNA directly from clinical blood samples for whole genome high-throughput sequencing. PLoS ONE. 2011;6:e08714. doi: 10.1371/journal.pone.0022213. - DOI - PMC - PubMed
    1. Bentley DR, Balasubramanian S, Swerdlow HP, Smith GP, Milton J, Brown CG, Hall KP, Evers DJ, Barnes CL, Bignell HR, Boutell JM, Bryant J, Carter RJ, Keira Cheetham R, Cox AJ, Ellis DJ, Flatbush MR, Gormley NA, Humphray SJ, Irving LJ, Karbelashvili MS, Kirk SM, Li H, Liu X, Maisinger KS, Murray LJ, Obradovic B, Ost T, Parkinson ML, Pratt MR, Rasolonjatovo IMJ, Reed MT, Rigatti R, Rodighiero C, Ross MT, Sabot A, Sankar SV, Scally A, Schroth GP, Smith ME, Smith VP, Spiridou A, Torrance PE, Tzonev SS, Vermaas EH, Walter K, Wu X, Zhang L, Alam MD, Anastasi C, Aniebo IC, Bailey DMD, Bancarz IR, Banerjee S, Barbour SG, Baybayan PA, Benoit VA, Benson KF, Bevis C, Black PJ, Boodhun A, Brennan JS, Bridgham JA, Brown RC, Brown AA, Buermann DH, Bundu AA, Burrows JC, Carter NP, Castillo N, Chiara E. Catenazzi M, Chang S, Neil Cooley R, Crake NR, Dada OO, Diakoumakos KD, Dominguez-Fernandez B, Earnshaw DJ, Egbujor UC, Elmore DW, Etchin SS, Ewan MR, Fedurco M, Fraser LJ, Fuentes Fajardo KV, Scott Furey W, George D, Gietzen KJ, Goddard CP, Golda GS, Granieri PA, Green DE, Gustafson DL, Hansen NF, Harnish K, Haudenschild CD, Heyer NI, Hims MM, Ho JT, Horgan AM, Hoschler K, Hurwitz S, Ivanov DV, Johnson MQ, James T, Huw Jones TA, Kang G-D, Kerelska TH, Kersey AD, Khrebtukova I, Kindwall AP, Kingsbury Z, Kokko-Gonzales PI, Kumar A, Laurent MA, Lawley CT, Lee SE, Lee X, Liao AK, Loch JA, Lok M, Luo S, Mammen RM, Martin JW, McCauley PG, McNitt P, Mehta P, Moon KW, Mullens JW, Newington T, Ning Z, Ling Ng B, Novo SM, O’Neill MJ, Osborne MA, Osnowski A, Ostadan O, Paraschos LL, Pickering L, Pike AC, Pike AC, Chris Pinkard D, Pliskin DP, Podhasky J, Quijano VJ, Raczy C, Rae VH, Rawlings SR, Chiva Rodriguez A, Roe PM, Rogers J, Rogert Bacigalupo MC, Romanov N, Romieu A, Roth RK, Rourke NJ, Ruediger ST, Rusman E, Sanches-Kuiper RM, Schenker MR, Seoane JM, Shaw RJ, Shiver MK, Short SW, Sizto NL, Sluis JP, Smith MA, Ernest Sohna Sohna J, Spence EJ, Stevens K, Sutton N, Szajkowski L, Tregidgo CL, Turcatti G, vandeVondele S, Verhovsky Y, Virk SM, Wakelin S, Walcott GC, Wang J, Worsley GJ, Yan J, Yau L, Zuerlein M, Rogers J, Mullikin JC, Hurles ME, McCooke NJ, West JS, Oaks FL, Lundberg PL, Klenerman D, Durbin R, Smith AJ. Accurate whole human genome sequencing using reversible terminator chemistry. Nature. 2008;456:53–59. doi: 10.1038/nature07517. - DOI - PMC - PubMed

Publication types

MeSH terms