Respiratory Variability during Sleep in Methadone Maintenance Treatment Patients
- PMID: 26943710
- PMCID: PMC4795289
- DOI: 10.5664/jcsm.5702
Respiratory Variability during Sleep in Methadone Maintenance Treatment Patients
Abstract
Study objectives: Methadone maintenance treatment (MMT) patients have a high prevalence of central sleep apnea and ataxic breathing related to damage to central respiratory rhythm control. However, the quantification of sleep apnea indices requires laborious manual scoring, and ataxic breathing pattern is subjectively judged by visual pattern recognition. This study proposes a semi-automated technique to characterize respiratory variability in MMT patients.
Methods: Polysomnography, blood, and functional outcomes of sleep questionnaire (FOSQ) from 50 MMT patients and 20 healthy subjects with matched age, sex, and body mass index, were analyzed. Inter-breath intervals (IBI) were extracted from the nasal cannula pressure signal. Variability of IBI over 100 breaths was quantified by standard deviation (SD), coefficient of variation (CV), and scaling exponent (α) from detrended fluctuation analysis. The relationships between these variability measures and blood methadone concentration, central sleep apnea index (CAI), apnea-hypopnea index (AHI), and clinical outcome (FOSQ), were then examined.
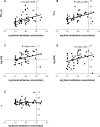
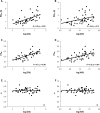
Results: MMT patients had significantly higher SD and CV during all sleep stages. During NREM sleep, SD and CV were correlated with blood methadone concentration (Spearman R = 0.52 and 0.56, respectively; p < 0.01). SD and CV were also correlated with CAI (R = 0.63 and 0.71, p < 0.001, respectively), and AHI (R = 0.45 and 0.58, p < 0.01, respectively). Only α showed significant correlation with FOSQ (R = -0.33, p < 0.05).
Conclusions: MMT patients have a higher respiratory variability during sleep than healthy controls. Semi-automated variability measures are related to apnea indices obtained by manual scoring and may provide a new approach to quantify opioid-related sleep-disordered breathing.
Keywords: central apnea; detrended fluctuation analysis; inter-breath interval; methadone; narcotic drugs.
© 2016 American Academy of Sleep Medicine.
Figures


Similar articles
-
Subjective daytime sleepiness and daytime function in patients on stable methadone maintenance treatment: possible mechanisms.J Clin Sleep Med. 2008 Dec 15;4(6):557-62. J Clin Sleep Med. 2008. PMID: 19110885 Free PMC article.
-
Central sleep apnea in stable methadone maintenance treatment patients.Chest. 2005 Sep;128(3):1348-56. doi: 10.1378/chest.128.3.1348. Chest. 2005. PMID: 16162728
-
Obstructive sleep apnea is more common than central sleep apnea in methadone maintenance patients with subjective sleep complaints.Drug Alcohol Depend. 2010 Apr 1;108(1-2):77-83. doi: 10.1016/j.drugalcdep.2009.11.019. Epub 2010 Jan 15. Drug Alcohol Depend. 2010. PMID: 20079978 Free PMC article.
-
A narrative review: The effects of opioids on sleep disordered breathing in chronic pain patients and methadone maintained patients.Am J Addict. 2016 Sep;25(6):452-65. doi: 10.1111/ajad.12424. Am J Addict. 2016. PMID: 27554389 Review.
-
Sleep-disordered breathing with chronic opioid use.Expert Opin Drug Saf. 2007 Nov;6(6):641-9. doi: 10.1517/14740338.6.6.641. Expert Opin Drug Saf. 2007. PMID: 17967153 Review.
Cited by
-
A review of sleep disturbance in adults prescribed medications for opioid use disorder: potential treatment targets for a highly prevalent, chronic problem.Sleep Med. 2021 Aug;84:142-153. doi: 10.1016/j.sleep.2021.05.021. Epub 2021 May 27. Sleep Med. 2021. PMID: 34153796 Free PMC article. Review.
-
Sleep Health Among Adults in Outpatient Opioid Use Disorder Treatment: A Systematic Review.J Psychosoc Nurs Ment Health Serv. 2024 Jan;62(1):19-26. doi: 10.3928/02793695-20230622-04. Epub 2023 Jul 3. J Psychosoc Nurs Ment Health Serv. 2024. PMID: 37379124 Free PMC article.
-
Factors Associated with Sleep Disorders among Methadone-Maintained Drug Users in Vietnam.Int J Environ Res Public Health. 2019 Nov 6;16(22):4315. doi: 10.3390/ijerph16224315. Int J Environ Res Public Health. 2019. PMID: 31698771 Free PMC article.
-
Predictors of sleep disturbance in heroin users receiving methadone maintenance therapy: a naturalistic study in Taiwan.Neuropsychiatr Dis Treat. 2018 Oct 26;14:2853-2859. doi: 10.2147/NDT.S177370. eCollection 2018. Neuropsychiatr Dis Treat. 2018. PMID: 30464470 Free PMC article.
-
Sleep reductions associated with illicit opioid use and clinic-hour changes during opioid agonist treatment for opioid dependence: Measurement by electronic diary and actigraphy.J Subst Abuse Treat. 2019 Nov;106:43-57. doi: 10.1016/j.jsat.2019.08.011. Epub 2019 Aug 14. J Subst Abuse Treat. 2019. PMID: 31540611 Free PMC article. Clinical Trial.
References
-
- Centers for Disease Control and Prevention (CDC) Addressing prescription drug abuse in the United States: current activities and future opportunities. 2013. Retrieved June 11, 2015 from http://www.cdc.gov/drugoverdose/pdf/hhs_prescription_drug_abuse_report_0....
-
- Gutstein H, Akil H. Opioid analgesics. In: Hardman JG, Limbird LE, Gilman AG, editors. Opioid analgesics. New York, NY: McGraw-Hill; 2005.
-
- Webster LR, Cochella S, Dasgupta N, et al. An analysis of the root causes for opioid-related overdose deaths in the United States. Pain Med. 2011;12(Suppl 2):S26–35. - PubMed
-
- Shook JE, Watkins WD, Camporesi EM. Differential roles of opioid receptors in respiration, respiratory-disease, and opiate-induced respiratory depression. Am Rev Respir Dis. 1990;142:895–909. - PubMed
-
- Weil JV, Mccullough RE, Kline JS, Sodal IE. Diminished Ventilatory response to hypoxia and hypercapnia after morphine in normal man. N Engl J Med. 1975;292:1103–6. - PubMed
Publication types
MeSH terms
Substances
LinkOut - more resources
Full Text Sources
Other Literature Sources
Medical

