

Inferring Population Size History from Large Samples of Genome-Wide Molecular Data - An Approximate Bayesian Computation Approach
- PMID: 26943927
- PMCID: PMC4778914
- DOI: 10.1371/journal.pgen.1005877
Inferring Population Size History from Large Samples of Genome-Wide Molecular Data - An Approximate Bayesian Computation Approach
Abstract
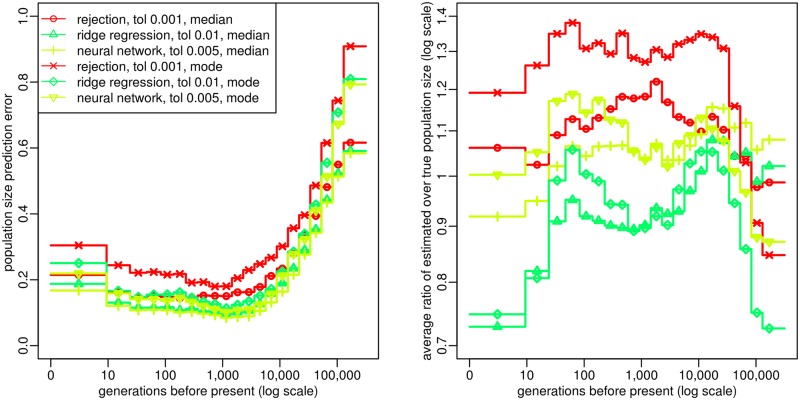
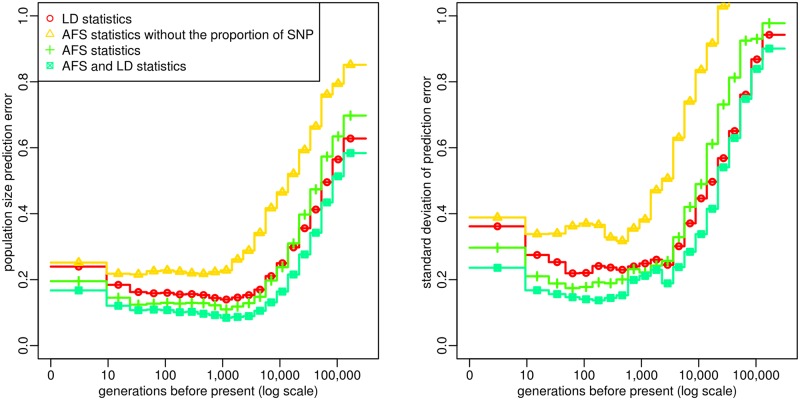
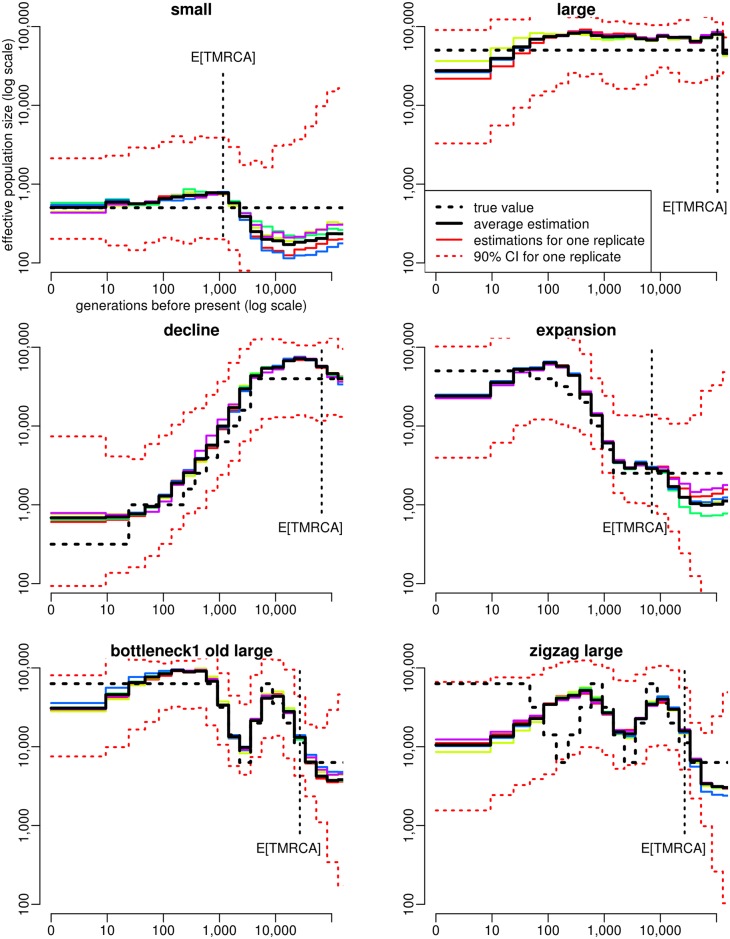
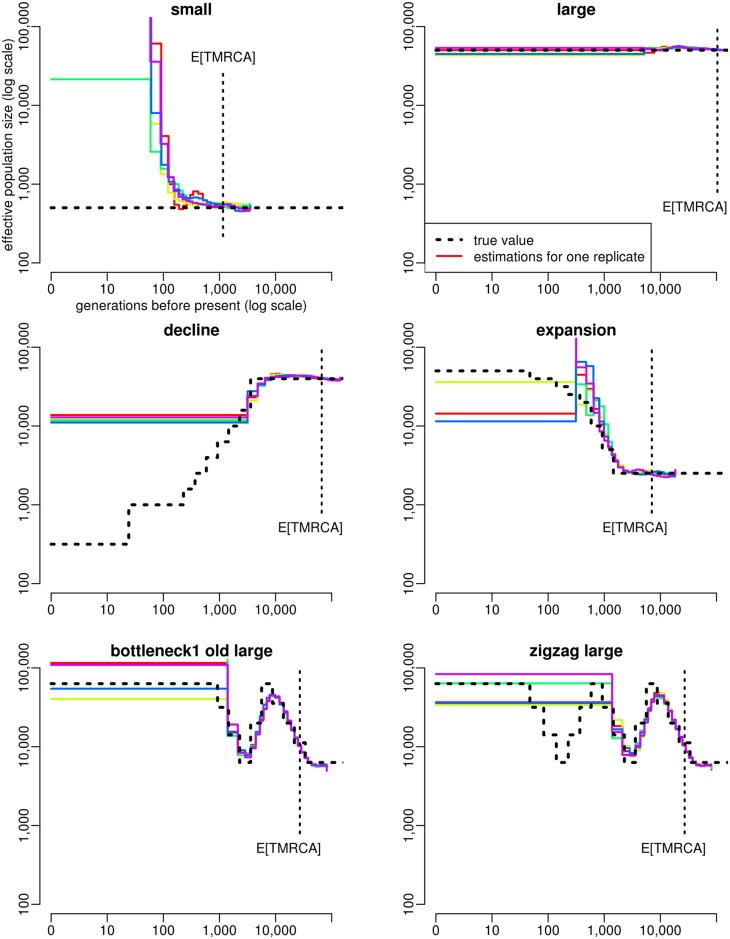
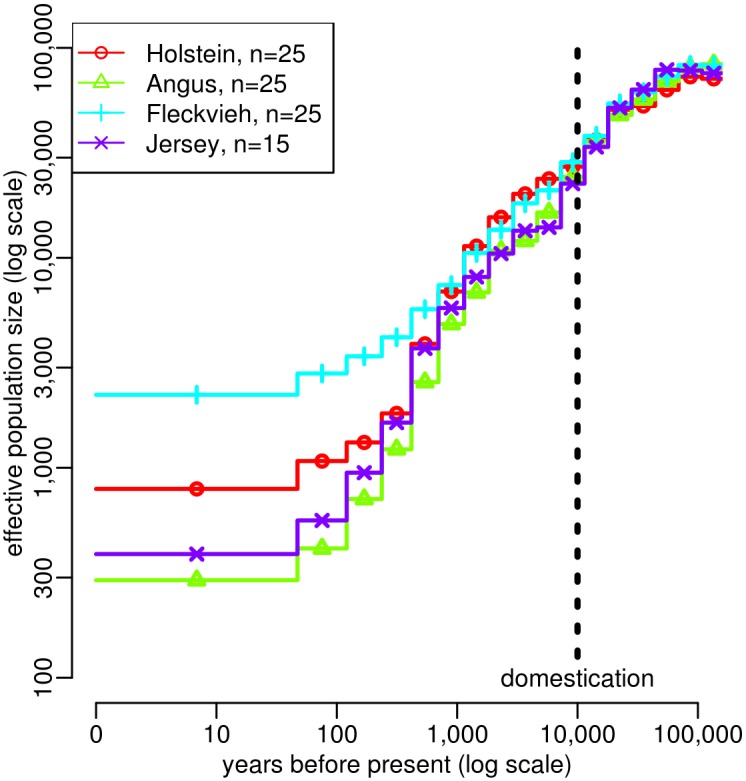
Inferring the ancestral dynamics of effective population size is a long-standing question in population genetics, which can now be tackled much more accurately thanks to the massive genomic data available in many species. Several promising methods that take advantage of whole-genome sequences have been recently developed in this context. However, they can only be applied to rather small samples, which limits their ability to estimate recent population size history. Besides, they can be very sensitive to sequencing or phasing errors. Here we introduce a new approximate Bayesian computation approach named PopSizeABC that allows estimating the evolution of the effective population size through time, using a large sample of complete genomes. This sample is summarized using the folded allele frequency spectrum and the average zygotic linkage disequilibrium at different bins of physical distance, two classes of statistics that are widely used in population genetics and can be easily computed from unphased and unpolarized SNP data. Our approach provides accurate estimations of past population sizes, from the very first generations before present back to the expected time to the most recent common ancestor of the sample, as shown by simulations under a wide range of demographic scenarios. When applied to samples of 15 or 25 complete genomes in four cattle breeds (Angus, Fleckvieh, Holstein and Jersey), PopSizeABC revealed a series of population declines, related to historical events such as domestication or modern breed creation. We further highlight that our approach is robust to sequencing errors, provided summary statistics are computed from SNPs with common alleles.
Conflict of interest statement
The authors have declared that no competing interests exist.
Figures
Similar articles
-
Inferring the history of population size change from genome-wide SNP data.Mol Biol Evol. 2012 Dec;29(12):3653-67. doi: 10.1093/molbev/mss175. Epub 2012 Jul 10. Mol Biol Evol. 2012. PMID: 22787284
-
Fixed-length haplotypes can improve genomic prediction accuracy in an admixed dairy cattle population.Genet Sel Evol. 2017 Jul 3;49(1):54. doi: 10.1186/s12711-017-0329-y. Genet Sel Evol. 2017. PMID: 28673233 Free PMC article.
-
Efficiency of multi-breed genomic selection for dairy cattle breeds with different sizes of reference population.J Dairy Sci. 2014;97(6):3918-29. doi: 10.3168/jds.2013-7761. Epub 2014 Apr 3. J Dairy Sci. 2014. PMID: 24704232
-
Exploring Approximate Bayesian Computation for inferring recent demographic history with genomic markers in nonmodel species.Mol Ecol Resour. 2018 May;18(3):525-540. doi: 10.1111/1755-0998.12758. Epub 2018 Feb 12. Mol Ecol Resour. 2018. PMID: 29356336
-
Inferring population size changes with sequence and SNP data: lessons from human bottlenecks.Heredity (Edinb). 2013 May;110(5):409-19. doi: 10.1038/hdy.2012.120. Epub 2013 Feb 20. Heredity (Edinb). 2013. PMID: 23423148 Free PMC article. Review.
Cited by
-
Conservation Genomic Analysis of the Asian Honeybee in China Reveals Climate Factors Underlying Its Population Decline.Insects. 2022 Oct 19;13(10):953. doi: 10.3390/insects13100953. Insects. 2022. PMID: 36292899 Free PMC article.
-
Evaluation of the accuracy of imputed sequence variant genotypes and their utility for causal variant detection in cattle.Genet Sel Evol. 2017 Feb 21;49(1):24. doi: 10.1186/s12711-017-0301-x. Genet Sel Evol. 2017. PMID: 28222685 Free PMC article.
-
Construction of PRDM9 allele-specific recombination maps in cattle using large-scale pedigree analysis and genome-wide single sperm genomics.DNA Res. 2018 Apr 1;25(2):183-194. doi: 10.1093/dnares/dsx048. DNA Res. 2018. PMID: 29186399 Free PMC article.
-
Population structure, genetic diversity, and selective signature of Chaka sheep revealed by whole genome sequencing.BMC Genomics. 2020 Jul 29;21(1):520. doi: 10.1186/s12864-020-06925-z. BMC Genomics. 2020. PMID: 32727368 Free PMC article.
-
The Genomic Footprints of the Fall and Recovery of the Crested Ibis.Curr Biol. 2019 Jan 21;29(2):340-349.e7. doi: 10.1016/j.cub.2018.12.008. Epub 2019 Jan 10. Curr Biol. 2019. PMID: 30639104 Free PMC article.
References
-
- Akey JM, Zhang G, Zhang K, Jin L, Shriver MD. Interrogating a High-Density SNP Map for Signatures of Natural Selection. Genome Research. 2002;12(12):1805–1814. Available from: http://genome.cshlp.org/content/12/12/1805.abstract. 10.1101/gr.631202 - DOI - PMC - PubMed
-
- Quéméré E, Amelot X, Pierson J, Crouau-Roy B, Chikhi L. Genetic data suggest a natural prehuman origin of open habitats in northern Madagascar and question the deforestation narrative in this region. Proceedings of the National Academy of Sciences. 2012;109(32):13028–13033. Available from: http://www.pnas.org/content/109/32/13028.abstract. 10.1073/pnas.1200153109 - DOI - PMC - PubMed
-
- Pybus OG, Rambaut A, Harvey PH. An Integrated Framework for the Inference of Viral Population History From Reconstructed Genealogies. Genetics. 2000;155(3):1429–1437. Available from: http://www.genetics.org/content/155/3/1429.abstract. - PMC - PubMed
Publication types
MeSH terms
LinkOut - more resources
Full Text Sources
Other Literature Sources
Miscellaneous
