. 2016 May 1;310(9):L824-36.
doi: 10.1152/ajplung.00350.2015. Epub 2016 Mar 4.

α-Smooth muscle actin is an inconsistent marker of fibroblasts responsible for force-dependent TGFβ activation or collagen production across multiple models of organ fibrosis

Affiliations

α-Smooth muscle actin is an inconsistent marker of fibroblasts responsible for force-dependent TGFβ activation or collagen production across multiple models of organ fibrosis

Kai-Hui Sun et al. Am J Physiol Lung Cell Mol Physiol. .

Abstract

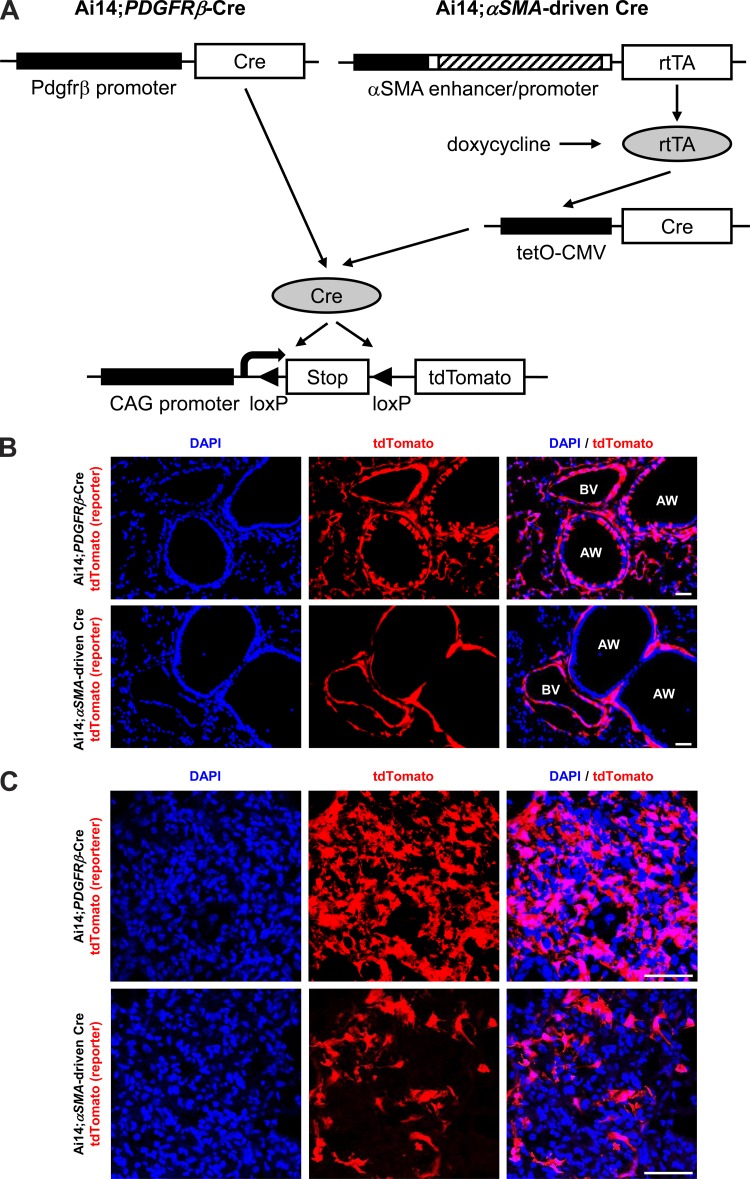
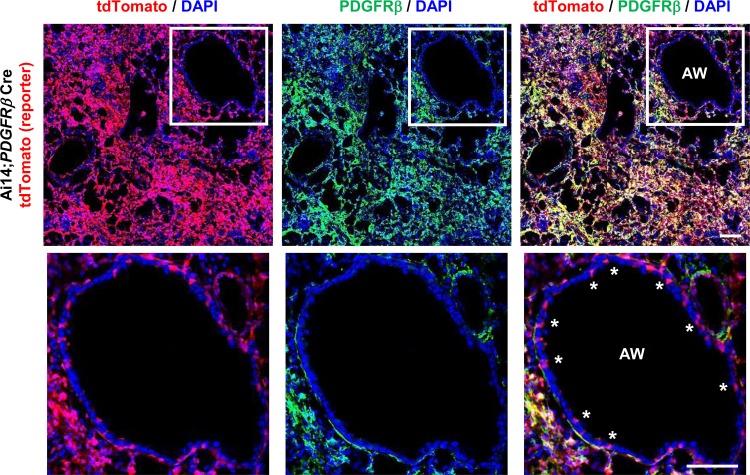
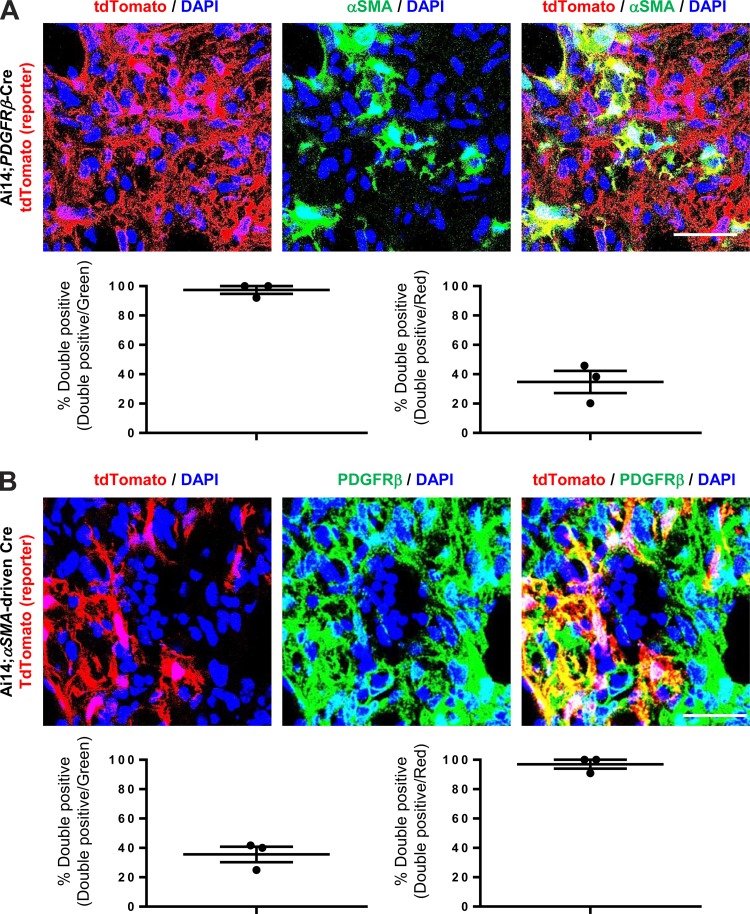
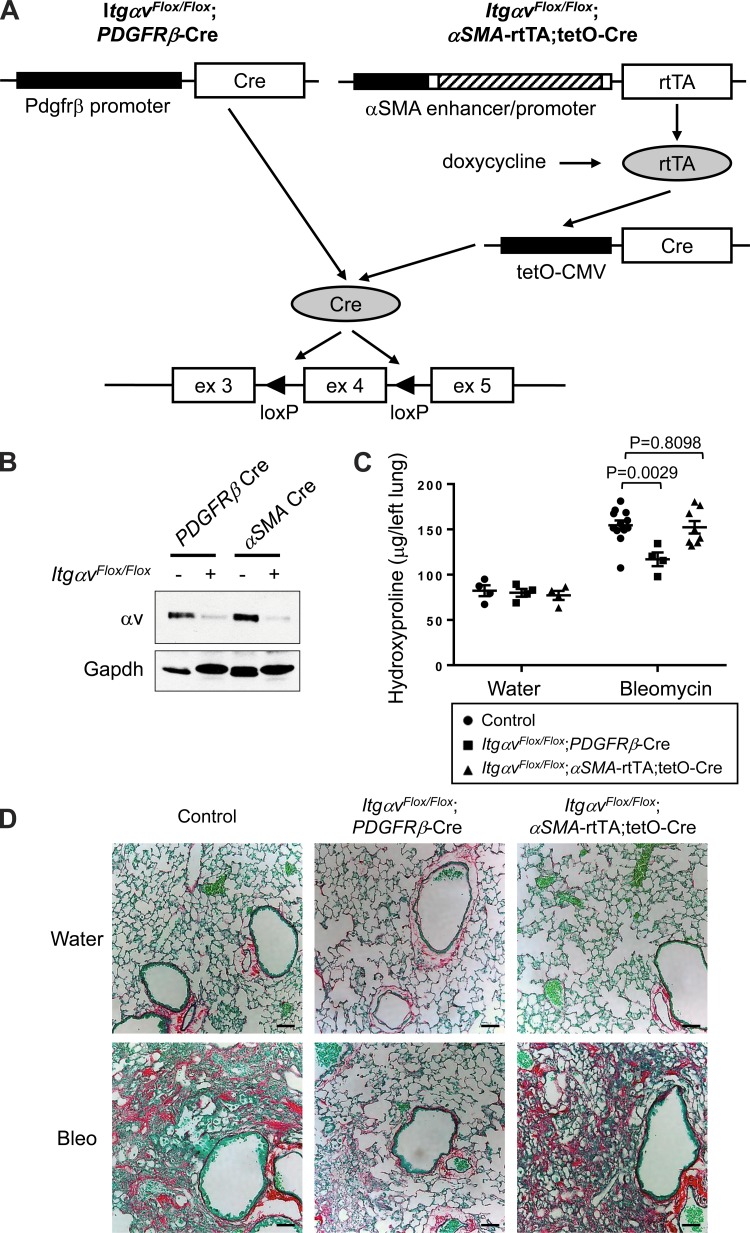
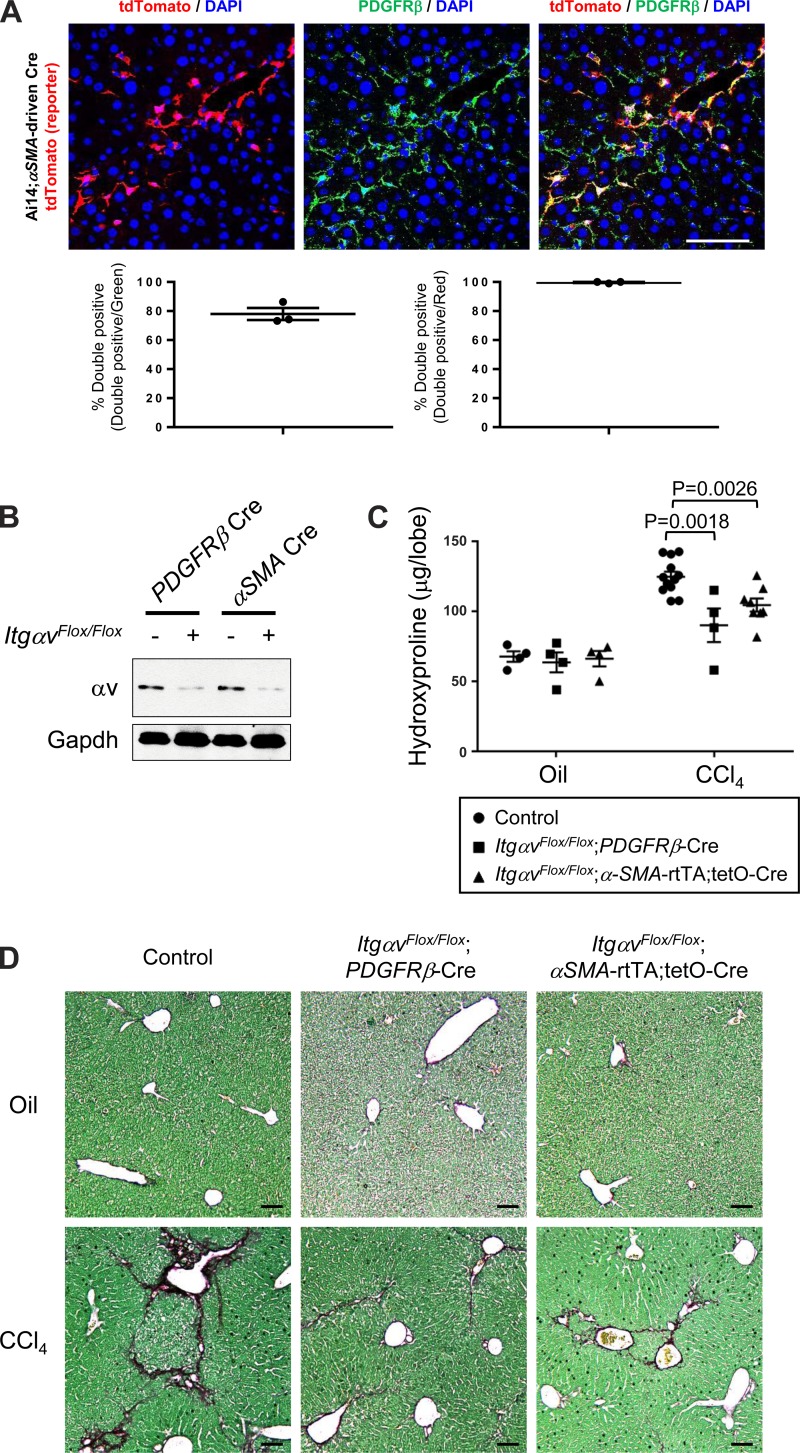
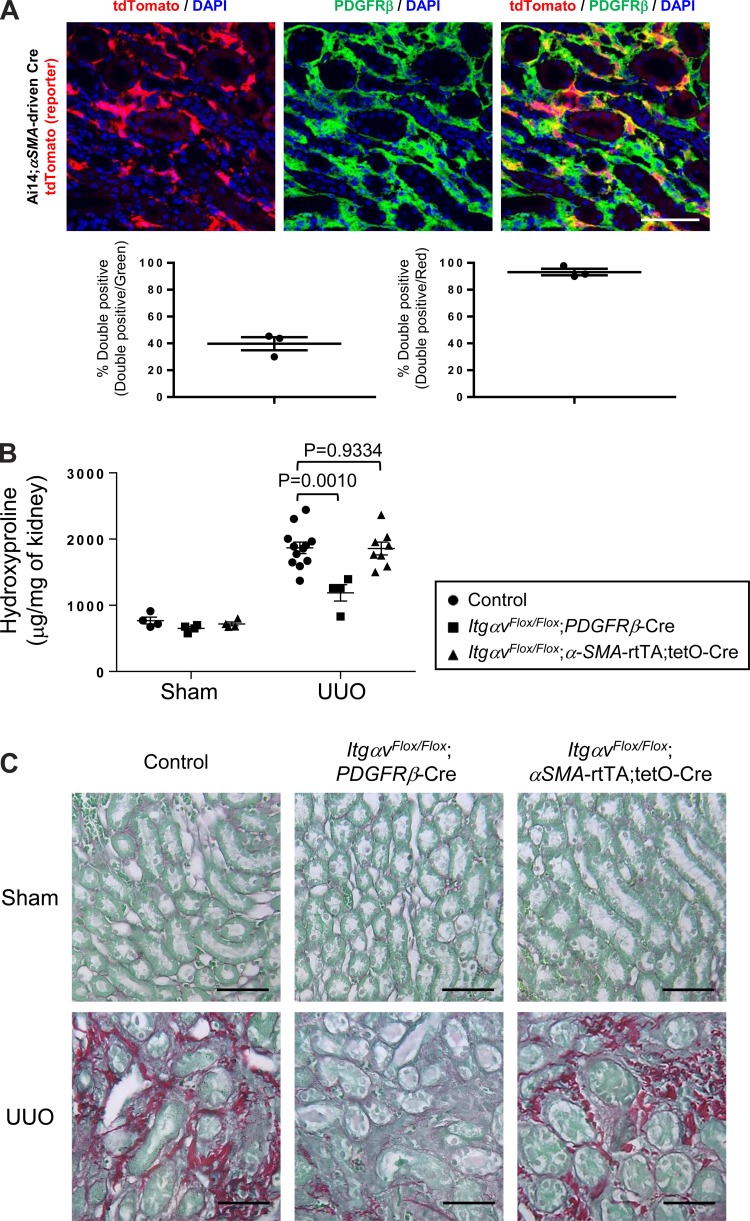
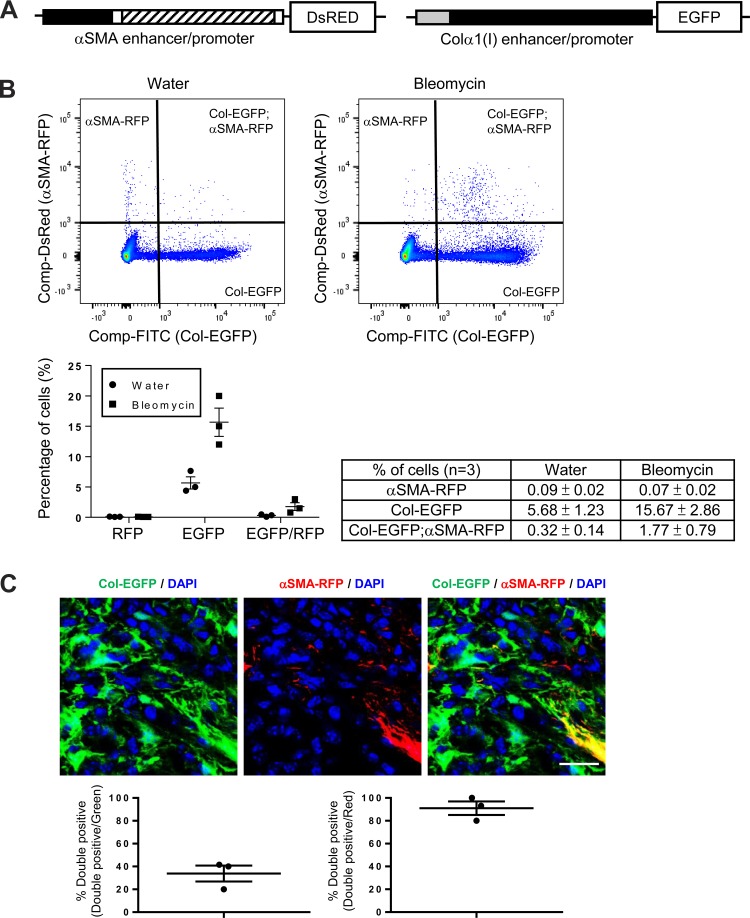
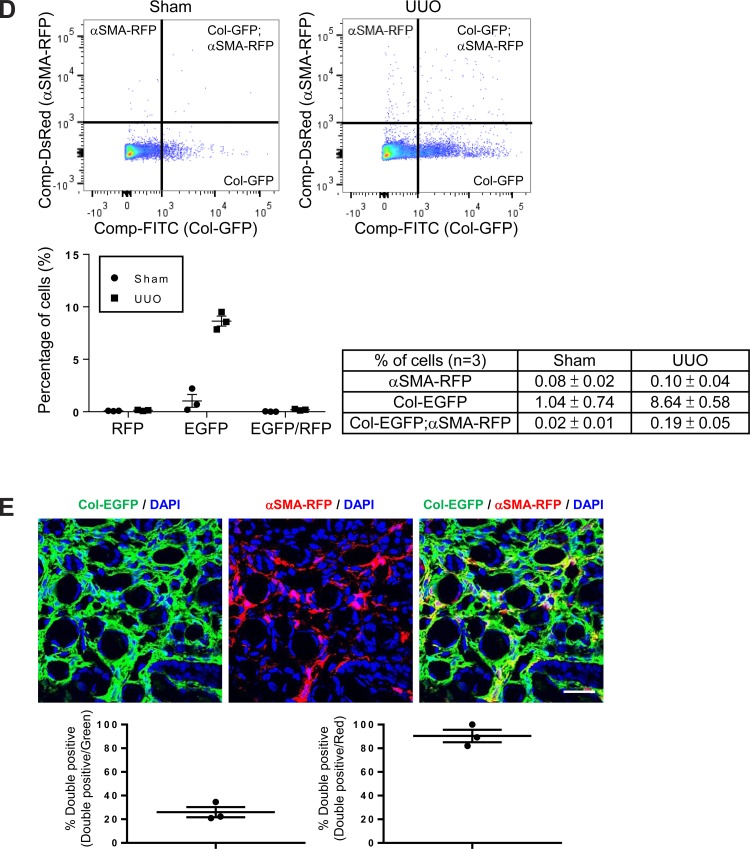
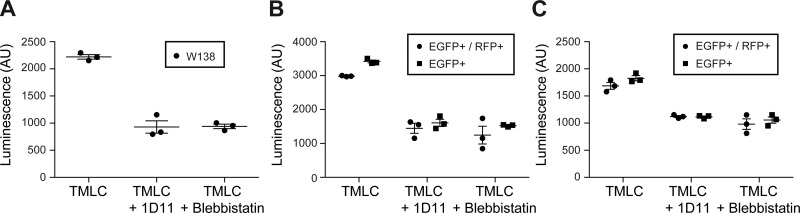
Fibrosis is a common pathological sequela of tissue injury or inflammation, and is a major cause of organ failure. Subsets of fibroblasts contribute to tissue fibrosis in multiple ways, including generating contractile force to activate integrin-bound, latent TGFβ and secreting excess amounts of collagens and other extracellular matrix proteins (ECM) that make up pathologic scar. However, the precise fibroblast subsets that drive fibrosis have been poorly understood. In the absence of well-characterized markers, α-smooth muscle actin (αSMA) is often used to identify pathologic fibroblasts, and some authors have equated αSMA(+) cells with contractile myofibroblasts and proposed that these cells are the major source of ECM. Here, we investigated how well αSMA expression describes fibroblast subsets responsible for TGFβ activation and collagen production in three commonly used models of organ fibrosis that we previously reported could be inhibited by loss of αv integrins on all fibroblasts (using PDGFRβ-Cre). Interestingly, αSMA-directed deletion of αv integrins protected mice from CCl4-induced hepatic fibrosis, but not bleomycin-induced pulmonary or unilateral ureteral obstruction-induced renal fibrosis. Using Col-EGFP/αSMA-RFP dual reporter mice, we found that only a minority of collagen-producing cells coexpress αSMA in the fibrotic lung and kidney. Notably, Col-EGFP(+)αSMA-RFP(-) cells isolated from the fibrotic lung and kidney were equally capable of activating TGFβ as were Col-EGFP(+)αSMA-RFP(+) cells from the same organ, and this TGFβ activation was blocked by a TGFβ-blocking antibody and an inhibitor of nonmuscle myosin, respectively. Taken together, our results suggest that αSMA is an inconsistent marker of contractile and collagen-producing fibroblasts in murine experimental models of organ fibrosis.

Keywords: fibrosis; integrin; αSMA.


Figures

Fig. 1.
Fig. 1.
Comparison of tdTomato expression pattern between Ai14;PDGFRβ-Cre and Ai14;αSMA-rtTA;tetO-Cre mice in normal and fibrotic lungs. A: schematic of reporter mice generated by crossing Ai14 mice (29) with either PDGFRβ-Cre (12) or αSMA-driven Cre mice (9, 37). The αSMA enhancer/promoter construct contained that consisted of ∼1 kb of the 5′-flanking region (black box), the transcription start site, the 48-bp exon 1 (white box), the ∼2.5-kb intron 1 (hatched box), and the 15-bp exon 2 (white box) from the mouse αSMA gene (49). B: immunofluorescence micrographs of 14-day water-treated lung sections from the indicated reporter mice. AW, airway; BV, blood vessel. C: immunofluorescence micrographs of 14-day bleomycin-treated lung sections from the indicated reporter mice. Panels at left show DAPI (blue), panels in middle show endogenous tdTomato (red), and panels at right show merged images. Scale bar, 100 μm.
Fig. 2.
Fig. 2.
Inappropriate PDGFRβ-Cre-directed recombination in lung airway epithelial cells. Immunofluorescence micrographs of lung sections from 14-day bleomycin-treated Ai14;PDGFRβ-Cre mice, which was costained with PDGFRβ antibody. Panel at left shows DAPI (blue) and endogenous tdTomato (i.e., PDGFRβ) (red), panel in middle shows DAPI (blue) and PDGFRβ staining (green), and panel at right shows the merged image. Scale bar, 100 μm. AW, airway. Airway epithelial cells that were targeted by PDGFRβ-Cre indicated by *.
Fig. 3.
Fig. 3.
αSMA-expressing cells are only a subpopulation of PDGFRβ-expressing cells within the fibrotic lung interstitium. A: immunofluorescence micrographs and image quantification of lung sections from 14-day bleomycin-treated Ai14;PDGFRβ-Cre mice, which were costained with αSMA antibody. Panel at left shows DAPI (blue) and endogenous tdTomato (i.e., PDGFRβ) (red), panel in middle shows DAPI (blue) and αSMA staining (green), and panel at right shows the merged image. B: immunofluorescence micrographs and image quantification of lung sections from 14-day bleomycin-treated Ai14;αSMA-rtTA;tetO-Cre mice, which were costained with PDGFRβ antibody. Panel at left shows DAPI (blue) and endogenous tdTomato (i.e., αSMA) (red), panel in middle shows DAPI (blue) and PDGFRβ staining (green), and panel at right shows the merged image. Scale bar, 50 μm.
Fig. 4.
Fig. 4.
αSMA-directed deletion of αv integrins does not confer protective effects against bleomycin-induced pulmonary fibrosis. A: schematic of either PDGFRβ-Cre- (12) or αSMA-driven Cre- (9, 37) mediated recombination of the floxed αv integrin, which leads to removal of exon 4, shift in the translational reading frame in subsequent exons, and permanent inactivation of αv integrin expression (25). B: immunoblotting of expression of αv integrins in cells targeted by PDGFRβ-Cre or αSMA-driven Cre. Mice were treated with bleomycin for 14 days, and tdTomato-positive cells were purified by fluorescence-activated cell sorting (FACS), followed by immunoblotting with anti-αv integrin antibody. C: hydroxyproline assay of lung lysates. D: picrosirius red staining of lung sections from mice treated with water (control vehicle) or bleomycin (3 U/kg) for 28 days. Data are means ± SE. P value, Student's t-test. Scale bar, 100 μm.
Fig. 5.
Fig. 5.
αSMA-directed deletion of αv integrins protects against CCl4-induced hepatic fibrosis. A: immunofluorescence micrographs and image quantification of liver sections from 3-wk CCl4-treated Ai14;αSMA-rtTA;tetO-Cre mice, costained with PDGFRβ antibody. Panel at left shows DAPI (blue) and endogenous tdTomato (i.e., αSMA) (red), panel in middle shows DAPI (blue) and PDGFRβ staining (green), and panel at right shows the merged image. Scale bar, 100 μm. B: immunoblotting of expression of αv integrins in cells targeted by PDGFRβ-Cre or αSMA-driven Cre. Mice were treated with CCl4 for 3 wk, and tdTomato-positive cells were purified by FACS, followed by immunoblotted with anti–αv integrin antibody. C: hydroxyproline assay of liver lysates. D: picrosirius red staining of liver from mice treated with olive oil (control vehicle) or CCl4 twice a week for 6 wk. Data are means ± SE. P value, Student's t-test. Scale bar, 200 μm.
Fig. 6.
Fig. 6.
αSMA-directed deletion of αv integrins does not confer protective effects against unilateral ureteral obstruction (UUO) induced renal fibrosis. A: immunofluorescence micrographs and image quantification of kidney sections from 7-day UUO-treated Ai14;αSMA-rtTA;tetO-Cre mice, costained with PDGFRβ antibody. Panel at left shows DAPI (blue) and endogenous tdTomato (i.e., αSMA) (red), panel in middle shows DAPI (blue) and PDGFRβ staining (green), and panel at right shows the merged image. Scale bar, 50 μm. B: hydroxyproline assay of kidney lysates. C: picrosirius red staining of kidney sections from mice that underwent UUO or sham operation (control) on their left kidneys for 14 days. Data are means ± SE. P value, Student's t-test. Scale bar, 50 μm.
Fig. 7.
Fig. 7.
Only a minority of collagen-producing cells coexpress αSMA in the fibrotic lung and kidney. A: schematic of αSMA-RFP (30, 49) and Col-EGFP (30, 52) reporter mice. The αSMA enhancer/promoter construct consists ∼1-kb 5′-flanking region (black box), the transcription start site, the 48-bp exon 1 (white box), the ∼2.5-kb intron 1 (hatched box), and the 15-bp exon 2 (white box) (30, 49) from the mouse αSMA gene. The Colα1(I) enhancer/promoter contains an enhancer fragment, 5′-deoxyribonuclease (DNase) I-hypersensitive sites (HS) 4.5, followed by the ∼3-kb mouse Colα1(I) gene promoter (30, 52). B: flow cytometry–based quantification of cells isolated from the lungs of 14-day water- or bleomycin-treated Col-EGFP/αSMA-RFP mice. Data were collected from three mice. Representative dot plots are shown. Data are means ± SE. C: immunofluorescence micrographs and image quantification of lung sections from 14-day bleomycin-treated Col-EGFP/αSMA-RFP mice, costained with GFP and RFP antibodies to enhance the endogenous Col-EGFP and αSMA-RFP signals for microscopic imaging. Panel at left shows DAPI (blue) and Col-GFP (green), panel in middle shows DAPI (blue) and αSMA-RFP (red), and panel at right shows the merged image. Scale bar, 50 μm. D: flow cytometry-based quantification of cells isolated from the kidneys of 7-day sham- or UUO-treated Col-EGFP/αSMA-RFP mice. Data were collected from three mice. Representative dot plots are shown. Data are means ± SE. E: immunofluorescence micrographs and image quantification of kidney sections from 7-day UUO-treated Col-EGFP/αSMA-RFP mice, costained with GFP and RFP antibodies as above. Panel at left shows DAPI (blue) and Col-EGFP (green), panel in middle shows DAPI (blue) and αSMA-RFP (red), and panel at right shows the merged image. Scale bar, 50 μm.
Fig. 7.
Fig. 7.
Only a minority of collagen-producing cells coexpress αSMA in the fibrotic lung and kidney. A: schematic of αSMA-RFP (30, 49) and Col-EGFP (30, 52) reporter mice. The αSMA enhancer/promoter construct consists ∼1-kb 5′-flanking region (black box), the transcription start site, the 48-bp exon 1 (white box), the ∼2.5-kb intron 1 (hatched box), and the 15-bp exon 2 (white box) (30, 49) from the mouse αSMA gene. The Colα1(I) enhancer/promoter contains an enhancer fragment, 5′-deoxyribonuclease (DNase) I-hypersensitive sites (HS) 4.5, followed by the ∼3-kb mouse Colα1(I) gene promoter (30, 52). B: flow cytometry–based quantification of cells isolated from the lungs of 14-day water- or bleomycin-treated Col-EGFP/αSMA-RFP mice. Data were collected from three mice. Representative dot plots are shown. Data are means ± SE. C: immunofluorescence micrographs and image quantification of lung sections from 14-day bleomycin-treated Col-EGFP/αSMA-RFP mice, costained with GFP and RFP antibodies to enhance the endogenous Col-EGFP and αSMA-RFP signals for microscopic imaging. Panel at left shows DAPI (blue) and Col-GFP (green), panel in middle shows DAPI (blue) and αSMA-RFP (red), and panel at right shows the merged image. Scale bar, 50 μm. D: flow cytometry-based quantification of cells isolated from the kidneys of 7-day sham- or UUO-treated Col-EGFP/αSMA-RFP mice. Data were collected from three mice. Representative dot plots are shown. Data are means ± SE. E: immunofluorescence micrographs and image quantification of kidney sections from 7-day UUO-treated Col-EGFP/αSMA-RFP mice, costained with GFP and RFP antibodies as above. Panel at left shows DAPI (blue) and Col-EGFP (green), panel in middle shows DAPI (blue) and αSMA-RFP (red), and panel at right shows the merged image. Scale bar, 50 μm.
Fig. 8.
Fig. 8.
Col-EGFP+αSMA-RFP cells isolated from lung or kidney are equally capable of inducing TGFβ activation as Col-EGFP+αSMA-RFP+ cells. A: TGFβ activation assay of WI-38 cells. TGFβ activation assay of indicated cells sorted from fibrotic lungs (B) or fibrotic kidneys (C) of Col-EGFP/αSMA-RFP mice in the presence of indicated reagents. Col-EGFP/αSMA-RFP mice were treated with bleomycin for 14 days or UUO for 7 days. Following tissue disassociation, Col-EGFP+αSMA-RFP cells (EGFP+) and Col-EGFP+αSMA-RFP+ cells (EGFP+/RFP+) were sorted by FACS and used in coculture TGFβ activation assays with mink lung epithelial cells stably transfected with a TGFβ-sensitive portion of the PAI-1 promoter driving firefly luciferase expression. TGFβ activation is expressed as luminescence. Data are means ± SE.

Similar articles

Cited by

References

    1. Abe M, Harpel JG, Metz CN, Nunes I, Loskutoff DJ, Rifkin DB. An assay for transforming growth factor-beta using cells transfected with a plasminogen activator inhibitor-1 promoter-luciferase construct. Anal Biochem 216: 276–284, 1994. - PubMed
    1. Adler KB, Low RB, Leslie KO, Mitchell J, Evans JN. Contractile cells in normal and fibrotic lung. Lab Invest 60: 473–485, 1989. - PubMed
    1. Aluwihare P, Mu Z, Zhao Z, Yu D, Weinreb PH, Horan GS, Violette SM, Munger JS. Mice that lack activity of alphavbeta6- and alphavbeta8-integrins reproduce the abnormalities of Tgfb1- and Tgfb3-null mice. J Cell Sci 122: 227–232, 2009. - PMC - PubMed
    1. Annes JP, Chen Y, Munger JS, Rifkin DB. Integrin alphaVbeta6-mediated activation of latent TGF-beta requires the latent TGF-beta binding protein-1. J Cell Biol 165: 723–734, 2004. - PMC - PubMed
    1. Annes JP, Rifkin DB, Munger JS. The integrin alphaVbeta6 binds and activates latent TGFbeta3. FEBS Lett 511: 65–68, 2002. - PubMed

Publication types

LinkOut - more resources