. 2016 Mar 15;44(3):597-608.
doi: 10.1016/j.immuni.2016.02.004. Epub 2016 Mar 2.

The Vaccine Adjuvant Chitosan Promotes Cellular Immunity via DNA Sensor cGAS-STING-Dependent Induction of Type I Interferons

Affiliations

The Vaccine Adjuvant Chitosan Promotes Cellular Immunity via DNA Sensor cGAS-STING-Dependent Induction of Type I Interferons

Elizabeth C Carroll et al. Immunity. .

Abstract

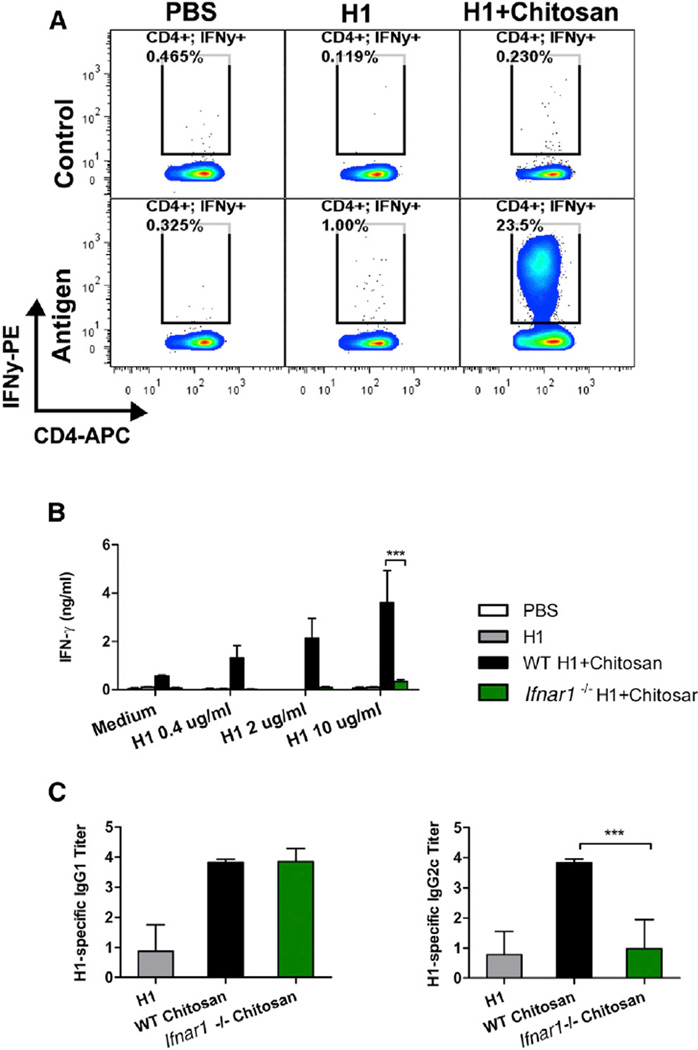
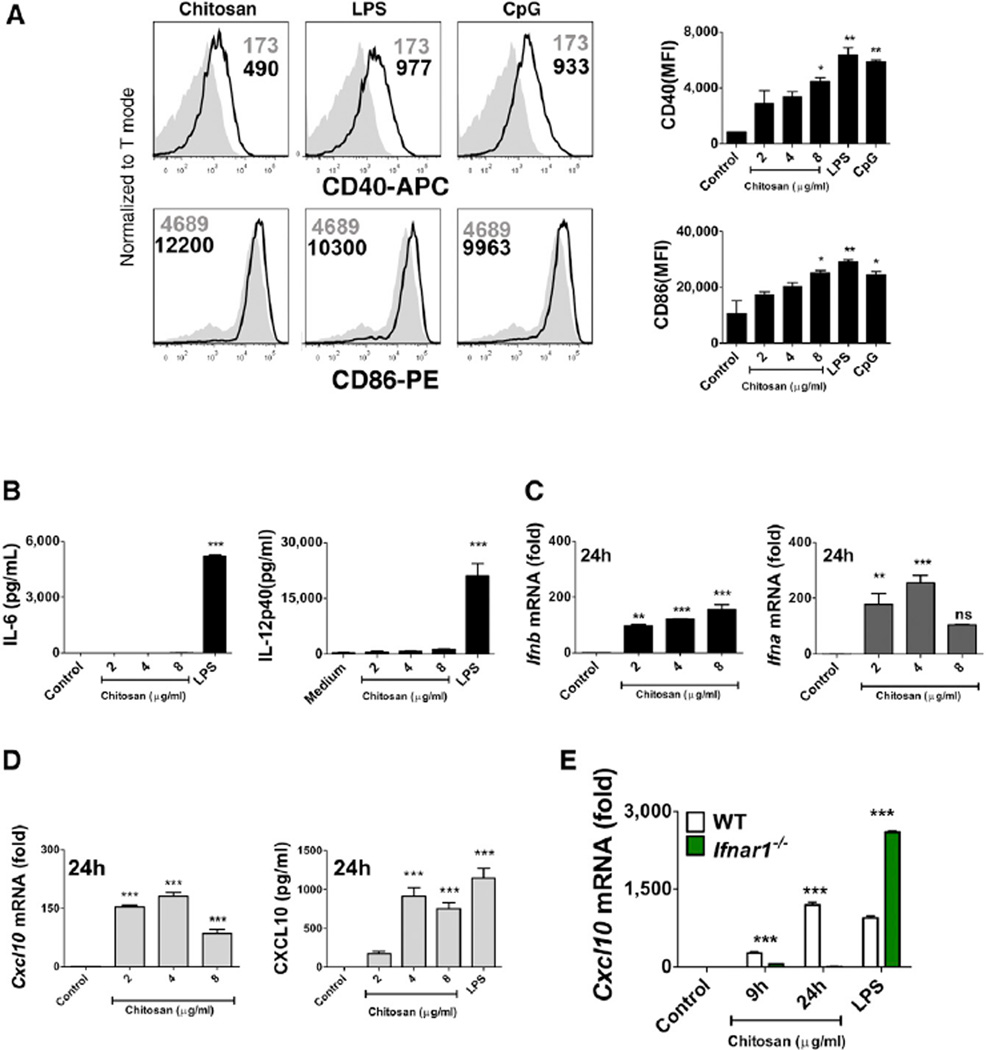
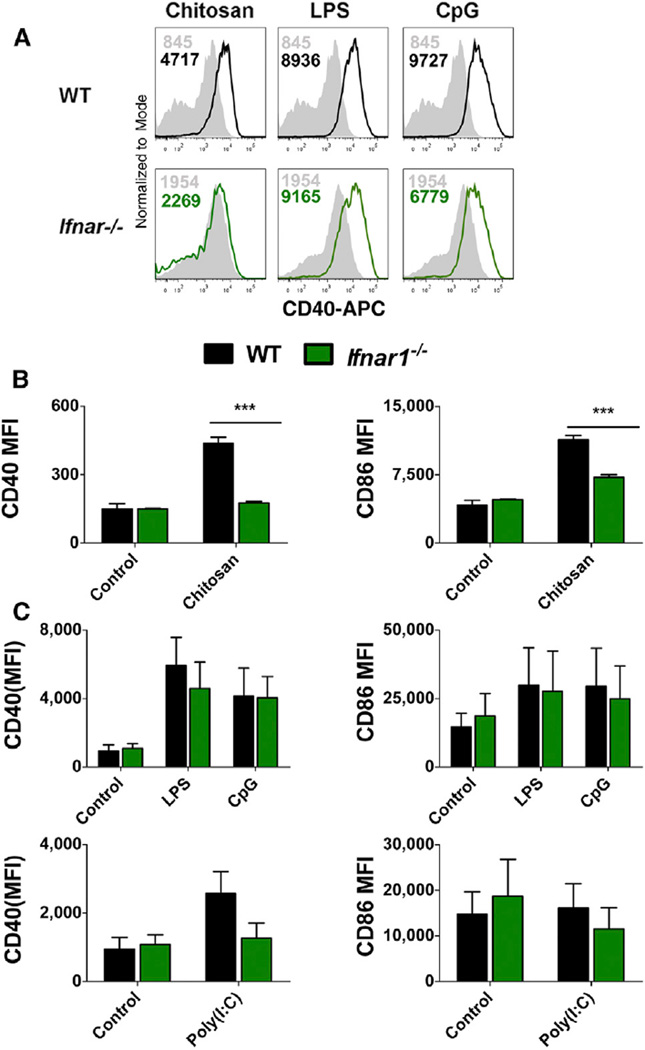
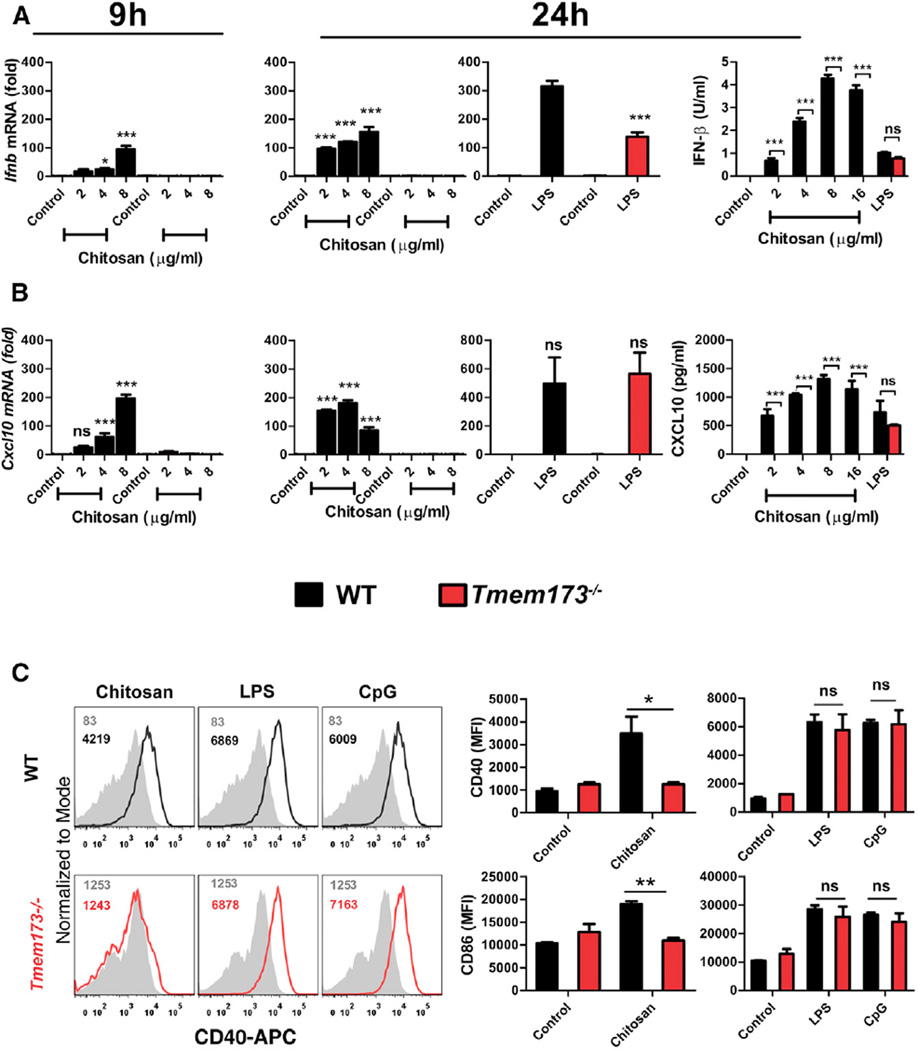
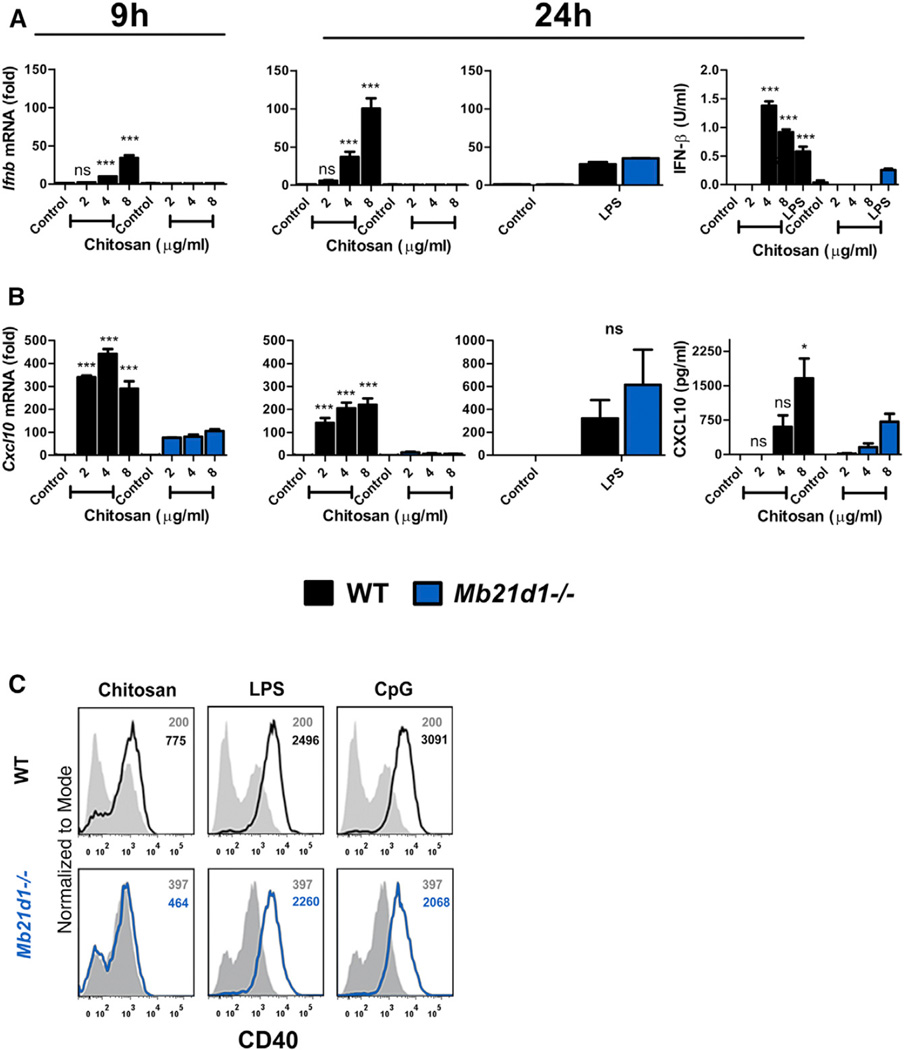
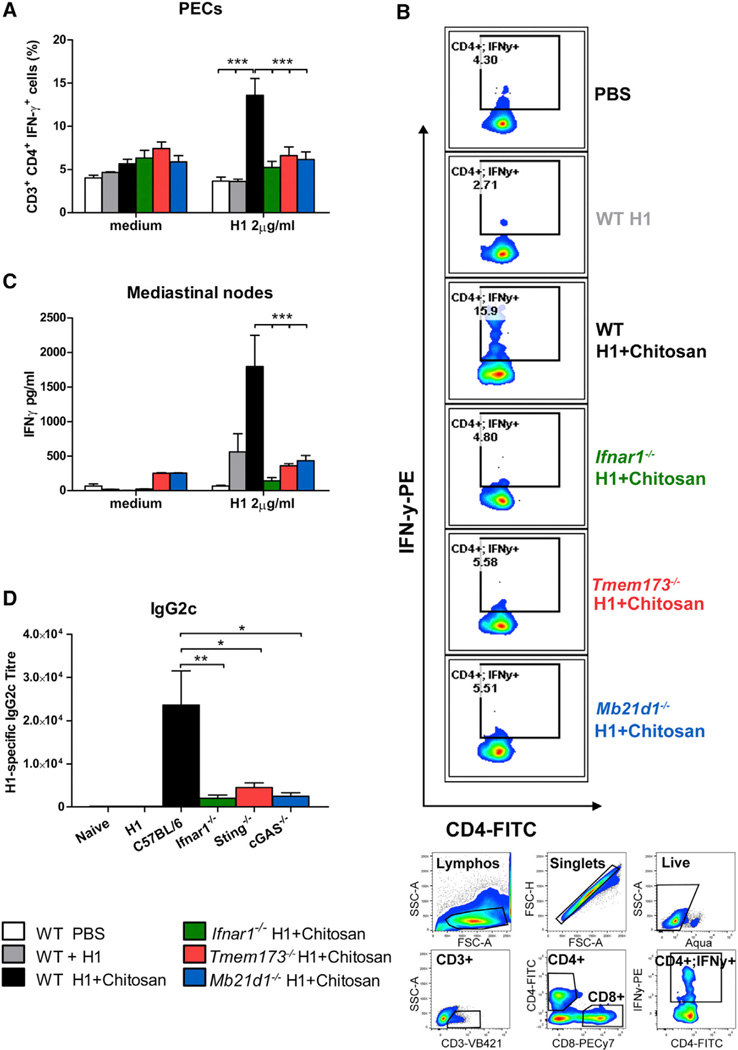
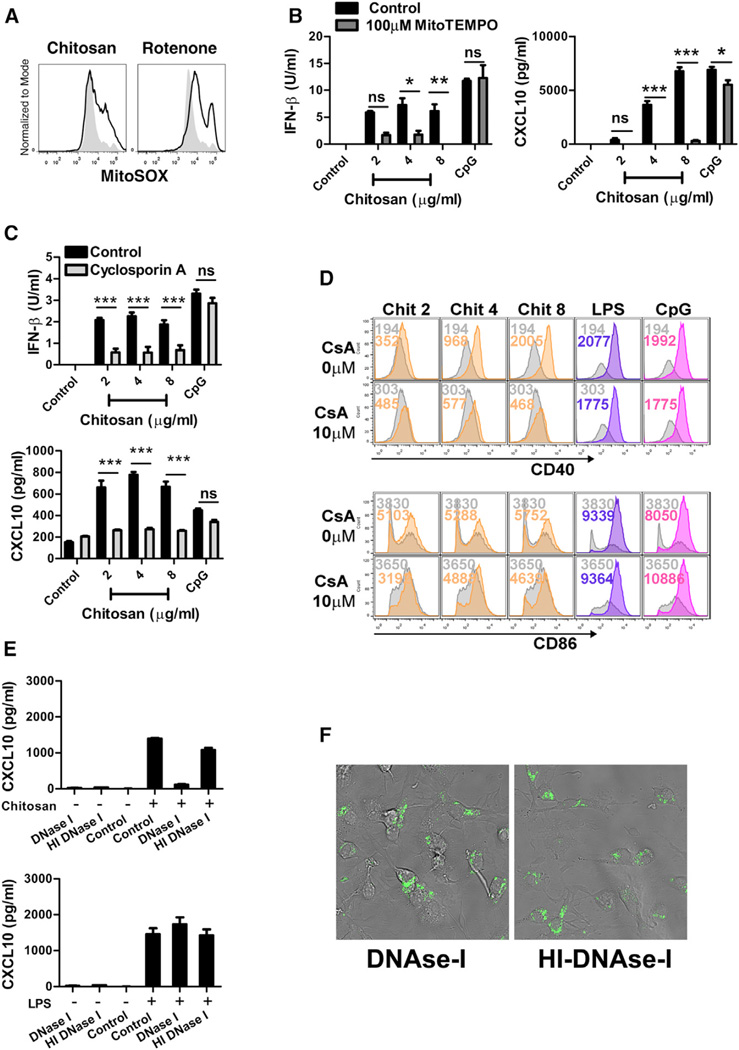
The cationic polysaccharide chitosan is an attractive candidate adjuvant capable of driving potent cell-mediated immunity, but the mechanism by which it acts is not clear. We show that chitosan promotes dendritic cell maturation by inducing type I interferons (IFNs) and enhances antigen-specific T helper 1 (Th1) responses in a type I IFN receptor-dependent manner. The induction of type I IFNs, IFN-stimulated genes and dendritic cell maturation by chitosan required the cytoplasmic DNA sensor cGAS and STING, implicating this pathway in dendritic cell activation. Additionally, this process was dependent on mitochondrial reactive oxygen species and the presence of cytoplasmic DNA. Chitosan-mediated enhancement of antigen specific Th1 and immunoglobulin G2c responses following vaccination was dependent on both cGAS and STING. These findings demonstrate that a cationic polymer can engage the STING-cGAS pathway to trigger innate and adaptive immune responses.


Figures

Figure 1
Figure 1. Chitosan Promotes Robust IFNAR-Dependent Th1 Responses and IgG2c Production
(A) H1-specific IFN-γ production by CD4+ T cells in PECs of WT mice after vaccination with H1 alone or in combination with chitosan. Results are shown as representative dot plots or bar graphs. (B) Antigen-specific IFN-γ production in mLNs isolated from WT and Ifnar1−/− mice immunized with H1 alone or with chitosan. (C) H1-specific IgG1 and IgG2c in serum of WT and Ifnar1−/− mice immunized with H1 alone or with chitosan. Data shown as mean ± SEM of three independent experiments, n = 5 per group. WT versus Ifnar1−/−, ***p < 0.001. See also Figure S1.
Figure 2
Figure 2. Chitosan Induces DC Maturation and Type I IFN Signaling in the Absence of Proinflammatory Cytokine Production
(A) CD40 and CD86 expression in WT DCs incubated for 24 hr with medium (shaded histogram), chitosan (8 µg/ml), LPS, or CpG (black line). Data are represented as mean ± SEM of MFI values representative of three independent experiments. (B) IL-6 and IL-12p40 in supernatants of DCs incubated with indicated concentrations of chitosan or LPS for 24 hr. (C) qPCR analysis of Ifnb and Ifna. mRNA expression by DCs stimulated for the indicated times with chitosan. (D) Cxcl10 mRNA expression and CXCL10 secreted into the supernatant of DCs incubated with chitosan or LPS for 24 hr. (E) qPCR analysis of Cxcl10 mRNA expression in WT (black bars) and Ifnar1−/− DCs (green bars) incubated with chitosan for the indicated time points and LPS for 4 hr. mRNA levels calculated with respect to β-actin and fold increase calculated relative to untreated cells. Results are expressed as the mean ± SEM. Asterisks represent significant differences for *p < 0.05, **p < 0.01, ***p < 0.001 for medium versus treated in (A), and, WT versus Ifnar1−/− in (B)–(D).
Figure 3
Figure 3. Chitosan Induced Upregulation of CD40 and CD86 on DCs Is Compromised in the Absence of Type I IFN Receptor Signaling
(A) CD40 expression in WT (black) or Ifnar1−/− (green) DCs unstimulated (shaded histogram) or stimulated with chitosan (8 µg/ml), LPS, or CpG for 24 hr. (B) CD40 and CD86 expression in WT or Ifnar1−/− DCs stimulated with chitosan and represented as MFI values. (C) CD40 and CD86 expression in WT or Ifnar1−/− DCs stimulated with medium, LPS, or CpG and represented as MFI values. Results expressed as mean ± SEM of three independent experiments. WT versus Ifnar1−/−, ***p < 0.001.
Figure 4
Figure 4. STING Is Required for Chitosan-Induced Type I IFN Responses and Maturation of DCs
mRNA expression (9 and 24 hr) and protein levels (24 hr) of (A) IFN-β or (B) CXCL10 produced by WT (black) or Tmem173−/− (red) DCs stimulated with chitosan or LPS. RNA levels were calculated with respect to Actb and results are presented as fold increase compared to untreated cells. (C) CD40 and CD86 expression on WT and Tmem173−/− DCs which were either untreated (shaded histogram) or stimulated with chitosan (8 µg/ml), LPS or CpG. Numbers indicate MFI values. Results are expressed as the mean ± SEM of two independent experiments. Asterisks indicate *p < 0.05, **p < 0.01, ***p < 0.001. See also Figure S3.
Figure 5
Figure 5. Chitosan-Induced DC Maturation and Type I IFN Production Requires cGAS
(A) qPCR analysis of Ifnb mRNA expression by WT (black) or Mb21d1−/− (blue) DCs which were either untreated or stimulated with chitosan or LPS for 9 or 24 hr. (B) Transcript (9 and 24 hr) and protein (24 hr) levels for CXCL10 in WT and Mb21d1−/− DCs after treatment with chitosan or LPS. mRNA levels were normalized with respect to Actb and results are presented as fold increase compared to untreated cells. Data are shown as mean ± SEM for triplicate samples. Results are representative of two independent experiments. WT versus Mb21d1−/−, *p < 0.05, ***p < 0.001. (C) Representative histograms for CD40 expression on WT and Mb21d1−/− DCs which were either untreated (shaded) or stimulated (solid lines) with chitosan (8 µg/ml), LPS, or CpG.
Figure 6
Figure 6. Chitosan Promotes cGAS-STING-IFNAR1-Dependent Th1 Responses and IgG2c Production
(A) H1-specific intracellular IFN-γ production in CD3+CD4+ isolated from PECs of WT (white, PBS; gray, antigen alone; black, antigen+adjuvant), Ifnar1−/− (green), Tmem173−/− (red), and Mb21d1−/− (blue) mice immunized with H1 alone or in combination with chitosan. (B) Representative dot plots showing levels of H1 specific intracellular IFN-γ in CD3+CD4+ (upper panel). Gating strategy used for analysis of intracellular IFN-γ production (lower panel). (C) Antigen-specific IFN-γ production in mLNs isolated from WT, Ifnar1−/−, Tmem173−/−, and Mb21d1−/− mice immunized with H1 alone or with chitosan. (D) H1-specific IgG2c in serum of WT, Ifnar1−/−, Tmem173−/−, and Mb21d1−/− mice immunized with H1 alone or with chitosan. Representative of two independent experiments for WT, Ifnar1−/−, Tmem173−/−, and one experiment for WT, Ifnar1−/−, Tmem173−/−, and Mb21d1−/−, n = 5 per group. Data shown as mean ± SEM. WT versus Ifnar1−/−, WT versus Tmem173−/−, WT versus Mb21d1−/−,*p < 0.05, ***p < 0.001. See also Figure S7.
Figure 7
Figure 7. Chitosan Induces Mitochondrial Damage, Characterized by the Generation of Mitochondrial-Derived ROS and Release of DNA into the Cytosol
(A) DCs left untreated (control, shaded) or treated with chitosan (4 µg/ml, black line) for 3 hr stained with MitoSOX. As a positive control cells treated with rotenone (5 µM) for 6 hr were used. (B) IFN-β and CXCL10 in supernatants of WT DCs treated for 24 hr with chitosan or CpG in the presence (dark gray) or absence (black) of Mito-TEMPO (500 µM). (C) IFN-β and CXCL10 in supernatants of WT DCs treated for 24 hr or 16 hr with chitosan or CpG in the presence (light gray) or absence (black) of CsA (20 µM). (D) CD40 and CD86 expression in WT DCs stimulated with chitosan (orange), LPS (violet) or CpG (pink) or left unstimulated (gray) in the presence or absence of CsA (10 µM); colored numbers indicate MFI values for the corresponding treatment. (E) CXCL10 in supernatants of DCs incubated for 24 hr after delivery of 1.5 µg DNase I or HI-DNase I into the cytosol, followed by stimulation with chitosan or LPS. (F) Representative confocal micrograph showing DCs transfected with fluorescent DNase I (left panel) or heat inactivated DNase I (right panel). Data are shown as mean ± SEM for triplicate samples. Results are representative of two independent experiments. Adjuvant (control) versus adjuvant (MitoTEMPO/CsA/DNase I), *p < 0.05, **p < 0.01, ***p < 0.001.

Comment in

References

    1. Agger EM, Cassidy JP, Brady J, Korsholm KS, Vingsbo-Lundberg C, Andersen P. Adjuvant modulation of the cytokine balance in Mycobacterium tuberculosis subunit vaccines; immunity, pathology and protection. Immunology. 2008;124:175–185. - PMC - PubMed
    1. Blaauboer SM, Mansouri S, Tucker HR, Wang HL, Gabrielle VD, Jin L. The mucosal adjuvant cyclic di-GMP enhances antigen uptake and selectively activates pinocytosis-efficient cells in vivo. eLife. 2015;4:1–25. - PMC - PubMed
    1. Bossie A, Vitetta ES. IFN-γ enhances secretion of IgG2a from IgG2a-committed LPS-stimulated murine B cells: implications for the role of IFN-γ in class switching. Cell. Immunol. 1991;135:95–104. - PubMed
    1. Brewer JM, Conacher M, Hunter CA, Mohrs M, Brombacher F, Alexander J. Aluminium hydroxide adjuvant initiates strong antigen-specific Th2 responses in the absence of IL-4- or IL-13-mediated signaling. J. Immunol. 1999;163:6448–6454. - PubMed
    1. Bueter CL, Lee CK, Rathinam VA, Healy GJ, Taron CH, Specht CA, Levitz SM. Chitosan but not chitin activates the inflammasome by a mechanism dependent upon phagocytosis. J. Biol. Chem. 2011;286:35447–35455. - PMC - PubMed

Publication types

MeSH terms