. 2016 May 6;291(19):10318-31.
doi: 10.1074/jbc.M115.707489. Epub 2016 Mar 4.

The Most Prevalent Freeman-Sheldon Syndrome Mutations in the Embryonic Myosin Motor Share Functional Defects

Affiliations

The Most Prevalent Freeman-Sheldon Syndrome Mutations in the Embryonic Myosin Motor Share Functional Defects

Jonathan Walklate et al. J Biol Chem. .

Abstract

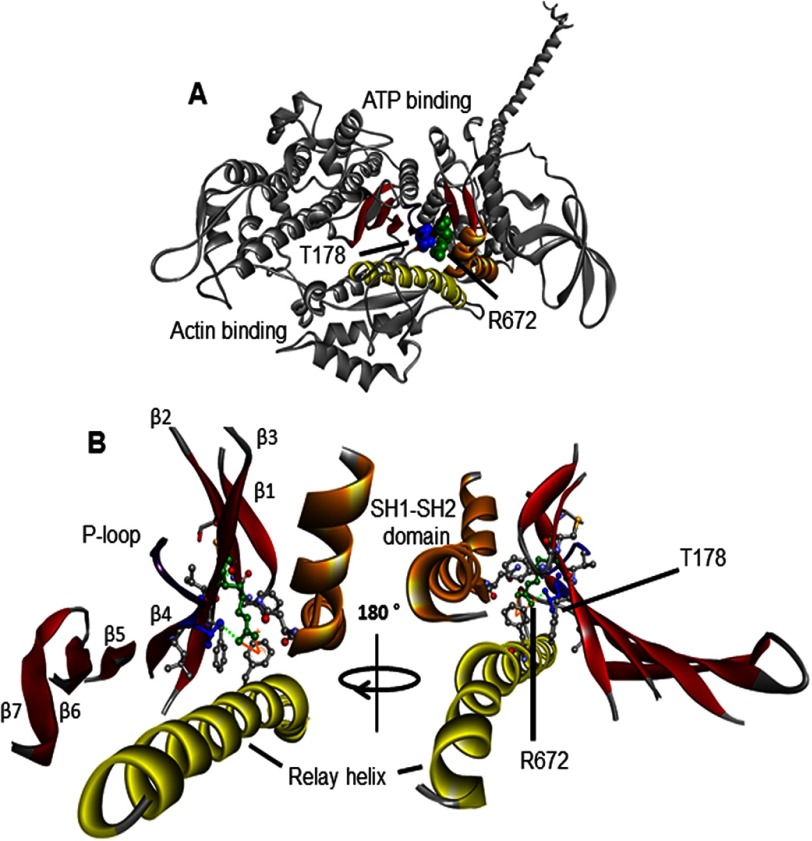
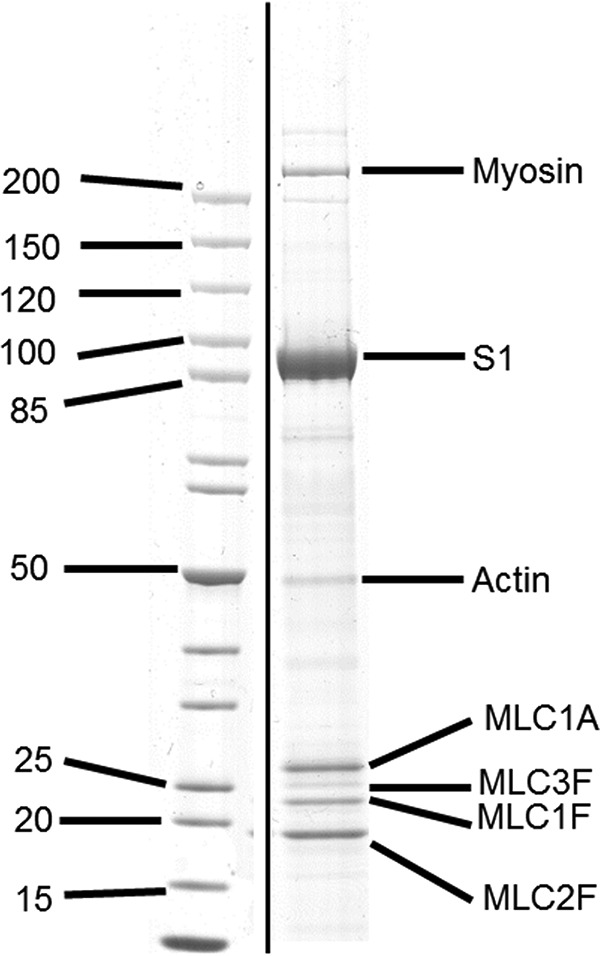
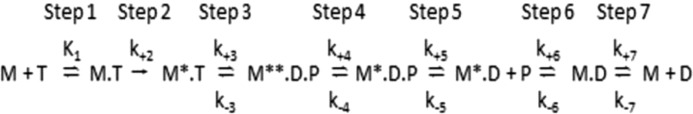
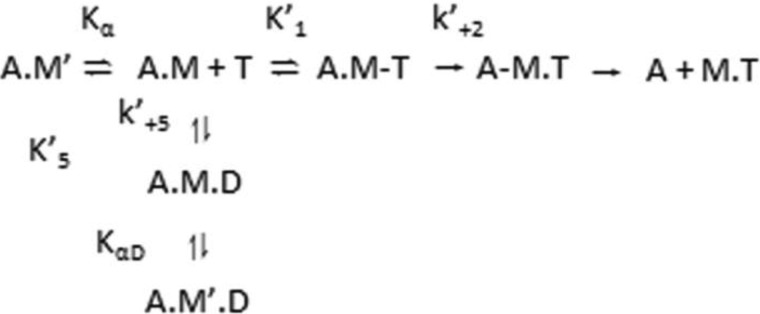
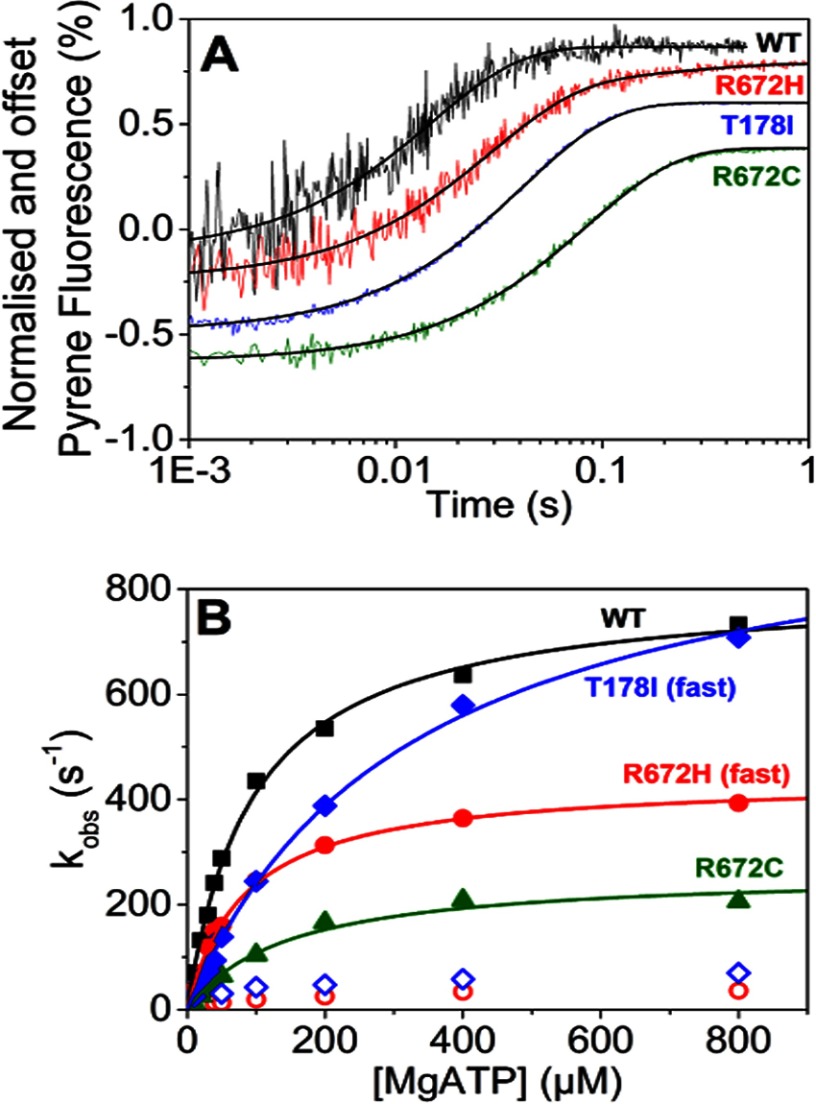
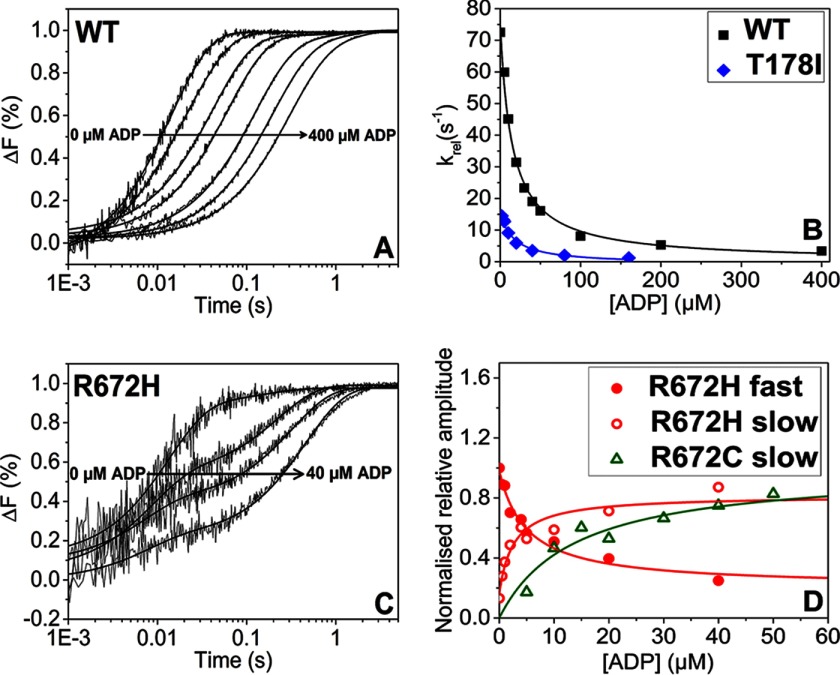
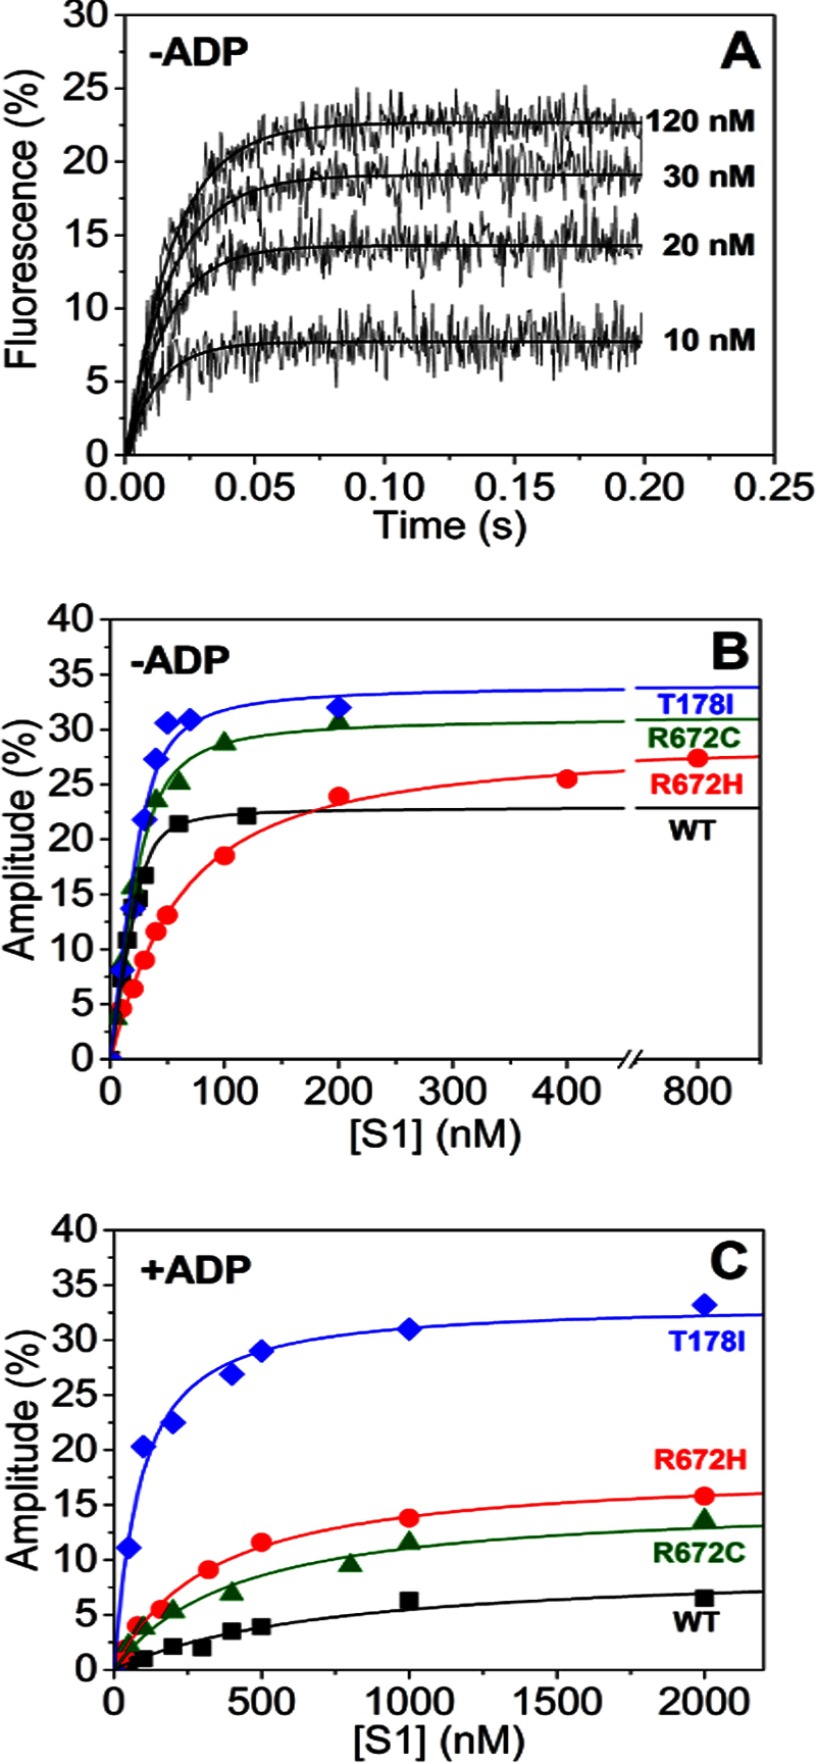
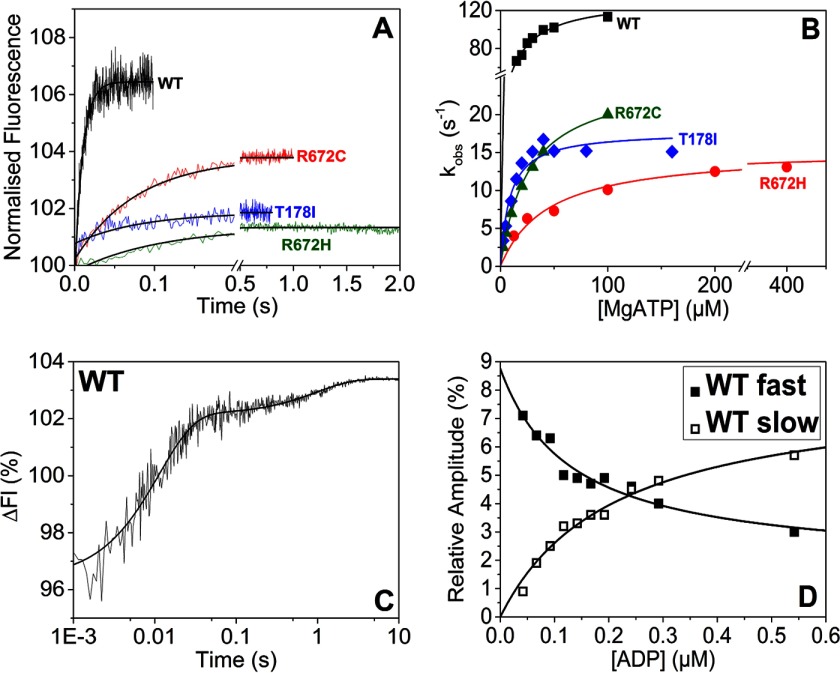
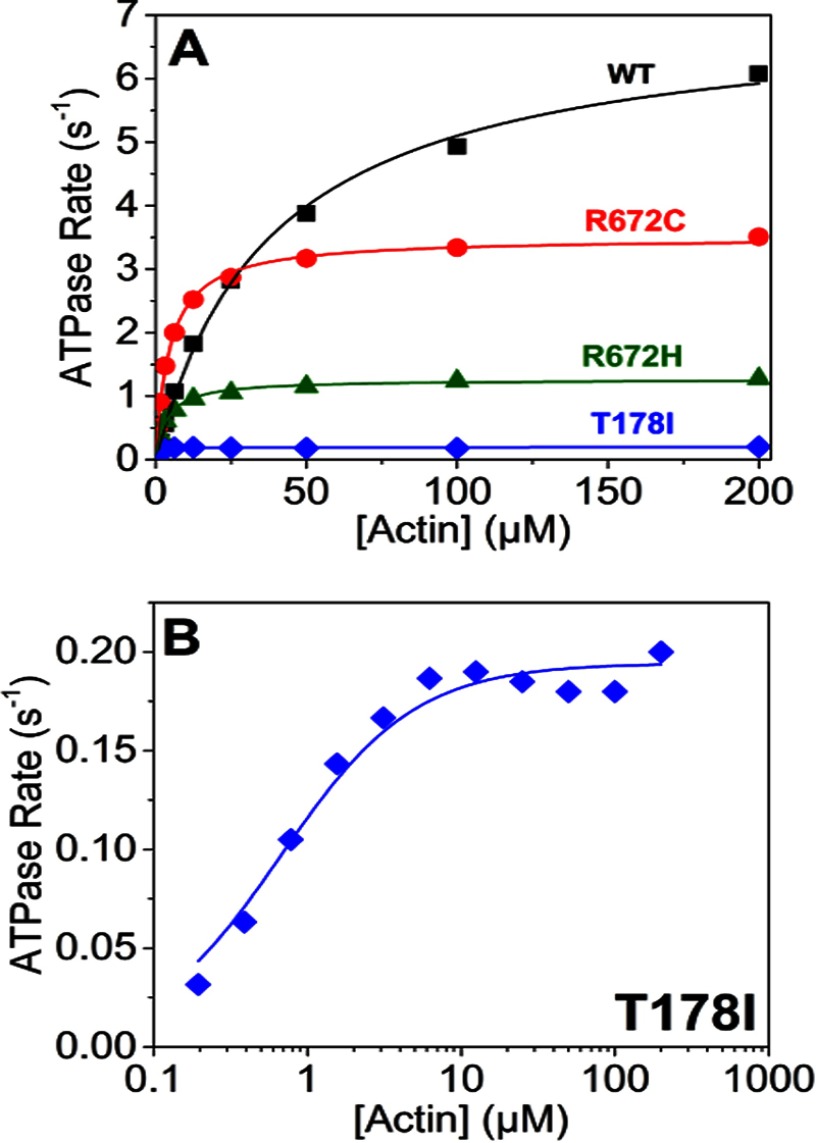
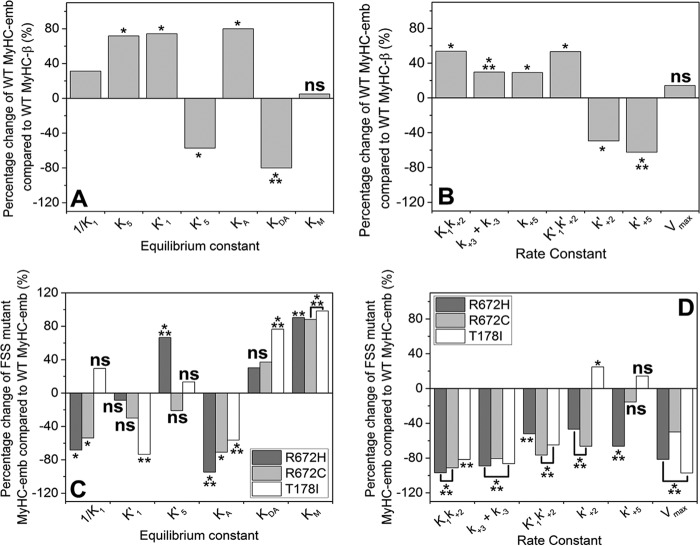
The embryonic myosin isoform is expressed during fetal development and rapidly down-regulated after birth. Freeman-Sheldon syndrome (FSS) is a disease associated with missense mutations in the motor domain of this myosin. It is the most severe form of distal arthrogryposis, leading to overcontraction of the hands, feet, and orofacial muscles and other joints of the body. Availability of human embryonic muscle tissue has been a limiting factor in investigating the properties of this isoform and its mutations. Using a recombinant expression system, we have studied homogeneous samples of human motors for the WT and three of the most common FSS mutants: R672H, R672C, and T178I. Our data suggest that the WT embryonic myosin motor is similar in contractile speed to the slow type I/β cardiac based on the rate constant for ADP release and ADP affinity for actin-myosin. All three FSS mutations show dramatic changes in kinetic properties, most notably the slowing of the apparent ATP hydrolysis step (reduced 5-9-fold), leading to a longer lived detached state and a slowed Vmax of the ATPase (2-35-fold), indicating a slower cycling time. These mutations therefore seriously disrupt myosin function.

Keywords: ATPase; enzyme kinetics; human myosin; molecular motor; muscle disease; myosin subfragment 1; recombinant protein expression; skeletal muscle; transient kinetics.


Figures

FIGURE 1.
FIGURE 1.
Homology model of embryonic myosin S1. This ribbon structure is based on the scallop structure in the pre-power stroke conformation (PDB code 1QVI). A, the myosin heavy chain is shown in gray, the SH1-SH2 helices in orange, the relay helix in yellow, the P-loop in purple, and the seven-stranded β-sheet in red. The arginine 672 (R672) and threonine 178 (T178) residues are shown in green and blue space filling mode, respectively. Both of these residues are highly conserved across species and myosin isoforms, including the scallop myosin and human MyHC-emb. Both residues are in the center of the S1 domain located in the upper 50-kDa domain near the ATP binding cleft. B, enlargement of the region around Arg672 (located on the third β-strand) and Thr178 on the fourth β-strand of the seven-stranded β-sheet that runs through the S1 domain. Thr178 is also at the base of the P-loop (GESGAG, residues 179–184), which is involved in ATP binding. The green dotted line represents hydrogen bonds that can be seen between Thr178 and Arg672, whereas the solid orange line indicates a π-cation bond that can be seen between Arg672 and Phe490. The interactions of Arg672 and Thr178 are summarized in Tables 2 and 3. Residues not labeled are those found to interact with either Arg672, Thr178, or both and are summarized in Tables 2 and 3.
FIGURE 2.
FIGURE 2.
SDS-PAGE of purified wild type embryonic S1. The myosin S1 co-purifies with a small amount of endogenous mouse full-length myosin (<5% by weight) and the four mouse light chains: three major bands (MLC2F (regulatory), MLC1F, and MLC1A (both essential)) and a minor band (MLC3F). The three major bands have been identified in embryonic S1 (25), suggesting that the fourth light chain (MLC3F) is binding to the endogenous myosin.
SCHEME 1.
SCHEME 1.
Seven-step scheme of ATP binding to myosin.
SCHEME. 2.
SCHEME. 2.
ATP or ADP binding to actomyosin leading to the dissociation of myosin from actin.
FIGURE 3.
FIGURE 3.
ATP-induced dissociation of embryonic S1 from pyrene-labeled actin. A, traces of 50 nm WT emb-S1 and the three mutants preincubated with equimolar pyrene-labeled actin and then rapidly mixed with 10 μm ATP. Each trace has been normalized and offset by the previous one by 0.2% fluorescence. At 10 μm ATP, WT MyHC-emb, R672C, and T178I were best described by a single exponential fit resulting in a kobs = 70 s−1 (amplitude = 27%), 12 s−1 (amplitude = 46%), and 24 s−1 (amplitude = 45%) for WT MyHC-emb, R672C, and T178I, respectively. R672H was best described by a double exponential resulting in a fast and slow phase, giving kobs = 36 s−1 (amplitude = 32%) and kobs = 4.4 s−1 (amplitude = 3.8%), respectively. At all [ATP], WT and R672C were best described by a single exponential, as was T178I at [ATP] <50 μm. At ≥50 μm ATP, the T178I mutation was best described by a double exponential, whereas the R672H had a double exponential transient at all [ATP]. B, the dependence of kobs on [ATP] yielded K1k+2 = 8.5, 5.2, 1.8, and 3.1 μm−1 s−1 for WT MyHC-emb (black filled squares), R672H (red filled circles), R672C (green filled triangles), and T178I (blue filled diamonds). The maximum rate yielded a k+2 = 806 s−1 for WT MyHC-emb; 439 and 36 s−1 for the R672H fast and slow (red open circles) phases, respectively; 262 s−1 for R672C; and 1007 and 49 s−1 for the T178I fast and slow (blue open diamonds) phases, respectively. Values given here are for a single assay.
FIGURE 4.
FIGURE 4.
ADP affinity for pyrene-labeled actin-S1. A, fluorescent traces of 50 nm pyrene-labeled actin preincubated with 50 nm WT MyHC-emb and increasing [ADP] (0–400 μm) rapidly mixed with 10 μm ATP. As the [ADP] increased, the kobs decreased from 72 to 3 s−1. B, the dependence of kobs on [ADP] for WT MyHC-emb (squares) and T178I (circles), resulting in a K5 = 16 ± 1.5 and 17 ± 4 μm, respectively. C, traces of 50 nm pyrene-actin preincubated with 50 nm R672H S1 and increasing [ADP] (0–40 μm) rapidly mixed with 30 μm ATP. Because there was a consistent slow phase even at low [ATP], the rates stayed constant while the amplitude of the fast phase decreased from 26 to 6% and the slow phase amplitude increased from 3.5 to 21%. This behavior was also seen in the R672C mutation. D, dependence of fluorescence amplitude of [ADP] for R672H and R672C. K5 = 2.6 ± 1.1 μm for the fast phase and K5 = 5 ± 1.3 μm for the slow phase for R672H. K5 = 16.3 ± 3.6 μm for the fast phase (not shown) and 13.6 ± 2.6 μm for the slow phase.
FIGURE 5.
FIGURE 5.
Embryonic S1 affinity for actin in the absence and presence of ADP. A, traces of increasing concentrations (0 μm to 120 nm) of WT MyHC-emb preincubated with 30 nm pyrene-labeled actin and then rapidly mixed with 10 μm ATP. Over a concentration series, the fluorescence amplitude increased with [S1]. B, the dependence of amplitude on [S1] can be described by a quadratic function (Equation 6), giving a KA value of 2.5 nm for WT MyHC-emb (filled squares), 43 nm for R672H (open squares), 6.1 nm for R672C (filled circles), and 5.2 nm for T178I (open circles). C, repeating the same experiment but this time incubating the actin-S1 with saturating (20 × K5) [ADP]. Plotting the amplitude against the [S1] again gives a quadratic dependence, which in turn gives a KDA value of 706 nm for WT MyHC-emb (filled squares), 306 nm for R672H (open squares), 386 nm for R672C (filled circles), and 71 nm for T178I (open circles). Concentrations of S1 are before mixing.
FIGURE 6.
FIGURE 6.
Nucleotide binding to embryonic S1. A, tryptophan fluorescence changes observed on rapidly mixing 50 μm ATP with 100 nm WT MyHC-emb and for the three mutants S1s. All four were best described with a single exponential fit yielding kobs = 102 s−1 (amplitude = 6.6%), 7.3 s−1 (amplitude = 1.6%), 12 s−1 (amplitude = 3.5%), and 18 s−1 (amplitude = 1.4%) for WT MyHC-emb, R672H, R672C, and T178I, respectively. The single exponential fits are shown with solid black lines. B, the hyperbolic dependence of kobs on [ATP] yielded K1k+2 = 8.8, 0.3, 0.95, and 2.1 μm−1 s−1 for WT MyHC-emb (filled squares), R672H (open squares), R672C (filled circles), and T178I (open circles), respectively. The maximum rate gives a value of kmax = 134 s−1 for WT MyHC-emb, 15.2 s−1 for R672H, 25 s−1 for R672C, and 17.8 s−1 for T178I. C, the protein fluorescence observed after mixing 0.1 μm WT MyHC-emb preincubated with 50 nm ADP with 50 μm ATP. The data could be best described by a double exponential function with a fast phase (kobs = 92 s−1 and amplitude = 5.9%) and a slow phase (kobs = 1 s−1 and amplitude = 1.3%). D, the dependence of the amplitudes of the fast and slow phases on [ADP] was hyperbolic, resulting in a KD = 0.13 ± 0.06 μm for the fast phase (filled squares) and KD = 0.12 ± 0.03 μm for the slow phase (open squares). This measurement was not possible with the R672H or T178I mutations, whereas there was only one phase for the R672C.
FIGURE 7.
FIGURE 7.
ATPase assays of the WT MyHC-emb and the three FSS mutations. A, actin activation of the S1 ATPases with best fit Michaelis-Menten curves superimposed on the data points. These fits gave a Vmax = 7.0 s−1 for WT MyHC-emb and a Km = 38.5 μm (filled squares). The R672H (filled circles) had a Vmax = 1.3 s−1 and a Km = 3.7 μm; R672C (open squares) had a Vmax = 3.5 s−1 and a Km = 4.6 μm; and T178I (open circles) had a Vmax = 0.2 s−1 and a Km = 0.7 μm. B, the ATPase assay of the T178I mutant on a log time scale to highlight the T178I fit to a Michaelis-Menten function despite a small activation by actin. Results plotted are from two protein preparations with 3–4 technical replicates each time.
FIGURE 8.
FIGURE 8.
Homology model of WT MyHC-emb showing the relay helix, Arg672, and Phe122, Phe490, and Phe670 in rigor and pre-power stroke. A, structure based on scallop structure (PDB code 2OS8), where the motor domain is in the rigor conformation and the relay helix is straight (blue). There is a single π-cation bond between Arg672 and Phe490 shown in orange. A superimposed second relay helix (in red) is based on scallop structure in the pre-power stroke conformation (PDB code 1QVI). The relay helix is bent just after Phe490, and the π-cation interaction between Arg672 and Phe490 remains. B, Arg672 (blue), Phe489 (orange), Phe490 (green), and Phe670 (red) are shown with the relay helix to illustrate the phenylalanine residues acting as pivot point for the relay helix bend. The proximity of Arg672 to Phe490 and the interactions of Arg672 with Phe490 possibly anchor the helix, allowing it to bend.
FIGURE 9.
FIGURE 9.
Percentage changes in the rate and equilibrium constants of WT MyHC-emb compared with WT MyHC-β (A and B) and the three FSS mutations compared with WT MyHC-emb (C and D). A and C, equilibrium constants are defined in M units; a positive percentage means an increase in affinity, whereas a negative value indicates a weakening of affinity. B and D, the rate constants are defined in units of s−1 or m−1 s−1, and a positive percentage indicates a faster rate constant, whereas a negative percentage indicates a slower rate constant. ns, not significant; *, p < 0.05; **, p < 0.01; ***, p < 0.001.

References

    1. Oldfors A. (2007) Hereditary myosin myopathies. Neuromusc. Disord. 17, 355–367 - PubMed
    1. Hamady M., Buvoli M., Leinwand L.A., and Knight R. (2010) Estimate of the abundance of cardiomyopathic mutations in the β-myosin gene. Int. J. Cardiol. 144, 124–126 - PMC - PubMed
    1. Clarke N. F., Amburgey K., Teener J., Camelo-Piragua S., Kesari A., Punetha J., Waddell L. B., Davis M., Laing N. G., Monnier N., North K. N., Hoffman E. P., and Dowling J. J. (2013) A novel mutation expands the genetic and clinical spectrum of MYH7-related myopathies. Neuromusc. Disord. 23, 432–436 - PMC - PubMed
    1. Lamont P. J., Wallefeld W., Hilton-Jones D., Udd B., Argov Z., Barboi A.C., Bonneman C., Boycott K. M., Bushby K., Connolly A. M., Davies N., Beggs A. H., Cox G. F., Dastgir J., DeChene E. T., et al. (2014) Novel mutations widen the phenotypic spectrum of slow skeletal/β-cadiac myosin (MYH7) distal myopathy. Human Mutation 35, 868–879 - PMC - PubMed
    1. Yüceyar N., Ayhan Ö., Karasoy H., and Tolun A. (2015) Homozygous MYH7R1820W mutation results in recessive myosin storage myopathy: scapuloperoneal and respiratory weakness with dilated cardiomyopathy. Neuromusc. Disord. 25, 340–344 - PubMed

Publication types

MeSH terms

Supplementary concepts