Observational Study
. 2016 Mar;95(9):e2743.
doi: 10.1097/MD.0000000000002743.

False Appearance of Gene-Environment Interactions in Genetic Association Studies

Affiliations
Observational Study

False Appearance of Gene-Environment Interactions in Genetic Association Studies

Yi-Shan Su et al. Medicine (Baltimore). 2016 Mar.

Abstract

Under the assumption of gene-environment independence, unknown/unmeasured environmental factors, irrespective of what they may be, cannot confound the genetic effects. This may lead many people to believe that genetic heterogeneity across different levels of the studied environmental exposure should only mean gene-environment interaction--even though other environmental factors are not adjusted for. However, this is not true if the odds ratio is the effect measure used for quantifying genetic effects. This is because the odds ratio is a "noncollapsible" measure--a marginal odds ratio is not a weighted average of the conditional odds ratios, but instead has a tendency toward the null. In this study, the authors derive formulae for gene-environment interaction bias due to noncollapsibility. They use computer simulation and real data example to show that the bias can be substantial for common diseases. For genetic association study of nonrare diseases, researchers are advised to use collapsible measures, such as risk ratio or peril ratio.


Conflict of interest statement

The authors have no conflicts of interest to disclose.

Figures

FIGURE 1
FIGURE 1
Causal diagrams showing the relations between G (genetic factor), E (environmental factor), U (unknown/unmeasured factor), and D (disease).
FIGURE 2
FIGURE 2
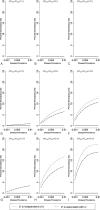
Percent discrepancy under various scenarios [A:(ORED, ORUD,) = (1,1); B:(ORED, ORUD,) = (5,1); C:(ORED, ORUD,) = (10,1); D:(ORED, ORUD,) = (1,5); E:(ORED, ORUD,) = (5.5); F:(ORED, ORUD,) = (10,5); G:(ORED, ORUD,) = (1,10); H:(ORED, ORUD,) = (5,10); I:(ORED, ORUD,) = (10,10); dotted lines: E is independent of U; dashed lines: E is associated with U]. OR = odds ratio.
FIGURE 3
FIGURE 3
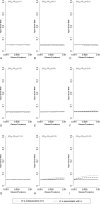
Type I error rate for the gene–environment interaction in case-control studies with small sample size (n = 500) [A:(ORED, ORUD,) = (1,1); B:(ORED, ORUD,) = (5,1); C:(ORED, ORUD,) = (10,1); D:(ORED, ORUD,) = (1,5); E:(ORED, ORUD,) = (5,5); F:(ORED, ORUD,) = (10,5); G:(ORED, ORUD,) = (1,10); H:(ORED, ORUD,) = (5,10); I:(ORED, ORUD,) = (10,10); dotted lines: E is independent of U; dashed lines: E is associated with U]. OR = odds ratio.
FIGURE 4
FIGURE 4
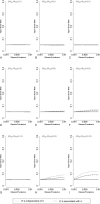
Type I error rate for the gene–environment interaction in case-control studies with moderate sample size (n = 1000) [A:(ORED, ORUD,) = (1,1); B:(ORED, ORUD,) = (5,1); C:(ORED, ORUD,) = (10,1); D:(ORED, ORUD,) = (1,5); E:(ORED, ORUD,) = (5,5); F:(ORED, ORUD,) = (10,5); G:(ORED, ORUD,) = (1,10); H:(ORED, ORUD,) = (5,10); I:(ORED, ORUD,) = (10,10); dotted lines: E is independent of U; dashed lines: E is associated with U]. OR = odds ratio.
FIGURE 5
FIGURE 5
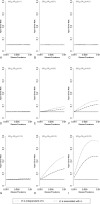
Type I error rate for the gene–environment interaction in case-control studies with large sample size (n = 5000) [A:(ORED, ORUD,) = (1,1); B:(ORED, ORUD,) = (5,1); C:(ORED, ORUD,) = (10,1); D:(ORED, ORUD,) = (1,5); E:(ORED, ORUD,) = (5,5); F:(ORED, ORUD,) = (10,5); G:(ORED, ORUD,) = (1,10); H:(ORED, ORUD,) = (5,10); I:(ORED, ORUD,) = (10,10); dotted lines: E is independent of U; dashed lines: E is associated with U]. OR = odds ratio.

Similar articles

References

    1. Cordell HJ. Estimation and testing of gene–environment interactions in family-based association studies. Genomics 2009; 93:5–9. - PMC - PubMed
    1. Hunter DJ. Gene–environment interactions in human diseases. Nat Rev Genet 2005; 6:287–298. - PubMed
    1. Le Marchand L, Wilkens LR. Design considerations for genomic association studies: importance of gene–environment interactions. Cancer Epidemiol Biomarkers Prev 2008; 17:263–267. - PubMed
    1. Lewis CM, Knight J. Introduction to genetic association studies. Cold Spring Harb Protoc 2012; 2012:297–306. - PubMed
    1. Rava M, Ahmed I, Demenais F, et al. Selection of genes for gene–environment interaction studies: a candidate pathway-based strategy using asthma as an example. Environ Health 2013; 12:56. - PMC - PubMed

Publication types

MeSH terms

Substances