Review
. 2016 May-Jul:52-54:339-354.
doi: 10.1016/j.matbio.2016.03.001. Epub 2016 Mar 3.

Osteophyte formation and matrix mineralization in a TMJ osteoarthritis mouse model are associated with ectopic hedgehog signaling

Affiliations
Review

Osteophyte formation and matrix mineralization in a TMJ osteoarthritis mouse model are associated with ectopic hedgehog signaling

Till E Bechtold et al. Matrix Biol. 2016 May-Jul.

Abstract

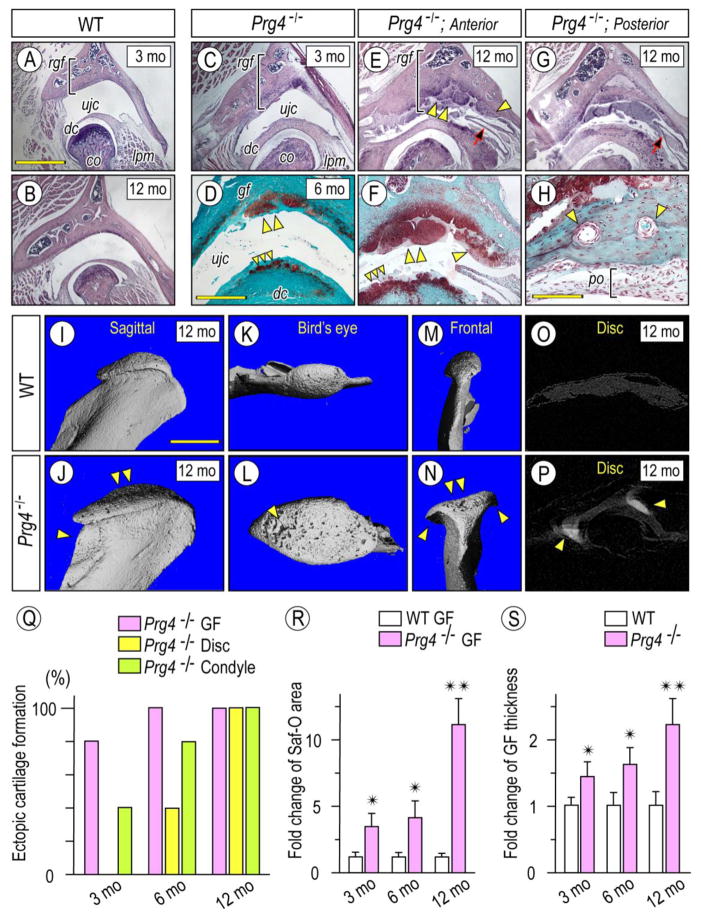
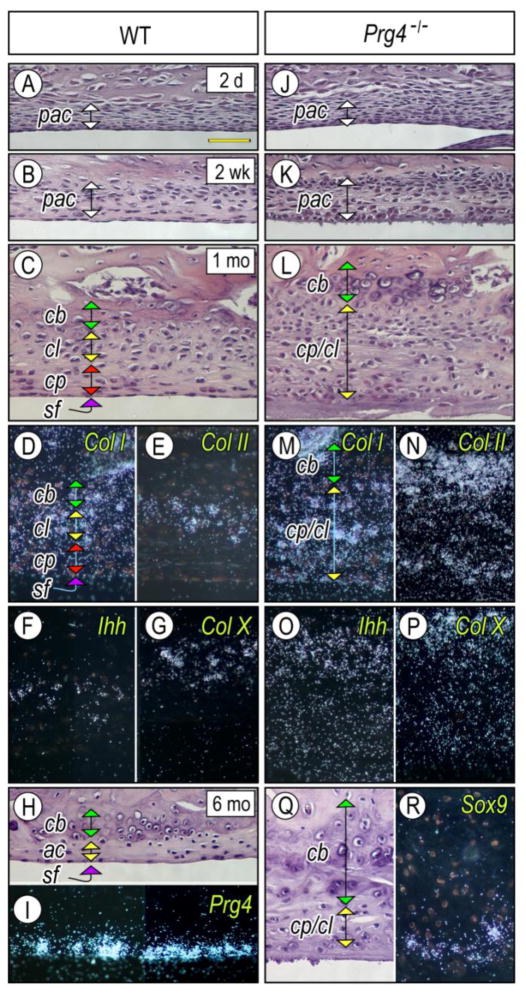
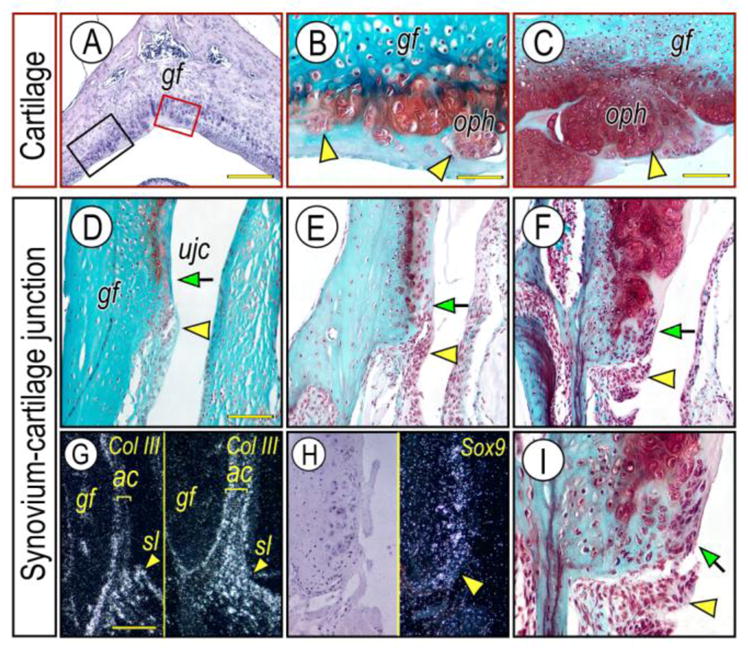
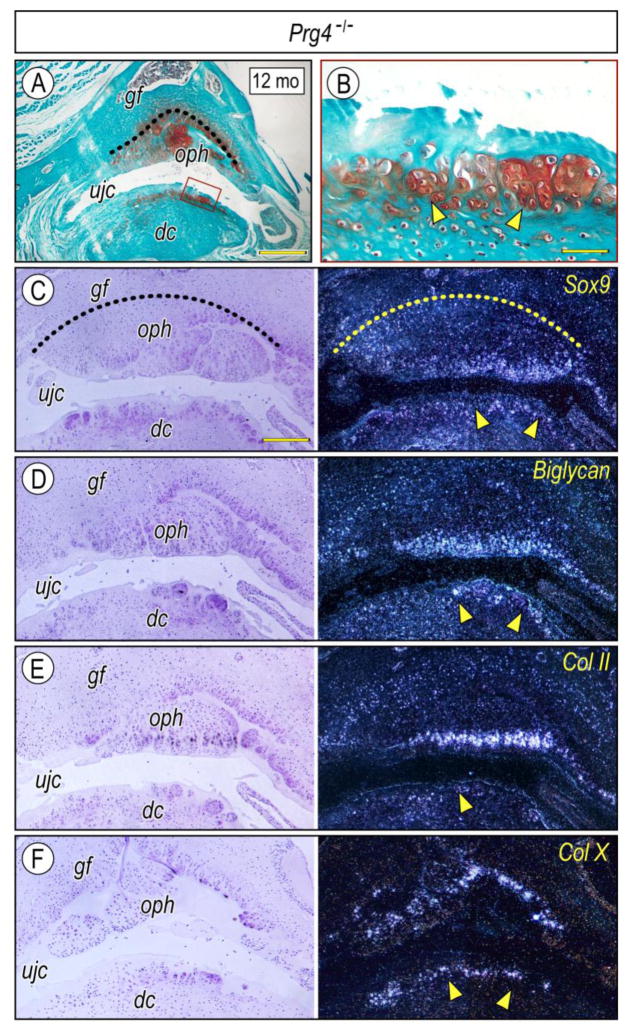
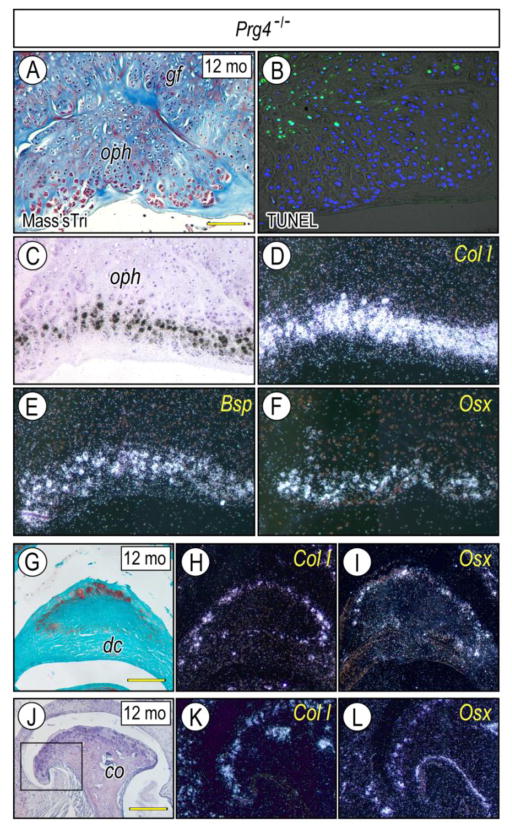
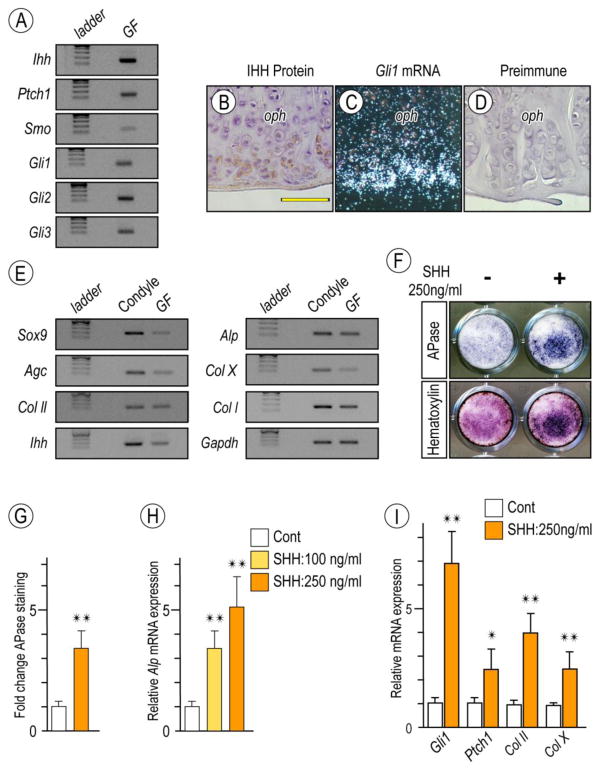
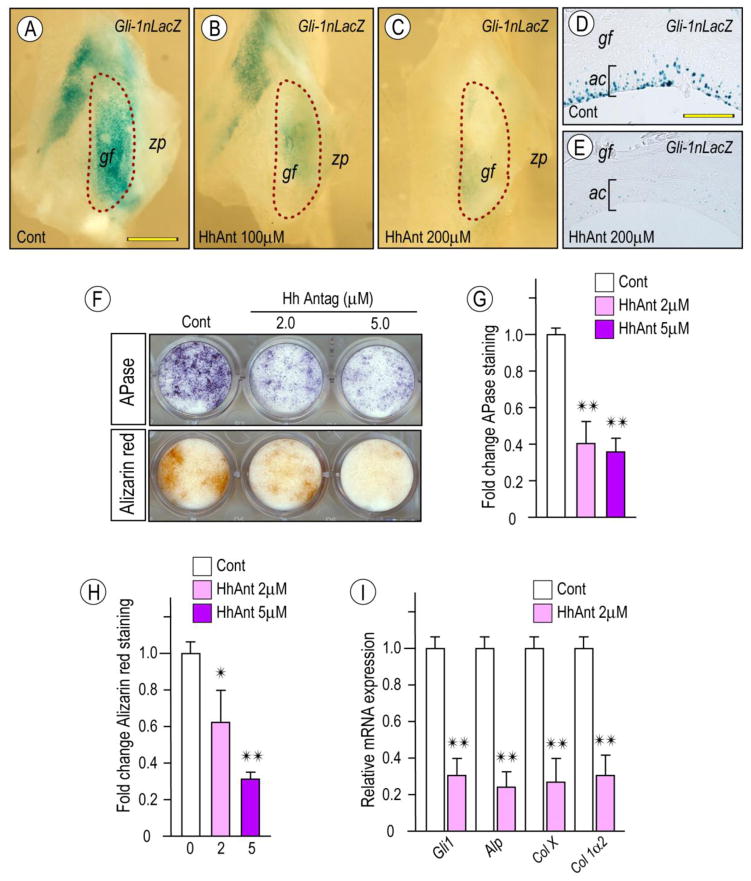
The temporomandibular joint (TMJ) is a diarthrodial joint that relies on lubricants for frictionless movement and long-term function. It remains unclear what temporal and causal relationships may exist between compromised lubrication and onset and progression of TMJ disease. Here we report that Proteoglycan 4 (Prg4)-null TMJs exhibit irreversible osteoarthritis-like changes over time and are linked to formation of ectopic mineralized tissues and osteophytes in articular disc, mandibular condyle and glenoid fossa. In the presumptive layer of mutant glenoid fossa's articulating surface, numerous chondrogenic cells and/or chondrocytes emerged ectopically within the type I collagen-expressing cell population, underwent endochondral bone formation accompanied by enhanced Ihh expression, became entrapped into temporal bone mineralized matrix, and thereby elicited excessive chondroid bone formation. As the osteophytes grew, the roof of the glenoid fossa/eminence became significantly thicker and flatter, resulting in loss of its characteristic concave shape for accommodation of condyle and disc. Concurrently, the condyles became flatter and larger and exhibited ectopic bone along their neck, likely supporting the enlarged condylar heads. Articular discs lost their concave configuration, and ectopic cartilage developed and articulated with osteophytes. In glenoid fossa cells in culture, hedgehog signaling stimulated chondrocyte maturation and mineralization including alkaline phosphatase, while treatment with hedgehog inhibitor HhAntag prevented such maturation process. In sum, our data indicate that Prg4 is needed for TMJ integrity and long-term postnatal function. In its absence, progenitor cells near presumptive articular layer and disc undergo ectopic chondrogenesis and generate ectopic cartilage, possibly driven by aberrant activation of Hh signaling. The data suggest also that the Prg4-null mice represent a useful model to study TMJ osteoarthritis-like degeneration and clarify its pathogenesis.

Keywords: Heterotopic cartilage; Ihh; Lubricin; Osteophyte; Prg4; TMJ.


Conflict of interest statement

The authors declare no potential conflicts of interest with respect to the authorship and/or publication of this article.

Figures

Figure 1
Figure 1. Abnormal cartilage, osteophytes and bone forming in Prg4−/− mice
Frontal sections from TMJs prepared from 3 month- (A, C), 6 month- (D) and 12 month-old (B, E–H) control (A, B) and Prg4−/− (CH) mice were processed for Hematoxylin (AC, E, G) or Safranin-O/fast green (D, F, H) staining. Multiple osteophytes (D, E, F; double arrowhead) with preferential growth into the upper joint cavity (ujc) in Prg4−/− mice resulted in the increased roof of the GF thickness (rgf, bracket) and decreased the space of the upper joint cavity (B vs E, G). Note that osteophyte formation was initiated in 2 distinct sites of the GF/eminence: the articulating surface (double arrowhead in D–F) and the synovium/articular cartilage junction (arrowhead in E, F). Note also that bone tissue forming in the posterior portion of Prg4−/− TMJ was supplied with well-developed nutrient vessels (arrowheads) and coated with periosteum-like tissue (H; po, bracket) (H). 3D microCT images of mandibular condyles from 12 month-old control (I–O) and Prg4−/− (J–P) mice: sagittal (I, J), bird’s eye (K, L) or frontal (M, N) view (n=3 for each group). X-ray images of articular discs from 12 month-old control (O) and Prg4−/− (P) mice and ectopic mineralization detected in mutant disc (P; arrowheads). Analysis of serial frontal and parasagittal sections reveals: increased incidence of ectopic cartilage/osteophyte formation in GF, disc and condyle in Prg4−/− mice (Q. n=5 for 3 months and 5 months and n=3 for 12 months); fold change of Safranin-O stained area of articular cartilage and osteophytes of glenoid fossa/section (R, n=3 for mouse/each group); and thickness of roof of glenoid fossa (rgf) (S, indicated by bracket, n=3 for mouse/each group) in Prg4−/− mice compared to age-matched control littermates. Areas were randomly selected from 8 sections per sample (n=3 for mouse/each group, *p <0.05, **p <0.01) and presented as average ±SD. Scale bars: 0.9 mm in A for A, B, C, E, G; 550 μm in D for D, F; 65 μm in H; 1.2 mm for I–P. gf, glenoid fossa; dc, disc; cd, condyle, ujc, upper joint cavity; po, periosteum; lpm, lateral pterygoid muscle.
Figure 2
Figure 2. Excessive chondrogenesis and chondroid bone forming in glenoid fossa of Prg4-null mice
Parasagittal sections prepared from TMJs of 2 day- (A, J), 2 week- (B, K), 1 month- (CG, LP) and 5 month-old (H, I, Q, R) control (AI) and Prg4−/− (JR) mice were stained with Hematoxylin & Eosin (AC, HL, Q). Note that the thickened presumptive articular cartilage layer (pac) (K) resulted in the expansion of the chondrocyte progenitor layer (cp), chondrocyte layer (cl) and chondroid bone zone (cb) in Prg4−/− TMJs (L, Q) compared to controls (C, H). Sections were processed for in situ hybridization with isotope-labeled riboprobes for Col Iα2 (D, M), Col IIα1 (E, N), Ihh (F, O). Col X (G, P), Prg4 (I) and Sox9 (R). Scale bar: 55 μm in A for AR.
Figure 3
Figure 3. Major steps of osteophyte development near articulating cartilage and synovium-articular cartilage junction in Prg4−/− glenoid fossa
Frontal sections prepared from TMJs of 3 month- (D; G, right panel), 6-month- (A, B, E), 10 month- (C, F, I) old Prg4−/− mice were stained with Hematoxylin & Eosin (A) and Safranin-O (B–F, I). Osteophyte development was investigated in red box area (articular cartilage) or black box area (synovium-cartilage junction) of the glenoid fossa (A) representing the articulating cartilage and synovium-articular cartilage junction, respectively. Note that multiple osteophyte-like chondrocyte clusters start forming in the articulating cartilage surface (B, arrowheads), and grow into osteophytes (oph) (C, arrowhead). Synovial cell mass (D–F; arrowhead) present at the synovium-articular cartilage junction before chondrocyte differentiation indicated by lack of Safranin-O staining and its integration into the developing osteophytes (F, I, arrow) in the advanced OA condition. Synovium-articular cartilage junction in F was magnified to reveal the synovial cell mass (I, arrowhead) and integration of synovial cells into developing cartilage/osteophyte (I, arrow). In situ hybridization with isotope-labeled RNA probe of type III collagen (Col-III) (G, left panel, control; right panel, mutant) and Sox9 (H). Note that Col-III transcripts are abundant in the synovial membrane and are much less at the articular cartilage surface, while a numerous number of Col-III-expressing cells are detectable in the Prg4−/− glenoid fossa. Sox-9 expressing chondroprogenitor cells detected in the synovium-articular cartilage junction in Prg4−/− glenoid fossa. Scale bars: 150 μm in A; 45 μm in B for B, I; 80 μm in C for C–F; 125 μm in G for G–H. gf, glenoid fossa; ujc, upper joint cavity; oph, osteophyte; sl, synovial lining cell; ac, articular cartilage.
Figure 4
Figure 4. Expression of chondrogenic markers in osteophytes and extopic cartilage developing in Prg4-null mice
Frontal sections prepared from TMJs of 12 month-Prg4-null mice were stained with Safranin-O (A, B). The glenoid fossa articular cartilage is defined by a dashed line to clarify the developing osteophytes (A, C). Ectopic cartilage forming at the surface of the articular disc articulating with osteophytes (A, boxed area) enlarged in B. Serial sections were processed for in situ hybridization with isotope-labeled riboprobes for Sox9 (C), Biglycan (D), Col IIα1 (E) and Col X (F). Note intense labeling of Sox9, Biglycan, and Col IIα1 transcripts, detected in the peripheral chondrocytes of the osteophytes, indicating preferential growth of the osteophyte into the upper joint cavity (ujc). Note also Col X expression in the relatively deep region of the cartilage (arrowhead). Scale bars: 250 μm in A; 45 μm in B; 125 μm in C for C–F. gf, glenoid fossa; ujc, upper joint cavity; dc, disc; oph, osteophyte.
Figure 5
Figure 5. Expression of osteogenic markers in osteophytes and/or extopic cartilage developing in glenoid fossa, articular disc and mandibular condyle of Prg4-null mice
Frontal sections were prepared from TMJs of 12 month-Prg4-null mice and stained with Masson’s trichrome (A), Safranin-O (G) and Hematoxylin (J) and processed for TUNEL to detect apoptosis (B). Serial sections were also processed for in situ hybridization with isotope-labeled riboprobes for Col Iα2 (D, H, K), Bone sialoprotein (E) and Osterix (F, I, L) in osteophytes (oph) forming in the glenoid fossa (gf) (A–F) and mandibular condyle (co) (J–L) and ectopic cartilage forming the articular disc (dc) (G–I). Note intense expression of osteogenic markers at the peripheral region of osteophytes resembling that of chondrogenic markers (Fig. 4), a characteristic feature of seconday cartilage. Boxed area in J was enlarged in K and L. Scale bars: 55 μm in A for A–F; 80 μm in G for G–I, K–L; 250 μm in J. gf, glenoid fossa; ujc, upper joint cavity; dc, disc; oph, osteophyte; co, condyle.
Figure 6
Figure 6. Detection of Hh signaling in osteoarthritic TMJs in Prg4-null glenoid fossa and Hh-induced stimulatory effect on chondrocyte maturation by primary glenoid fossa cells
Semi-quantitative PCR analysis of expression of Ihh and its signaling associated molecules in glenoid fossae (GF)/eminences from 6-month-old Prg4-null mice (A). IHH protein expression by Immunohistochemistry (B) and Gli-1 expression by in situ hybridization (C) detected at the peripheral region of the osteophytes developing in the glenoid fossa. Sections treated with preimmune chicken IgY served as controls (D). Semi-quantitative PCR analysis of expression of chondrocyte markers in mandibular chondyle and glenoid fossa (GF) (E). Primary gleniod fossa cells were cultured on 24-well plates and stimulated with rhSHH protein (250ng/ml) for 9 days, fixed, and processed for Alkaline phosphatase activity (F; upper panel). Cultures were also counterstained with Hematoxylin to reveal the presence of cells in cultures (F; lower panel). Integrated density of Alkaline phosphatase (APase)-stained cultures was measured by ImageJ (G; n=3, *p <0.05). Untreated cultures served as reference for comparison between groups. The data are expressed in arbitrary units. Histograms depicting rhSHH-dose dependent activation of Alkaline phosphatase (Alp) mRNA (H) and increased Hh-transcriptional targets and chondrocyte maturation marker (I) in day 9 primary gleniod fossa cell culture compared to controls (*p <0.05, **p <0.02). Scale bars: 55 μm in B for B–D. oph, osteophyte.
Figure 7
Figure 7. Inhibition of Hh signaling attenuates Gli-1nLacZ reporter activity in glenoid fossa/eminence tissues and chondrocyte maturation in primary glenoid fossa cells
Glenoid fossa/eminence from 2 month-old-Gli1-nLacZ reporter mice were culture in the presence of HhAntag at indicated concentrations (B, C) or control vehicle (A), processed for whole-mount LacZ staining (A–C) and subsequent sectioning (D, E). Note decreased LacZ activity in the articular cartilage of glenoid fossa/eminence treated with HhAntag vs control (D, E; respectively). Primary glenoid fossa cells were cultured on 24-well plates and treated with HhAntag at indicated concentrations or control vehicle for 9 days, fixed, and processed for Alkaline phosphatase activity (F, top panel) or Alizarin red staining (F, lower panel). Integrated density of Alkaline phosphatase-staining (G) and Alizarin red-staining (H) were quantified by ImageJ (G; n=3, *p <0.05, **p <0.02). Untreated cultures served as reference for comparison between groups. The data are expressed in arbitrary units. Histograms depicting HhAntag-dose dependent decrease of Hh signaling molecules and chondrocyte maturation markers in day 9 primary glenoid fossa cell culture compared to controls (**p <0.02). Scale bars: 2.4 mm in A for A–C; 80 μm in D for D–E. gf, glenoid fossa; zp, zygomatic process; ac, articular cartilage.

References

    1. Alman BA. The role of hedgehog signalling in skeletal health and disease. Nat Rev Rheumatol. 2015;11:552–60. - PubMed
    1. Arnett GW, Milam SB, Gottesman L. Progressive mandibular retrusion-idiopathic condylar resorption. Part II. Am J Orthod Dentofacial Orthop. 1996;110:117–27. - PubMed
    1. Bakker AC, van de Loo FA, van Beuningen HM, Sime P, van Lent PL, van der Kraan PM, Richards CD, van den Berg WB. Overexpression of active TGF-beta-1 in the murine knee joint: evidence for synovial-layer-dependent chondro-osteophyte formation. Osteoarthritis Cartilage. 2001;9:128–36. - PubMed
    1. Bechtold TE, Saunders C, Mundy C, Um H, Decker RS, Salhab I, Kurio N, Billings PC, Pacifici M, Nah HD, Koyama E. Excess BMP Signaling in Heterotopic Cartilage Forming in Prg4-null TMJ Discs. J Dent Res 2015 - PMC - PubMed
    1. Beresford WA. Chondroid bone, secondary cartilage and metaplasia. Baltimore, MD, USA: Urban & Schwarzenberg; 1981. pp. 23–47.

Publication types