

Modelling the relative abundance of the primary African vectors of malaria before and after the implementation of indoor, insecticide-based vector control
- PMID: 26945997
- PMCID: PMC4779559
- DOI: 10.1186/s12936-016-1187-8
Modelling the relative abundance of the primary African vectors of malaria before and after the implementation of indoor, insecticide-based vector control
Abstract
Background: Malaria remains a heavy burden across sub-Saharan Africa where transmission is maintained by some of the world's most efficient vectors. Indoor insecticide-based control measures have significantly reduced transmission, yet elimination remains a distant target. Knowing the relative abundance of the primary vector species can provide transmission models with much needed information to guide targeted control measures. Moreover, understanding how existing interventions are impacting on these relative abundances highlights where alternative control (e.g., larval source management) is needed.
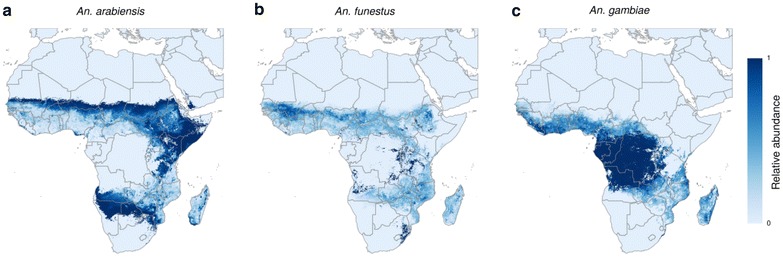
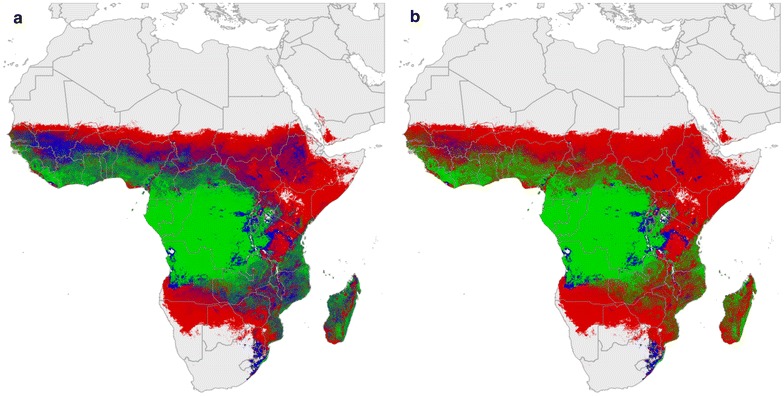
Methods: Using the habitat suitability probabilities generated by predictive species distribution models combined with data collated from the literature, a multinomial generalized additive model was applied to produce relative abundance estimates for Anopheles arabiensis, Anopheles funestus and Anopheles gambiae/Anopheles coluzzii. Using pre- and post-intervention abundance data, estimates of the effect of indoor insecticide-based interventions on these relative abundances were made and are illustrated in post-intervention maps.
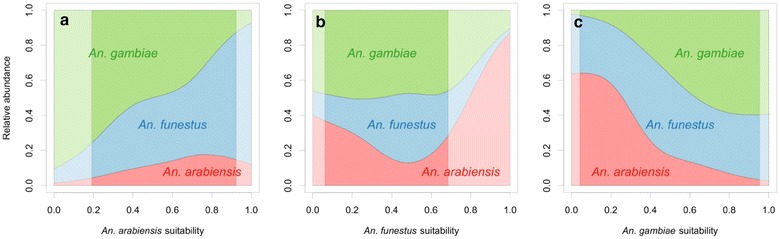
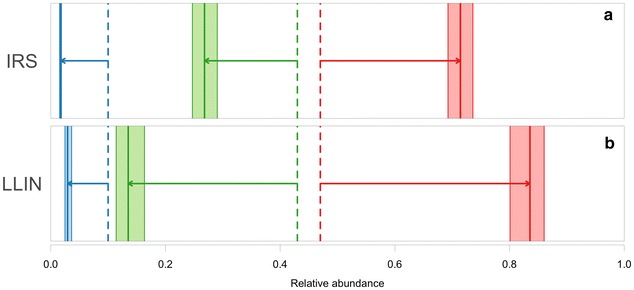
Results: Conditional effect plots and relative abundance maps illustrate the individual species' predicted habitat suitability and how they interact when in sympatry. Anopheles arabiensis and An. funestus show an affinity in habitat preference at the expense of An. gambiae/An. coluzzii, whereas increasing habitat suitability for An. gambiae/An. coluzzii is conversely less suitable for An. arabiensis but has little effect on An. funestus. Indoor insecticide-based interventions had a negative impact on the relative abundance of An. funestus, and a lesser effect on An. arabiensis. Indoor residual spraying had the greatest impact on the relative abundance of An. funestus, and a lesser effect on An. gambiae/An. coluzzii. Insecticide-treated bed nets reduced the relative abundance of both species equally. These results do not indicate changes in the absolute abundance of these species, which may be reduced for all species overall.
Conclusions: The maps presented here highlight the interactions between the primary vector species in sub-Saharan Africa and demonstrate that An. funestus is more susceptible to certain indoor-based insecticide interventions than An. gambiae/An. coluzzii, which in turn, is more susceptible than An. arabiensis. This may provide An. arabiensis with a competitive advantage where it is found in sympatry with other more endophilic vectors, and potentially increase the need for outdoor-based vector interventions to deal with any residual transmission barring the way to malaria elimination.
Figures
References
-
- Coetzee M. Distribution of the African malaria vectors of the Anopheles gambiae complex. Am J Trop Med Hyg. 2004;70:103–104. - PubMed
-
- Charlwood JD, Smith T, Kihonda J, Heiz B, Billingsley PF, Takken W. Density-independent feeding success of malaria vectors (Diptera, Culicidae) in Tanzania. Bull Entomol Res. 1995;85:29–35. doi: 10.1017/S0007485300051981. - DOI
-
- Gillies MT, de Meillon B. The Anophelinae of Africa South of the Sahara (Ethiopian zoogeographical region) 2. Johannesburg: The South African Institute for Medical Research; 1968.
Publication types
MeSH terms
Substances
Grants and funding
LinkOut - more resources
Full Text Sources
Other Literature Sources
Medical
